A new model for predicting adverse outcomes in arrhythmogenic right ventricular cardiomyopathy
Key words: arrhythmogenic cardiomyopathy, biomarkers, heart failure, heart transplantation


 CC BY-NC-SA 4.0
A new model for predicting adverse outcomes in arrhythmogenic right ventricular cardiomyopathy
Introduction: Arrhythmogenic right ventricular cardiomyopathy (ARVC) is a progressive disease leading to ventricular arrhythmias and heart failure. Determining optimal time for heart transplantation (HTx) is challenging; therefore, it is necessary to identify risk factors for disease progression.
Objectives: The study aimed to identify predictors of end‑stage heart failure and to evaluate the role of biomarkers in predicting adverse outcomes in ARVC.
Patients and methods: A total of 91 individuals with ARVC (59 men; mean [SD] age, 47 [16] years) were included. In all patients, information on medical history was collected, electrocardiography and echocardiography were performed, and serum levels of selected biomarkers (soluble form of the ST2 protein [sST2], galectin‑3 [Gal‑3], extracellular matrix metalloproteinases [MMP‑2 and MMP‑9], N‑terminal pro–B‑type natriuretic peptide [NT‑proBNP], and high‑sensitivity troponin T [hs‑TnT]) were measured. Thereafter, the participants were followed for the primary end point of death or HTx, as well as the secondary end point of major arrhythmic events (MAEs), defined as sudden cardiac death, ventricular fibrillation, sustained ventricular tachycardia, or appropriate implantable cardioverter‑defibrillator intervention.
Results: During the median (interquartile range) follow‑up of 36.4 (29.8–41.2) months, 13 patients (14%) reached the primary end point of death or HTx, and 27 (30%) experienced MAEs. The patients who achieved the primary end point had higher levels of sST2, MMP‑2, NT‑proBNP, and hs‑TnT, but not of Gal‑3 and MMP‑9. Three factors turned out to be independent predictors of death or HTx: higher NT‑proBNP concentration (≥890.3 pg/ml), greater right ventricular end‑diastolic area (≥39 cm2), and a history of atrial tachycardia. None of the biomarkers predicted MAEs.
Conclusions: An NT‑proBNP concentration greater than or equal to 890.3 pg/ml, right ventricular end‑diastolic area of 39 cm2 or greater, and a history of atrial tachycardia were identified as risk factors for death or HTx in ARVC. Higher levels of sST2, MMP‑2, NT‑proBNP, and hs‑TnT were associated with reaching the primary end point of death or HTx. The biomarkers had no value in predicting ventricular arrhythmias.
What's new?
The study aimed to identify predictors for developing end‑stage heart failure and to evaluate the role of biomarkers in predicting adverse outcomes in arrhythmogenic right ventricular cardiomyopathy (ARVC). We showed that some of the analyzed biomarkers (soluble form of the ST2 protein, extracellular matrix metalloproteinase [MMP]-2, N‑terminal pro–B‑type natriuretic peptide, and high‑sensitivity troponin T, but not galectin‑3 and MMP‑9) had a prognostic value for death or heart transplantation in ARVC, but none of them were useful for predicting ventricular arrhythmia. Moreover, we proposed a prognostic model for end‑stage heart failure including 3 independent predictors: an NT‑proBNP concentration greater than or equal to 890.3 pg/ml, right ventricular end‑diastolic area greater than or equal to 39 cm2, and a history of atrial tachycardia. Such a model may be helpful for clinicians in the day‑to‑day management of patients with ARVC.
Introduction
Arrhythmogenic right ventricular cardiomyopathy (ARVC) is a heart muscle disease characterized by progressive fibrofatty replacement of the myocardium.1 The prevalence of ARVC in the general population is estimated at 1:2000 to 1:5000, and approximately 50% of patients have a positive family history.2 The disease predominantly affects the right ventricle (RV), but biventricular and left‑dominant forms are also observed.3 In most cases, ARVC is caused by pathogenic variants of genes encoding desmosomal proteins, with plakophilin‑2 gene (PKP2) mutations being the most common.4 Defects in the structure of desmosomes result in cardiac myocyte detachment, death, and subsequent replacement with fibrous and fatty tissues.5 These changes lead to electrical instability and ventricular arrhythmias, as well as heart failure (HF) at later stages of the disease.6 The diagnosis of ARVC is based on a set of clinical criteria proposed and then revised by the International Task Force.7
Currently, due to widespread use of implantable cardioverter‑defibrillators (ICDs) to prevent sudden cardiac death (SCD), an increasing number of patients with ARVC develop HF.8 At advanced stages of the disease, heart transplantation (HTx) should be considered; however, selecting optimal time for this treatment remains challenging due to the predominant RV pathophysiology.9,10 Numerous novel biomarkers have been recently studied in cardiology, and the results suggest that some of them can be introduced into routine clinical practice. Among these novel biomarkers are those of myocardial fibrosis, such as the soluble form of the ST2 protein (sST2), galectin‑3 (Gal‑3), and extracellular matrix metalloproteinases (MMPs).11 According to current knowledge, it seems that cardiac biomarkers could play a potential role in predicting the course of ARVC and may help identify HTx candidates.
Patients and methods
Study design
The purpose of the study was to identify risk factors for end‑stage HF in ARVC and to evaluate the prognostic value of markers of myocardial fibrosis (sST2, Gal‑3, MMP‑2, and MMP‑9), as well as of N‑terminal pro–B‑type natriuretic peptide (NT‑proBNP) and high‑sensitivity troponin T (hs‑TnT). A cohort of ARVC patients treated at the National Institute of Cardiology, Warsaw, Poland was included into this single‑center study. All patients had a definite diagnosis of ARVC according to the 2010 Task Force criteria,7 and no specific exclusion criteria were applied. Clinical evaluation was performed, and serum levels of the selected biomarkers were assessed. Thereafter, the participants were followed for the primary end point of cardiac death or HTx, and the secondary end point of major arrhythmic events (MAEs), defined as SCD, ventricular fibrillation (VF), sustained ventricular tachycardia (sVT), or appropriate ICD intervention.
The study conformed with the principles outlined in the Declaration of Helsinki and was approved by the institutional ethics committee (1703). All patients gave their written informed consent to participate in the study.
Patient population and clinical evaluation
The study population consisted of 91 adults with a definite diagnosis of ARVC. The patients were interviewed for their medical history, including a history of ventricular and atrial arrhythmias, ICD interventions, and symptoms of HF. Atrial arrhythmias were defined as at least 1 episode of atrial fibrillation (AF), atrial flutter (AFl), or atrial tachycardia (AT) lasting at least 30 seconds. Symptoms of fluid retention or liver congestion were classified as a RV failure. The results of 12‑lead electrocardiography and 24‑hour Holter echocardiography were analyzed. Standard transthoracic echocardiography was performed by experienced operators using M‑mode, 2‑dimensional, and Doppler techniques.
Biochemical analyses
Serum was isolated from blood samples and stored at –80 °C. The levels of sST2, Gal‑3, MMP‑2, and MMP‑9 were measured using the Quantikine enzyme‑linked immunosorbent assay (R&D Systems, Minneapolis, Minnesota, United States). Levels of NT‑proBNP and hs‑TnT were assessed with Elecsys pro‑BNP II STAT and Elecsys troponin T‑high sensitive STAT tests, respectively (Roche Diagnostics, Mannheim, Germany). All tests were performed according to the manufacturer’s protocols.
Statistical analysis
Continuous variables were presented as medians with interquartile ranges (IQRs), and the comparison of these variables between 2 groups was performed using the Mann–Whitney test (the Shapiro–Wilk test showed that most of the studied variables did not follow a normal distribution). Categorical variables were expressed as frequencies and percentages and were compared using the Fisher exact test. In‑depth analysis was performed using the Cox proportional hazards model (univariable and multivariable). A receiver‑operating characteristic (ROC) analysis was performed to establish the cutoff points for continuous variables included in the multivariable model. The Kaplan–Meier survival curves were used to represent the differences in survival probability. The statistical significance of the abovementioned differences was established using the log‑rank test. P values below 0.05 were considered significant. Statistical calculations were performed using JASP and Statistica 12 software (Kraków, Poland).
Results
Patient characteristics and clinical outcomes
A total of 91 patients with ARVC were enrolled in the study. The majority of them were men (65%), and the median (IQR) age was 50 (36–60) years. Most of the patients experienced ventricular arrhythmia in the past, and 62 (68%) needed an ICD implantation. More than one‑third had a history of atrial arrhythmia (AF, AFl, or AT). Symptoms of RV failure were present in 16 individuals (18%), and the median (IQR) New York Heart Association class was 1 (1–2). Baseline characteristics of the study population, along with the echocardiographic parameters and biomarker levels, are presented in Table 1.
Variable | All patients (n = 91) | No death / HTx (n = 78) | Death / HTx (n = 13) | P value | |
Data are presented as number (percentage) of patients or median (interquartile range).
Abbreviations: AF, atrial fibrillation; AFl, atrial flutter; ARVC, arrhythmogenic right ventricular cardiomyopathy; AT, atrial tachycardia; FAC, fractional area change; Gal‑3, galectin‑3; hs‑TnT, high‑sensitivity troponin T; ICD, implantable cardioverter‑defibrillator; LAA, left atrial area; LV, left ventricle; LVEF, LV ejection fraction; MMP, extracellular matrix metalloproteinase; nsVT, nonsustained ventricular tachycardia; NT‑proBNP, N‑terminal pro–B‑type natriuretic peptide; NYHA, New York Heart Association; PVBs, premature ventricular beats; RAA, right atrial area; RV, right ventricle; RVED area, RV end‑diastolic area; RVIT, RV inflow tract; RVOT, RV outflow tract; SCD, sudden cardiac death; sST2, soluble form of the ST2 protein; sVT, sustained ventricular tachycardia; TFC, Task Force Criteria; TR, tricuspid regurgitation; TWI, T‑wave inversion; VF, ventricular fibrillation | |||||
Male sex | 59 (65) | 51 (65) | 8 (62) | 0.79 | |
Age, y | 50 (35–60) | 51 (35–60) | 39 (30–56) | 0.32 | |
Total TFC score, points | 6 (5–7) | 6 (5–7) | 7 (7–9) | 0.03 | |
History of sports activity | 31 (34) | 28 (36) | 3 (23) | 0.37 | |
Family history of ARVC | 22 (24) | 16 (21) | 6 (46) | 0.048 | |
Age at diagnosis, y | 35 (24–49) | 36 (26–51) | 28 (20–38) | 0.08 | |
History of ventricular arrhythmia | SCD | 13 (14) | 9 (12) | 4 (31) | 0.07 |
Syncope | 48 (53) | 38 (49) | 10 (77) | 0.06 | |
VF | 11 (12) | 8 (10) | 3 (23) | 0.20 | |
sVT | 61 (67) | 49 (63) | 12 (92) | 0.04 | |
nsVT | 71 (78) | 60 (77) | 11 (85) | 0.54 | |
>500 PVBs/24 h | 82 (90) | 69 (88) | 13 (100) | – | |
PVBs/24 h, count | 1342 (495–3467) | 1256 (484–3679) | 1805 (978–3312) | 0.57 | |
Catheter ablation of VT | 40 (44) | 34 (44) | 6 (46) | 0.87 | |
ICD | 62 (68) | 49 (63) | 13 (100) | – | |
Appropriate ICD interventions (n = 62) | 37 (60) | 28 (36) | 9 (69) | 0.44 | |
Inappropriate ICD interventions (n = 62) | 18 (29) | 10 (13) | 8 (62) | 0.004 | |
Atrial arrhythmia | Any type | 33 (36) | 23 (29) | 10 (77) | 0.001 |
AF | 24 (26) | 18 (23) | 6 (46) | 0.08 | |
AFl | 8 (9) | 3 (4) | 5 (38) | <0.001 | |
AT | 12 (13) | 6 (8) | 6 (46) | <0.001 | |
Symptoms | Symptoms of RV failure | 16 (18) | 8 (10) | 8 (62) | <0.001 |
NYHA class | 1 (1–2) | 1 (1–1) | 3 (2–3) | <0.001 | |
NYHA class III/IV | 11 (12) | 4 (5) | 7 (54) | <0.001 | |
Electrocardiography (n = 89) | QRS duration in V1–V3, ms | 120 (110–140) | 120 (110–130) | 150 (130–160) | 0.01 |
Epsilon wave | 28 (31) | 20 (26) | 8 (62) | 0.01 | |
TWI in precordial and inferior leads | 5 (4–7) | 5 (4–7) | 5 (2–6) | 0.2 | |
Echocardiography | RVOT diameter, m | 40 (35–50) | 39 (34–45) | 52 (50–57) | <0.001 |
RVIT diameter, mm | 48 (43–57) | 47 (41–55) | 60 (57–66) | <0.001 | |
RVED area, cm2 (n = 90) | 33.6 (25.9–41.2) | 31.4 (25.3–38.4) | 44.3 (40.8–46.2) | <0.001 | |
RV FAC, % (n = 90) | 30 (25–37) | 32 (26–37) | 19 (14–26) | <0.001 | |
LVEF, % | 60 (45–65) | 60 (55–65) | 40 (27–45) | <0.001 | |
LV involvement (LVEF ≤50%) | 29 (32) | 17 (22) | 12 (92) | <0.001 | |
Severe LV damage (LVEF <35%) | 10 (11) | 5 (6) | 5 (38) | <0.001 | |
Moderate / severe TR | 26 (29) | 14 (18) | 12 (92) | <0.001 | |
RAA, cm2 (n = 90) | 22.5 (18–30) | 21.4 (17.7–26.7) | 38.0 (29.1–48.1) | <0.001 | |
LAA, cm2 (n = 90) | 20.8 (17–25.1) | 20.8 (17.1–24.3) | 25.2 (15.2–30) | 0.63 | |
Biomarkers | sST2, ng/ml | 20.0 (16.1–25.8) | 18.4 (15.4–24.2) | 31.9 (22.5–49) | <0.001 |
Gal‑3, ng/ml | 8.2 (7.0–9.9) | 8.2 (7.0–9.9) | 8.2 (7.3–9.9) | 0.66 | |
MMP‑2, ng/ml | 227.3 (191.4–260.7) | 220.4 (188.4–241.6) | 313.3 (258.0–416.9) | <0.001 | |
MMP‑9, ng/ml | 473.9 (322.7–773) | 483.1 (341.8–781.9) | 369.9 (257.5–594.4) | 0.22 | |
NT‑proBNP, pg/ml | 272.1 (90.1–914) | 224.8 (80.3–582.3) | 2521 (1290.0–3569) | <0.001 | |
hs‑TnT, ng/l | 8.7 (6–14) | 8.2 (5.9–12) | 21.8 (11.2–30) | <0.001 | |
Follow‑up duration, mo | 36.4 (29.8–41.2) | 37.2 (32.2–43.4) | 18.2 (10–24.3) | <0.001 | |
During the median (IQR) follow‑up of 36.4 (29.8–41.2) months, 13 patients (14%) reached the composite end point of death or HTx, with HTx being more common (10 patients). Among the 3 deaths, 2 were due to end‑stage HF, and there was 1 case of SCD in a patient with severe RV damage who had an ICD implanted. All HTxs were performed due to HF. At the same time, 27 participants (30%) experienced MAEs. Specific data about adverse outcomes during the follow‑up are shown in Table 2.
Outcome | All patients (n = 91) | |
Data are presented as number (percentage) of patients.
Abbreviations: HF, heart failure; HTx, heart transplantation; MAE, major arrhythmic event; others, see Table 1 | ||
Death | All‑cause | 3 (3) |
Death due to HF | 2 (2) | |
SCD | 1 (1) | |
HTx due to HF | 10 (11) | |
HF hospitalization | 12 (13) | |
MAE (SCD/VF/sVT/appropriate ICD intervention) | 27 (30) | |
Biomarkers in predicting adverse outcomes
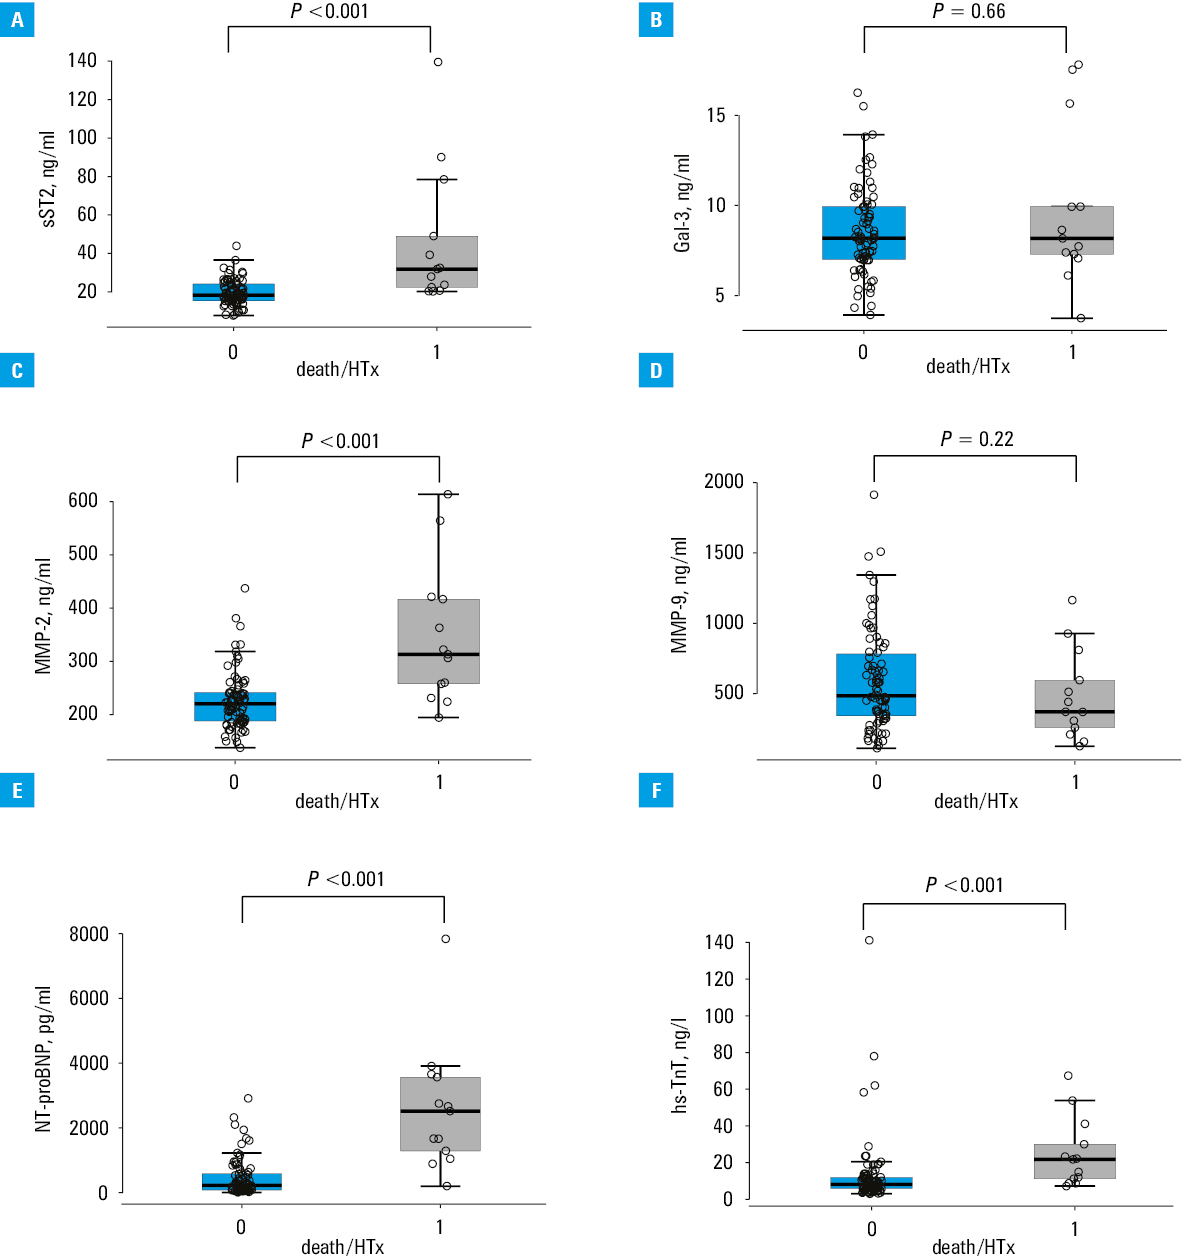
Among the studied biomarkers, significantly higher levels of sST2, MMP‑2, NT‑proBNP, and hs‑TnT were found in the patients who achieved the composite end point of death or HTx (P <0.001 for all cases; Table 1). No such relationship was observed for Gal‑3 or MMP‑9. The median concentrations of the studied biomarkers, along with their distribution in the patients with and without death or HTx during the follow‑up, are presented in Figure 1. None of the biomarkers predicted MAEs (Table 3).
Abbreviations: see Table 1
Biomarker | No MAEs (n = 64) | MAEs (n = 27) | P value |
Data are presented as median (interquartile range).
| |||
sST2, ng/ml | 18.6 (15.9–24.5) | 22.5 (16.9–26.6) | 0.27 |
Gal‑3, ng/ml | 8.3 (7.3–9.8) | 8.0 (6.1–11.2) | 0.71 |
MMP‑2, ng/ml | 224.1 (189–256.2) | 233.6 (192.6–285.7) | 0.48 |
MMP‑9, ng/ml | 474.7 (323.5–722.7) | 469.7 (338.1–833.2) | 0.78 |
NT‑proBNP, pg/ml | 264.3 (107.1–691.5) | 585.1 (83–1231) | 0.25 |
hs‑TnT, ng/l | 9.2 (6–12.9) | 8.5 (6.5–20.5) | 0.39 |
Prognostic factors for death or heart transplantation
A comparison of subpopulations that did or did not reach the primary end point is presented in Table 1. The patients who reached the end point of death or HTx more often had a history of atrial arrhythmia (AFl and AT, but not AF), symptoms of HF, wider QRS complexes, and presence of the epsilon wave on ECG. Moreover, they presented with more advanced RV impairment (regarding its dimensions and systolic function, as well as moderate / severe tricuspid regurgitation), lower left ventricular (LV) ejection fraction, and greater right (but not left) atrial enlargement. Finally, as mentioned before, significantly higher levels of sST2, MMP‑2, NT‑proBNP, and hs‑TnT were found in the patients who died or underwent HTx during the follow‑up.
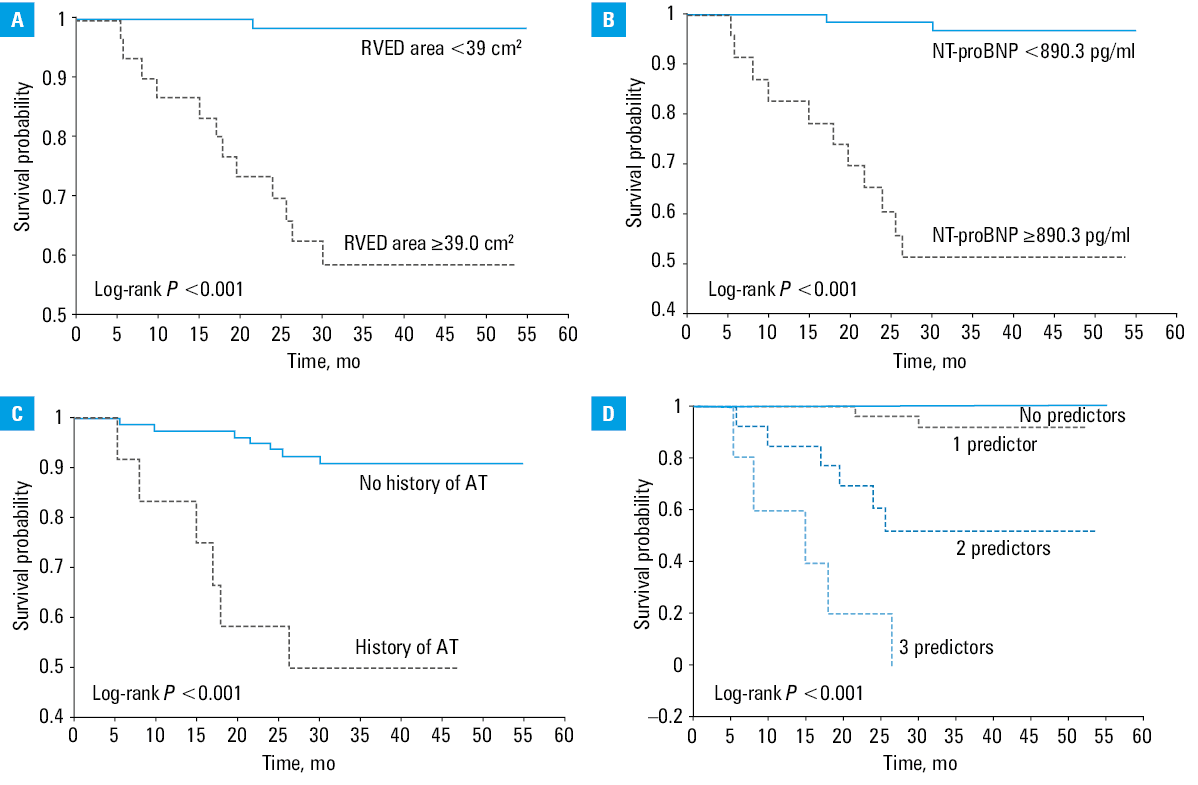
Univariable and multivariable analyses of clinical variables associated with the primary end point using the Cox proportional hazards regression were performed, and the results are shown in Table 4. Three factors turned out to be independent predictors of death or HTx, namely, higher NT‑proBNP concentration, greater RV end‑diastolic area, and a history of AT. Based on the ROC analysis, the following cutoff points were obtained: NT‑proBNP concentration greater than or equal to 890.3 pg/ml and RV end‑diastolic area greater than or equal to 39 cm2. The Kaplan–Meier analysis of survival free from death or HTx depending on the number of predictors is shown in Figure 2.
Predictor | Cox proportional hazards model | |||
Univariable analysis | Multivariable analysis | |||
HR (95% CI) | P value | HR (95% CI) | P value | |
Abbreviations: HR, hazard ratio; others, see Table 1 | ||||
Total TFC score | 1.56 (1.06–2.30) | 0.03 | – | – |
Medical history | ||||
Family history of ARVC | 3.00 (1.00–8.93) | 0.049 | – | – |
VF or unstable sVT | 3.76 (1.03–13.66) | 0.04 | – | – |
AFl | 8.79 (2.87–26.99) | <0.001 | – | – |
AT | 7.65 (2.56–22.88) | <0.001 | 7.52 (1.95–28.90) | 0.003 |
Permanent atrial arrhythmia | 13.86 (4.18–45.97) | <0.001 | – | – |
Symptoms | ||||
Symptoms of RV failure | 10.03 (3.26–30.83) | <0.001 | – | – |
NYHA class | 11.87 (3.95–35.67) | <0.001 | – | – |
Electrocardiography | ||||
Epsilon wave | 4.10 (1.33–12.69) | 0.01 | – | – |
QRS duration in V1–V3 | 1.02 (1.01–1.03) | 0.004 | – | – |
Echocardiography | ||||
RVOT diameter | 1.12 (1.07–1.18) | <0.001 | – | – |
RVIT diameter | 1.15 (1.08–1.24) | <0.001 | – | – |
RVED area | 1.11 (1.06–1.17) | <0.001 | 1.12 (1.02–1.22) | 0.01 |
RV FAC | 0.83 (0.77–0.90) | <0.001 | – | – |
LVEF | 0.91 (0.88–0.95) | <0.001 | – | – |
LV involvement (LVEF ≤50%) | 30.80 (4.00–236.95) | <0.001 | – | – |
Severe LV damage (LVEF <35%) | 7.31 (2.38–22.45) | <0.001 | – | – |
Moderate / severe TR | 39.02 (5.07–300.42) | <0.001 | – | – |
RAA | 1.10 (1.06–1.14) | <0.001 | – | – |
Biomarkers | ||||
sST2 (ln) | 31.61 (8.32–120.16) | <0.001 | – | – |
MMP‑2 (ln) | 89.01 (14.58–543.41) | <0.001 | – | – |
NT‑proBNP (ln) | 6.07 (2.69–13.72) | <0.001 | 5.13 (2.06–12.8) | <0.001 |
hs‑TnT (ln) | 2.40 (1.42–4.04) | 0.001 | – | – |
Abbreviations: see Table 1
Discussion
The incidence of end‑stage HF leading to death or HTx in ARVC is estimated at 2% to 22%.12 In the study population, the primary end point was reached by 14% of the patients. Many previous studies8,13-16 analyzed the risk factors for poor prognosis in ARVC, but in the vast majority of them, the composite end point was defined as death from cardiological causes, with arrhythmia‑related SCD being the most common. In these studies, the prognostic factors included, for example, a history of sustained ventricular arrhythmia, RV dysfunction, LV involvement, or symptoms of RV failure. However, little is known about the factors associated with developing HF in ARVC, including end‑stage HF.
According to the published research, younger age at diagnosis of ARVC (<35 years) is a risk factor for death and HTx.17,18 In our study, the patients who reached the primary end point were younger at the time of the diagnosis, but the difference was not significant. Of note, the median age at diagnosis in the subgroup that developed end‑stage HF was below 35 years, which is consistent with the results of a Nordic registry.17 There is no strong evidence in the literature of a relationship between a positive family history of ARVC or proband status and the risk of developing HF,14,17,19 which is confirmed by our results. However, genotype is known to influence prognosis, and certain mutations (DSG‑2, DSP, PLN) are associated with a higher risk of HF and LV involvement.20-22 Moreover, the presence of more than 1 pathogenic variant is a risk factor for HTx due to HF.20,21 Unfortunately, in our study, genetic testing was not performed in all patients.
Arrhythmia is a common manifestation of ARVC. An association between ventricular arrhythmia and HF has not been reported.12 In this study, a history of VF or unstable sVT was more frequent in the patients who reached the end point, with borderline statistical significance. On the other hand, atrial arrhythmias turned out to be a strong predictor of death or HTx. In the study population, atrial arrhythmias were present in 36% of all patients and 77% of those who achieved the primary end point. AF was the most common, but only AFl or AT predicted the end point. Among the considered types of atrial arrhythmia, only AT was an independent risk factor for death or HTx. Previous research showed that atrial arrhythmia is more common in ARVC patients with end‑stage HF and is a risk factor for death and HTx.23,24 However, in these studies, atrial arrhythmia was not categorized into different types. The occurrence of AT (most often right‑sided AT) may result from right atrial impairment, secondary to RV dilatation and systolic dysfunction, and is associated with more advanced stages of ARVC.
According to current knowledge, changes on ECG also have a prognostic value in ARVC. First‑degree atrioventricular block, low voltage of the QRS complexes, inversion of T waves in leads V4–V6, and the presence of epsilon wave were previously associated with HF progression.12,21,25 We found a higher incidence of epsilon wave and a longer QRS duration in leads V1–V3 in the patients who reached the primary end point.
In our study, we proved a very strong relationship between RV dilatation, right and LV systolic dysfunction, tricuspid regurgitation as well as right (but not left) atrial enlargement, and the occurrence of death or HTx during the follow‑up. Similar observations have already been published,17,25 but these studies did not assess atrial size.
To date, only a single study evaluated the role of biomarkers in predicting end‑stage HF in ARVC. Akdis et al26 in 2022 showed that sST2 and growth differentiation factor‑15 (GDF‑15), but not Gal‑3, predicted the composite end point of HTx or death from HF, and the combination of these biomarkers with NT‑proBNP yielded an even better outcome prediction. Our results are generally consistent with those reported by Akdis et al26. We showed that higher concentrations of sST2, MMP‑2, NT‑proBNP, and hs‑TnT, but not of Gal‑3 and MMP‑9, predicted the primary end point. Among these biomarkers, only NT‑proBNP (cutoff value ≥890.3 pg/ml; reference range <125 pg/ml for adults younger than 75 years old and <450 pg/ml for adults aged 75 years or older) was an independent predictor of death or HTx. In addition to NT‑proBNP, also RV end‑diastolic area (cutoff value ≥39 cm2) and the history of AT were identified in the multivariable model predicting death or HTx. Until recently, no specific models determining the predictors of adverse HF outcomes in ARVC were available. The first such model assessing the risk of end‑stage HF was published by Chen et al27 in 2022. It incorporated 4 clinical parameters: LV ejection fraction, serum creatinine levels, moderate‑to‑severe tricuspid regurgitation, and AF. However, no biomarkers except for NT‑proBNP were analyzed in that study, and no types of atrial arrhythmia other than AF were assessed. Undoubtedly, development of such models and their validation in large cohorts of ARVC patients are needed from the clinical point of view, since they can assist clinicians in evaluating the risk of end‑stage HF and identifying the optimal time to place the patient on the HTx waiting list. In addition, it has been shown that elevated levels of biomarkers, including NT‑proBNP but also high‑sensitivity C‑reactive protein and procalcitonin, could indicate increased risk of death during 1‑year follow‑up in ambulatory patients with advanced HF awaiting HTx.28
Regarding the prediction of ventricular arrhythmias, we did not observe any relationship between biomarker levels and the occurrence of MAEs during the follow‑up. A similar observation for sST2 and Gal‑3 was made by Akdis et al.26 Previously, in small groups of ARVC patients, an association was found between ventricular arrhythmia during the follow‑up and the concentration of Gal‑329 as well as of NT‑proBNP and hs‑TnT.30
Study limitations
This was a single‑center study performed in a limited number of ARVC patients recruited at an ARVS referral center in Poland. For this reason, there could be a selection bias and the study population consisted of patients with more advanced disease (eg, the rate of atrial arrhythmias was very high: 36%, as compared with 18% reported in a meta‑analysis).31 However, the results are still valuable and apply to the ARVC patients with a more severe manifestation of the disease, in whom the risk of HF progression should be assessed and referral for HTx should be considered. Certainly, the obtained results require validation in a larger cohort. Unfortunately, genotype was not included as a risk factor due to the restricted number of genetic tests in the study population. Magnetic resonance imaging results were also not considered, as nearly half of the patients did not have a valid imaging scan due to an ICD. Moreover, some patients had symptoms of HF at the time of enrollment into the study. Models assessing the long‑term risk of developing end‑stage HF in asymptomatic patients would be needed.
Conclusions
HF is a significant clinical problem in ARVC. Assessment of the risk for developing end‑stage HF and choosing the optimal time for HTx remain challenging. We showed that certain biomarkers (sST2, MMP‑2, NT‑proBNP, and hs‑TnT, but not Gal‑3 and MMP‑9) were prognostic factors for death or HTx in ARVC, while none of the analyzed biomarkers predicted ventricular arrhythmia. Moreover, we proposed a prognostic model for end‑stage HF including 3 independent predictors: an NT‑proBNP concentration greater than or equal to 890.3 pg/ml, RV end‑diastolic area greater than or equal to 39 cm2, and a history of AT. Such a model may be helpful for clinicians in day‑to‑day management of patients with ARVC.
- Basso C, Corrado D, Marcus FI, et al. Arrhythmogenic right ventricular cardiomyopathy. Lancet. 2009; 373: 1289‑1300. | Crossref
- Corrado D, Link M, Calkins H. Arrhythmogenic right ventricular cardiomyopathy. N Engl J Med. 2017; 376: 61‑72. | Crossref
- Corrado D, Perazzolo Marra M, Zorzi A, et al. Diagnosis of arrhythmogenic cardiomyopathy: the Padua criteria. Int J Cardiol. 2020; 319: 106‑114. | Crossref
- Hoorntje ET, Te Rijdt WP, James CA, et al. Arrhythmogenic cardiomyopathy: pathology, genetics, and concepts in pathogenesis. Cardiovasc Res. 2017; 113: 1521‑1531. | Crossref
- Basso C, Thiene G, Corrado D, et al. Arrhythmogenic right ventricular cardiomyopathy: dysplasia, dystrophy or myocarditis? Circulation. 1996; 94: 983‑991. | Crossref
ARTICLE INFORMATION