Air pollution and long-term risk of hospital admission due to chronic obstructive pulmonary disease exacerbations in Poland: a time-stratified, case-crossover study
Key words: air pollution, chronic obstructive pulmonary disease, NO2, PM10, SO2


 CC BY-NC-SA 4.0
Air pollution and long-term risk of hospital admission due to chronic obstructive pulmonary disease exacerbations in Poland: a time-stratified, case-crossover study
Introduction: Airborne pollutants may worsen the course of chronic obstructive pulmonary disease (COPD). Previous studies have shown that both particulate and gaseous pollutants increase airway inflammation, which may lead to an exacerbation of COPD.
Objectives: The aim of the study was to investigate the association between exposure to airborne pollutants and the risk of COPD exacerbations in 3 the largest urban agglomerations in Poland: Warsaw, Kraków, and Tricity.
Patients and methods: We used a case‑crossover approach to analyze data from the years 2011–2018. This time‑series study used distributed lag linear‑nonlinear models to analyze the risk of hospital admission due to COPD exacerbations during 21 days following the exposure to particulate matter (PM), NO2, and SO2.
Results: Overall, there were 26 948 admissions due to COPD exacerbations. During 21 days after exposure, the rate ratio (95% CI) for admissions per 10 µg/m3 was 1.028 (1.008–1.049) for PM10, 1.030 (1.006–1.055) for PM2.5, 1.032 (0.988–1.078) for NO2, and 1.145 (1.038–1.262) for SO2. The risk for admission peaked at 10 days after the exposure to PM10 and PM2.5, whereas for NO2 and SO2 the risk was the greatest on the day of exposure. The proportion (95% CI) of hospitalizations attributable to air pollution was 9.08% (3.10%–15.08%) for PM10, 7.61% (1.27%–13.49%) for PM2.5, 9.77% (–3.63% to 21.48%) for NO2, and 7.70% (2.30%–12.84%) for SO2.
Conclusions: PM2.5, PM10, NO2, and SO2 pollution was associated with an increased risk of COPD exacerbations that needed hospitalization. There were different risk patterns for particulate and gaseous pollutants. Improving air quality in Polish cities could reduce the burden of COPD.
What's new?
Growing evidence from studies across the world has attributed a substantial disease burden to air pollution. Gaseous and particulate air pollution in Poland is an important public health problem, but the disease burden related to air pollution is largely unknown. In Poland, there is a lack of long‑term, multicity studies linking air pollution with objective health care measures. People with chronic lung diseases, such as chronic obstructive pulmonary disease (COPD), are most susceptible to ambient air pollution. In this study, we analyzed data from Warsaw, Kraków, and Tricity for the years 2011–2018 to see how changes in the concentration of various air pollutants were associated with changes in the number of hospitalizations due to COPD exacerbations. We found that exposure to both particulate and gaseous pollutants significantly increased the hospitalization risk, with a substantial proportion of hospitalizations attributable to air pollution.
Introduction
Chronic obstructive pulmonary disease (COPD), a common airway disease typically developing in adult life, is the third most common chronic disease to cause death worldwide, accounting for more than 3 million deaths annually.1 COPD causes persistent respiratory symptoms, but it is also characterized by periodic exacerbations manifesting as increased dyspnea, cough, and sputum production.2 In addition to reducing patients’ well‑being, the exacerbations of COPD accelerate the deterioration of lung function and increase the risks of hospitalization and death.3,4
COPD is caused by an interplay between genetic and environmental factors, with airborne pollutants, gases, and particles alike being the most important of the latter.5 Accumulating evidence links ambient air pollution to an increased prevalence of COPD and a more severe disease course.6-10 In the last 30 years, the number of COPD deaths worldwide attributable to air pollution with particulate matter (PM) has nearly doubled.11 COPD exacerbations are also more likely when air quality is poor. In 1997, the seminal APHEA (Air Pollution and Health: a European Approach) study found that an increased risk of hospital admission due to COPD exacerbations was associated with increased concentrations of black smoke, NO2, and SO2.12 More recent meta‑analyses of over 60 studies reported that all major particulate and gaseous air pollutants were associated with an increased risk of COPD exacerbation.13,14
Ambient air pollution is an important public health problem across cities in Poland due to substantial emissions of PM, NO2, and SO2 from industry, traffic, and households.15 However, the burden of diseases attributable to ambient air pollution in Poland is poorly documented.16 To our knowledge, only 1 regional study to date has assessed the relationship between ambient air pollution and the risk of COPD exacerbations,17 but multicity studies analyzing the risk in relation to both pollutant concentrations and time since exposure are lacking. Cross‑sectional studies on respiratory diseases conducted in Polish cities have so far included diseases such as asthma18 and pneumonia.19 Therefore, we used a time‑stratified, case‑crossover design and distributed lag linear‑nonlinear models (DLNMs) to analyze the relationship between ambient air pollution and the risk of hospital admission due to COPD exacerbations in the 3 largest urban agglomerations in Poland.
Patients and methods
Settings
We analyzed the association between ambient air pollution and the risk of hospital admission due to a COPD exacerbation between January 1, 2011 and December 31, 2018 in the 3 largest urban agglomerations in Poland: Tricity (population of 750 000, northern Poland, the Baltic coast), Warsaw (population of 1 800 000, central Poland), and Kraków (population of 770 000, southern Poland). We used publicly available data and thus did not have to obtain ethical approval.
Definition and measurements
Admission due to a COPD exacerbation was defined as a hospitalization billed with the J44 codes of the International Classification of Diseases, Tenth Edition, as the main reason for admission. The numbers of daily admissions were gathered from the National Health Fund, which finances the public health care system in Poland. The daily counts of admissions did not include emergency room visits. The mean daily concentrations of PM10, PM2.5, NO2, and SO2 and the mean daily values of relative humidity, precipitation, and ambient air pressure were taken from the measuring stations of the Chief Inspectorate of Environmental Protection (https://powietrze.gios.gov.pl/pjp/maps/measuringstation). For each city, we averaged the values from all available stations.
Statistical analysis
We used a time‑stratified case‑crossover analysis to compare exposure on the case days with exposure on the control days, that is, all the remaining same days of the week in the same month and year within each city. The differences in exposure were then related to the difference in admission counts using a conditional quasi‑Poisson regression.20 We used a stratum variable of “city‑year‑month‑day‑of‑the‑week” to control the long‑term trends and seasonality, and to pool data from the 3 cities.21,22 The logarithm of the total population of each city was used as the offset variable. We used DLNMs to analyze the relationship between the concentrations of PM10, PM2.5, NO2, and SO2 and the risk of admission over 11, 21, and 31 days from the exposure.23 Visual inspection of the risk curves showed that the interval of 21 days provided the best fit for our data (Supplementary material, Figure S1). We fitted single‑pollutant models with a linear relationship between the concentration of a pollutant and the risk of admission, whereas the lag was modelled with a polynomial function and 5 degrees of freedom (df). The models were adjusted for temperature, relative humidity, and atmospheric pressure, with natural cubic splines (df = 3), and a lag of up to 1 day. The results were presented as rate ratios (RRs) per 10 µg/m3 for each day after the exposure, including cumulative effects. Moreover, we calculated the RRs for the overall effects and the percentages of hospitalizations attributable to individual air pollutants within the 21‑day period.24 The “gnm” package was used to fit the conditional quasi‑Poisson models. The “FluMoDL” package was used to calculate the percentage of hospitalizations attributable to air pollution. The results were considered significant when 95% CIs did not span the value of no effect (1.0 for RR; 0 for percentage of attributable admissions). The Spearman correlation coefficients were used to analyze the associations between the concentrations of individual air pollutants. All calculations were completed using R software version 4.1.3 (The R Foundation for Statistical Computing, Vienna, Austria).
Results
Air pollution and admissions
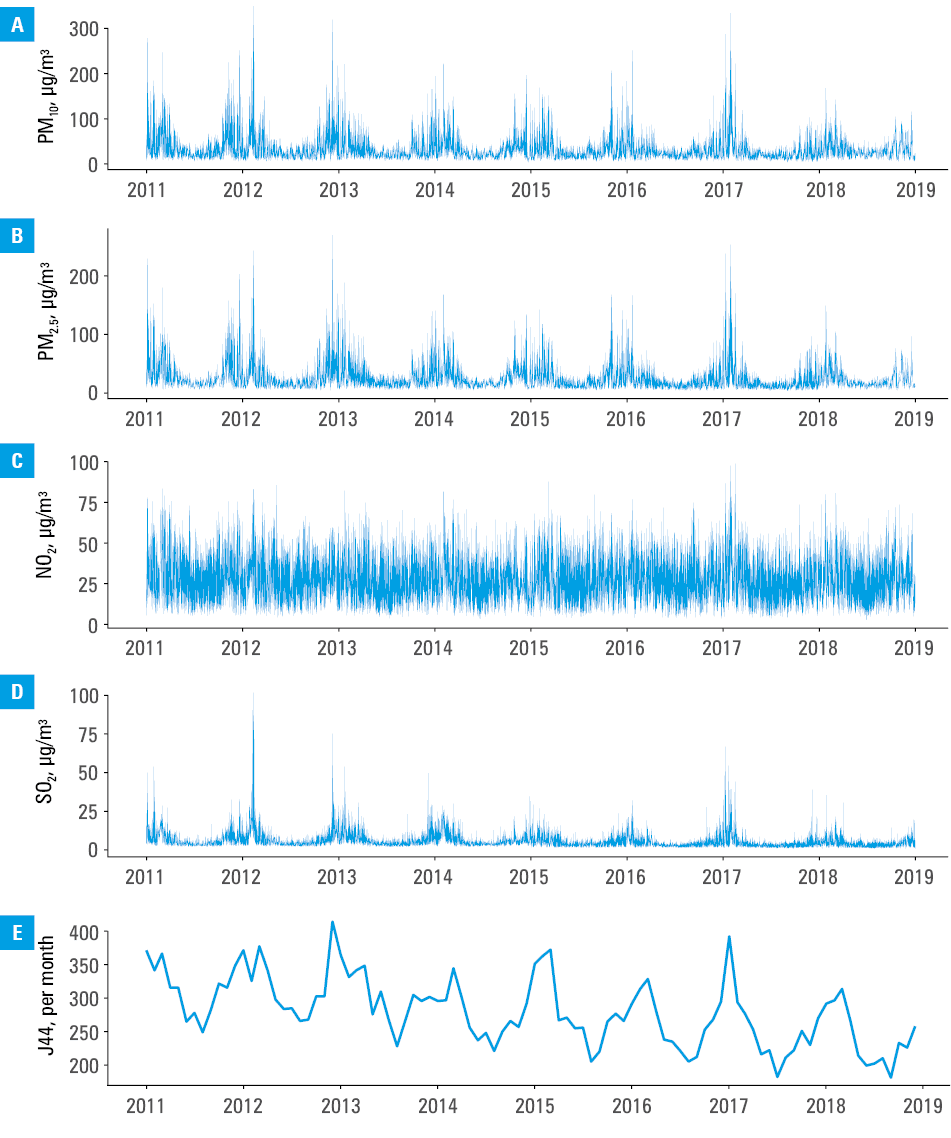
The daily concentrations of PM10, NO2, and SO2 for the entire study period are shown in Figure 1; the greatest concentrations of all pollutants were observed in the winter. The median concentrations of PM10, NO2, and SO2 were the highest in Kraków and the lowest in Tricity (Table 1). There were moderate correlations between the daily concentrations of air pollutants, except for the correlation between PM10 and PM2.5, which was strong (Table 2).
Abbreviations: PM, particulate matter
Parameter | Warsaw | Kraków | Tricity |
Data are presented as medians (interquartile ranges) or counts.
Abbreviations: see Figure 1 | |||
PM10, μg/m3 | 28.3 (20.7–40.4) | 35.5 (24–58.8) | 15.3 (11–22.1) |
PM2.5, μg/m3 | 20.5 (14.4–31.9) | 25.0 (16.7–44.5) | 11.0 (7.5–16.9) |
NO2, μg/m3 | 33.8 (26.4–41.7) | 40.4 (33.4–48.4) | 13.6 (9.5–18.9) |
SO2, μg/m3 | 4.5 (2.8–7.0) | 5.5 (4.0–9.2) | 2.5 (1.7–3.8) |
Temperature, °C | 9.6 (3.1–17.1) | 9.9 (3.1–16.8) | 9.3 (3.9–16) |
Relative humidity, % | 76.7 (65.4–86.8) | 77.8 (68.1–85.9) | 74.2 (67–80.1) |
Atmospheric pressure, hPa | 1003 (998–1008) | 988 (984–992) | 1007 (1002–1012) |
J44 admissions, n | 16 588 | 5269 | 5091 |
PM2.5 | NO2 | SO2 | |
P <0.001 for all coefficients
Abbreviations: see Figure 1 | |||
PM10 | 0.91 | 0.74 | 0.64 |
PM2.5 | – | 0.68 | 0.71 |
NO2 | – | – | 0.56 |
In total, there were 26 948 admissions billed with the J44 codes. Figure 1D shows the monthly counts of admissions, with a peak in mid‑winter.
Lagged association of exposure to PM10, NO2, and SO2 with admission risk
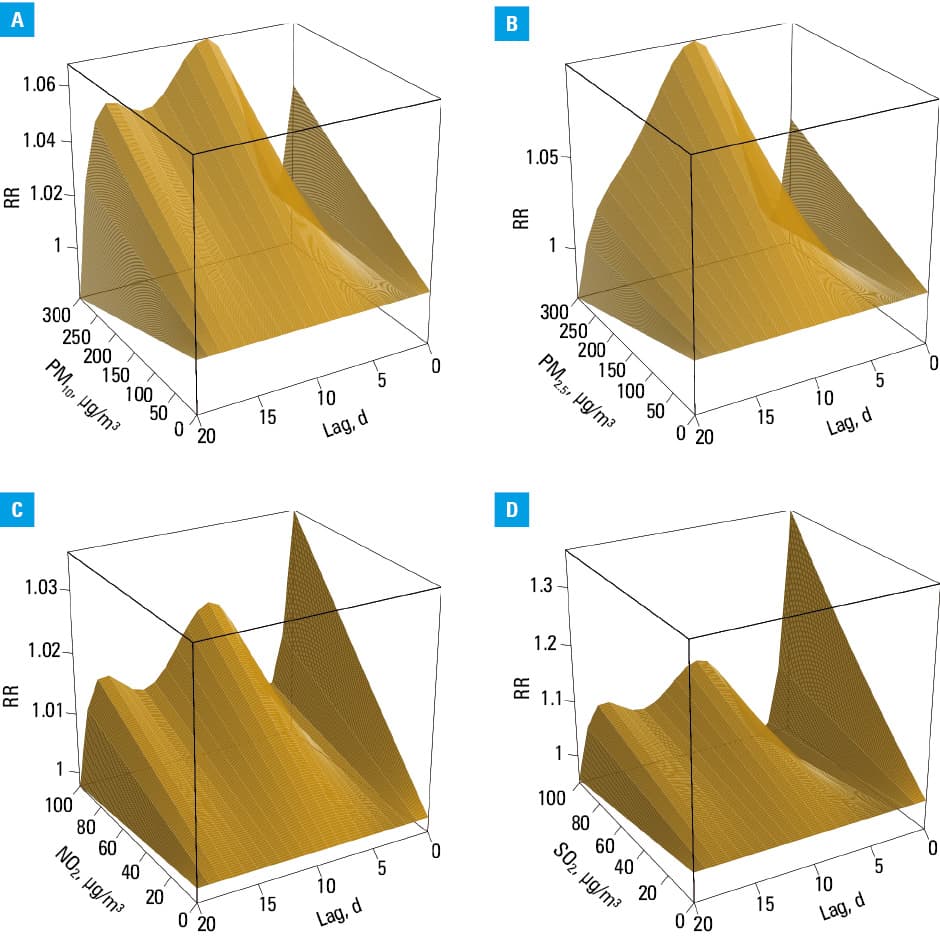
After exposure to PM10, the admission risk increased insignificantly on the day of exposure, peaked at 10 days, and returned to baseline by day 20 (Supplementary material, Figure S1A). The cumulative RR per 10 µg/m3 of PM10 over 21 days was 1.028 (95% CI, 1.008–1.049; Supplementary material, Figure S1E and S1I), and 9.08% (95% CI, 3.10%–15.08%) of admissions were attributable to PM10. The pattern was similar for PM2.5, as RR per 10 µg/m3 was 1.030 (95% CI, 1.006–1.055; Supplementary material, Figure S1B, S1F, and S1J), and 7.61% (95% CI, 1.27%–13.49%) of the admissions were attributable to PM2.5 exposure.
After exposure to NO2, the risk of admission was the greatest on the day of exposure, with a smaller increase around day 10: RR per 10 µg/m3 was 1.032 (95% CI, 0.988–1.078; Supplementary material, Figure S1C, S1G, and S1K), and 9.77% (95% CI, –3.63% to 21.48%) of the admissions were attributable to NO2 exposure. The pattern for SO2 was similar, but the risk was markedly elevated on the day of exposure: RR per 10 µg/m3 was 1.145 (95% CI, 1.038–1.262; Supplementary material, Figure S1D, S1H, and S1L), and 7.70% (95% CI, 2.30%–12.84%) of the admissions were attributable to SO2 exposure. Figure 2 shows the admission risk due to COPD exacerbations across the range of exposures and lags for all pollutants.
Abbreviations: RR, rate ratio; others, see Figure 1
Discussion
To our knowledge, this is the first multicity study carried out in Poland to analyze how air pollution may increase the risk of COPD exacerbations. We analyzed data gathered over 9 years in the 3 largest urban agglomerations. This study provides evidence that air pollution may increase the number of hospital admissions due to COPD exacerbation in Poland. A visual inspection of the descriptive data showed clearly that the number of admissions was the greatest in mid‑winter, when the concentrations of all pollutants were the highest (Figure 1). Single‑pollutant analyses adjusted for meteorological factors revealed that the exposure to PM10, PM2.5, and SO2 was associated with a significantly increased risk of admission due to a COPD exacerbation within 21 days. Although the risk of admission also increased with greater NO2 concentration, this relationship was not significant. The temporal pattern of the relationship between the exposure to ambient air pollution and admission risk was different for particulate and gaseous pollutants. For NO2 and SO2 the greatest risk was observed on the day of exposure, whereas for PM10 and PM2.5 the risk peaked at around 10 days. We estimated that between 8% and 10% of the COPD admissions could be attributed to ambient air pollution.
Our results are consistent with previous evidence. In a study from a city of Kermanshah, Iran, COPD admissions increased 1 day after exposure to PM10, NO2, and SO2.25 Lin et al26 reported that acute COPD exacerbations were more likely over 7 days since exposure to PM10, NO2, and SO2 in Taiwan. In a study from Shijiazhuang, China,27 the risk of hospital admission due to an exacerbation of COPD was increased over 7 days since the exposure to PM2.5 (RR per 10 μg/m3, 1.011; 95% CI, 1.003–1.018), to PM10 (RR, 1.004; 95% CI, 0.999–1.01), to SO2 (RR, 1.003; 95% CI, 0.984–1.021), and to NO2 (RR, 1.016; 95% CI, 0.993–1.04); these associations were stronger among the elderly. Moreover, 13% of COPD admissions were attributable to PM2.5, 9.4% to PM10, 1.7% to SO2, and 9.7% to NO2.28 In a study from Hong Kong,28 all investigated pollutants increased the admission risk due to COPD exacerbation to a similar degree over 5 days (RR per 10 μg/m3: PM10, 1.031; PM2.5, 1.024; SO2, 1.007; NO2, 1.026). An analysis of nearly 100 000 admissions due to COPD in southwestern China showed that the admission risk significantly increased on days 0–3 after the exposure to PM2.5, PM10, SO2, and NO2, with a similar temporal pattern for particulate and gaseous pollutants: the risk was the greatest on the day of exposure, then it returned to baseline by day 3, and remained at the baseline up to day 7.29 In a study from Ahvaz, Iran, the risk of admission due to COPD significantly increased on day 2 since the exposure to PM2.5 (RR per 10 μg/m3, 1.003 [1.001–1.005]), whereas the effect up to day 7 was insignificant.30 Similar findings were reported in a study from a different Iranian city.31 Another study on over 600 000 admissions due to COPD in Istanbul reported that the risk of admission due to COPD was elevated up to day 9 since the exposure to PM2.5 and NO2, and up to day 7 since the exposure to PM10. The risk was the greatest on the day of exposure, after which it gradually declined in a similar pattern for PM and NO2.32 A nationwide study from South Korea found that the risk of admission due to a COPD exacerbation increased significantly after the exposure to PM10, with the greatest value around day 5. The risk was insignificantly higher after the exposure to NO2 on the day of exposure only, whereas the exposure to SO2 was not associated with an elevated risk of admission in the analyzed period of 10 days following the exposure.33 Similarly, we observed a delayed increase in the risk of COPD admissions for particulate pollutants, and an immediately increased risk for gaseous pollutants. In a study from Hefei, China,34 which assessed the risk of admission due to a COPD exacerbation over 20 days since the exposure to PM2.5 and PM10, the risk increased gradually up to day 10. However, that work did not analyze the consequences of the exposure to gaseous pollutants. In a study from Guangzhou, China,35 the risk of hospitalization due to a COPD exacerbation was the greatest immediately after and then around 15 days following the exposure to NO2. In another study from Guangzhou,26 which gathered data from 110 hospitals, the risk of hospitalization due to COPD was associated with the exposure to PM10, but only the short‑term risk was assessed (RR of 1.015 over 6 days). These observations were confirmed in other studies from China (Shenyang, Beijing, Jinhua).36-38 In contrast, a study from Spain found that the risk of COPD exacerbation was unchanged or decreased after the exposure to PM10 and SO2, whereas it increased after the exposure to NO2.39
In our study, the lag pattern between the exposure and the risk of hospital admission due to COPD was different for particulate and gaseous pollutants: gaseous pollutants increased the risk immediately after the exposure, whereas particulate pollutants increased it gradually up to day 10. Gaseous pollutants, such as NO2 and SO2, might directly cause bronchoconstriction resulting in a COPD exacerbation.40,41 The effects of PM on the airways may take longer to develop; they might include increased production of mucus in the airways, downregulation of expression of antimicrobial peptides leading to infectious exacerbations, and development of a proinflammatory environment induced by alveolar macrophages that clear PM.42 A previous study reported that particulate but not gaseous pollution increased the risk of death in patients with COPD.43 However, other investigators found both PM10 and NO2 to increase the risk of death in these patients.44
The evidence linking COPD exacerbations with ambient air pollution calls for measures to counter this effect. An ongoing study is assessing how behavioral interventions, such as checking air quality forecasts, staying inside on days with the most severe pollution, and using air purifiers, might protect patients with COPD from exposure to air pollutants and its consequences, including exacerbations.45 Lowering ambient air pollution has also been associated with reduced COPD admissions. A 3‑year‑long action plan in China, which resulted in slightly reduced concentrations of PM2.5, PM10, and NO2, was associated with a reduced number of COPD hospitalizations among the elderly.46 It is vital to achieve very low concentrations of ambient air pollutants, because even low concentrations are harmful: the ELAPSE study47 carried out among nearly 27 million participants in Europe found that NO2 concentrations below 20 μg/m3 and PM10 concentrations below 10 μg/m3 were still associated with increased cardiovascular and respiratory mortality.
Our study has some limitations. We could not analyze individual exposure data taken from a few measuring stations in each city. Similarly, we had access to aggregated data on admissions only. Therefore, analyses in subgroups of patients (eg, men vs women, age subgroups) could not be performed. Moreover, the aggregated data on COPD admissions likely contain repeated admissions from the same participants, but we were unable to estimate the proportion of such repeated data. Additionally, we were not able to differentiate between planned and urgent admissions; however, planned admissions are not expected to be associated with changes in air pollution. Air pollution can cause COPD exacerbations by inducing airway infections or through other mechanisms. Future studies should analyze separately the association of air pollution with infectious and noninfectious exacerbations of COPD, which was not possible in our study due to the lack of data. The data spanning over a 9‑year‑long period for the 3 largest urban agglomerations in Poland, including nearly 10% of the country’s population, are a major strength of this study. The data on the proportion of admissions attributable to air pollution will help estimate the costs of air pollution and motivate actions to improve air quality in Poland. Although previous studies found similar associations between air pollution and COPD exacerbations, we believe that repeating such studies in different countries and across longer periods of time is necessary, as the chemical structure of air pollutants differs geographically and may change over time.
In conclusion, gaseous and particulate pollutants increased the risk of a hospital admission due to COPD exacerbations in the 3 largest agglomerations in Poland. The risk increased immediately after exposure to the gaseous pollutants and peaked at 10 days after the exposure to the particulate pollutants. Our results add evidence documenting the relationship between air pollution and disease burden in Poland.
- Vos T, Abajobir AA, Abate KH, et al. Global, regional, and national incidence, prevalence, and years lived with disability for 328 diseases and injuries for 195 countries, 1990‑2016: a systematic analysis for the Global Burden of Disease Study 2016. Lancet. 2017; 390: 1211‑1259.
- Kim V, Aaron SD. What is a COPD exacerbation? Current definitions, pitfalls, challenges and opportunities for improvement. Eur Respir J. 2018; 52: 1801261. | Crossref
- Donaldson GC. Relationship between exacerbation frequency and lung function decline in chronic obstructive pulmonary disease. Thorax. 2002; 57: 847852. | Crossref
- Donaldson GC. COPD exacerbations. 1: Epidemiology. Thorax. 2006; 61: 164‑168. | Crossref
- Rabe KF, Watz H. Chronic obstructive pulmonary disease. Lancet. 2017; 389: 1931‑1940. | Crossref
SUPPLEMENTARY MATERIAL
ARTICLE INFORMATION