Temporal changes of hemostatic activity in patients hospitalized for COVID-19: a prospective observational study
Key words: coagulation, COVID-19, endothelium, fibrinolysis, respiratory failure


 CC BY-NC-SA 4.0
Temporal changes of hemostatic activity in patients hospitalized for COVID-19: a prospective observational study
Introduction: Hemostatic abnormalities play an important role in the pathogenesis of COVID‑19 and are considered determinants of the patients’ outcomes. Less is known about the dynamics of these abnormalities in a short‑term observation.
Objectives: The aim of the study was to evaluate hemostatic activity markers in patients hospitalized for COVID‑19 depending on the severity of respiratory failure.
Patients and methods: This was a prospective observational study enrolling adult patients hospitalized for COVID‑19 in a tertiary center in Poland, from January to May 2021. Blood samples were drawn upon admission and 28 days after the admission to measure the markers of coagulation, fibrinolysis, and endothelial dysfunction, and to evaluate whether there are significant differences between these 2 time points. All analyses were performed in the entire cohort and after stratification into 3 groups depending on the degree of respiratory support.
Results: We recruited 245 patients at the median age of 63 years (interquartile range, 52–69), among whom 158 (64.5%) were men. The analysis of hemostatic markers on admission revealed that hypercoagulability, hypofibrinolysis, and endothelial dysfunction are related to the degree of respiratory support. We found significant differences between the admission and 28‑day follow‑up in all markers except for plasminogen activity. Interestingly, the markers of endothelial dysfunction remained the highest in the advanced respiratory support group after 28 days, while differences in the other markers diminished.
Conclusions: Hemostatic abnormalities are significantly attenuated within a month after a hospital admission due to COVID‑19. The initially observed association between severity of the disease and hemostatic derangements persists only for the markers of endotheliopathy.
What's new?
This prospective observational study including 245 patients hospitalized for COVID‑19 demonstrates that the degree of hypercoagulability, hypofibrinolysis, and endothelial dysfunction is associated with the requirement for more advanced respiratory support. These abnormalities are significantly attenuated within 28 days since the admission, but intergroup differences persist in the most severely ill patients. This may suggest that endotheliopathy plays a more important role in the pathogenesis of COVID‑19 than abnormalities of coagulation and fibrinolysis.
Introduction
The COVID‑19 pandemic was declared by the World Health Organization in 2020 and led to millions of hospitalizations and deaths worldwide.1 Over time, the growing body of evidence on the disease mechanisms led to the development of effective treatments and vaccines.2-4 It is now well established that COVID‑19 pathophysiology is a complex interplay between inflammation, hemostatic disturbances, and immunological abnormalities.5 Clinically, the disease usually presents with respiratory symptoms, frequently leading to respiratory failure and requirement for oxygen therapy, mechanical ventilation, and even extracorporeal oxygenation.6,7
One of the characteristic features of COVID‑19 is a high prevalence of thromboembolic complications, which encouraged the international societies to recommend a routine use of thromboprophylaxis in the patients requiring hospitalization for SARS‑CoV‑2 infection.8,9 At the same time, basic studies revealed hypercoagulability, hypofibrinolysis, and evidence of endothelial dysfunction in COVID‑19 patients.10-13 The endothelial damage is believed to be a crucial contributor to respiratory failure in the course of COVID‑19. It is responsible for intrapulmonary hyperperfusion and impairment of hypoxic vasoconstriction, thus leading to alveolar damage, edema, hemorrhage, and intra‑alveolar fibrin deposition in a manner similar to non–COVID‑19 acute respiratory distress syndrome.5 The degree of these abnormalities seems to be related to the severity of the disease.14,15 Less is known about the temporal changes in hemostatic activity and their patterns in the patients with respiratory failure of a different degree.16-18
We conducted this prospective, observational study in the patients hospitalized for COVID‑19 to evaluate their hemostatic activity depending on the severity of respiratory failure. Additionally, we aimed to assess the direction and magnitude of changes in coagulation, fibrinolysis, and endothelial function during a short‑term observation among COVID‑19 survivors.
Patients and methods
Design and setting
This was a prospective, observational study including adult patients hospitalized for COVID‑19. The recruitment took place at the University Hospital in Kraków, Poland, from January to May 2021. This was a part of the CraCOV‑HHS (CRAcow in CoVid pandemics: Home, Hospital and Staff) project, which aimed to develop a model of multidisciplinary inpatient and outpatient care for individuals with SARS‑CoV‑2 infection. The study protocol was approved by the local bioethics committee (1072.6120.333.2020, December 7, 2020), and complied with the Declaration of Helsinki and its amendments. Detailed information about the design, the recruitment process, and different substudies can be found elsewhere.19
Patients
The general inclusion criteria were: 1) informed consent to participate in the study, 2) confirmed SARS‑CoV‑2 infection (positive reverse transcriptase–polymerase chain reaction or antigen test), and 3) age of at least 18 years. We excluded patients who were unable to give informed consent to participate in the study and / or were pregnant, and / or had a suspicion of a high‑risk pulmonary embolism (sudden cardiac arrest, hemodynamic instability). For each patient we collected detailed demographic and clinical data based on an interview and medical history. Moreover, data on the course of the hospitalization were gathered, including medications, routine laboratory results, and modality of respiratory support.
Study procedures
Laboratory tests
Samples of venous blood were drawn from every patient within 24 hours and 28 days after the hospital admission into 3.2% (0.109 mol/l) sodium citrate tubes (1 part of sodium citrate to 9 parts of venous blood), then centrifuged at 2000 × g for 10 minutes within 30 minutes after drawing, and stored in aliquots at –80 °C for further analysis. Additionally, we routinely measured inflammatory markers, that is, procalcytonin and interleukin 6 (Elica, Roche, Meylan, France).
Commercially available immunoenzymatic assays were used to determine plasma tissue plasminogen activator (t‑PA) and plasminogen activator inhibitor‑1 (PAI‑1) antigens (both Hyphen Biomed, Neuville, France), thrombin‑antithrombin (TAT) complexes (Enzygnost TAT micro, Siemens, Marburg, Germany), ADAMTS‑13 activity and plasmin‑antiplasmin (PAP) complexes (both Technoclone, Vienna, Austria). Activity of plasma α2‑antiplasmin (α2AP) and plasminogen were measured by chromogenic assays (Berichrom α2‑antiplasmin and Berichrom plasminogen; Siemens). Concentrations of D‑dimer and von Willebrand factor (vWF) were assessed using a turbidimetric method (Innovance D‑dimer and vWF:antigen [Ag]; Siemens). Factor VIII activity was measured using a coagulometric assay with FVIII deficient plasma (Siemens).
Anticardiolipin (aCL), anti-β2‑glycoprotein I (aβ2GP1), and antiphosphatidylserine‑prothrombin (aPS/PT) antibodies of immunoglobulin (Ig) G and IgM isotype were assessed using enzyme‑linked immunosorbent assays QUANTA Lite aCL, β2GPI and aPS/PT (Inova Diagnostics, Saint Louis, Missouri, United States) according to the International Society on Thrombosis and Haemostasis guidelines.20
Clot lysis time
Clot lysis time (CLT) was measured as previously described.21,22 Briefly, citrated plasma was mixed with 15 nM calcium chloride, human thrombin (Merck, Kenilworth, New York, United States) at a final concentration of 0.5 U/ml, 10 µM phospholipid vesicles, and 18 ng/ml of recombinant t‑PA (Boehringer Ingelheim, Ingelheim, Germany). The mixture was transferred to a microtiter plate and its turbidity was measured at 405 nm, at 37 °C. CLT was defined as the time from the midpoint of the clear‑to‑maximum‑turbid transition, which represents clot formation, to the midpoint of the maximum‑turbid‑to‑clear transition. Intra‑assay and interassay coefficients of variation were 6% to 8%. The assay was performed in 3 repetitions.
Subgroup analyses
The patients were stratified according to the severity of respiratory failure using the following criteria:
1 No supplemental oxygen group: patients who did not develop respiratory failure in the course of COVID‑19 and did not require oxygen therapy;
2 Conventional oxygen therapy group: patients who were diagnosed with respiratory failure and required only a conventional oxygen therapy;
3 Advanced respiratory support group: patients who developed a severe respiratory failure and required high‑flow nasal oxygen therapy and / or noninvasive ventilation and / or invasive mechanical ventilation.
Statistical analysis
Categorical variables were presented as counts with percentages and compared using the χ2 test or the Fisher exact test. Continuous variables were presented as medians with interquartile ranges (IQRs), and compared using the Kruskal–Wallis test. For the comparisons comprising 3 groups, we additionally performed post hoc analyses using the Dunn test. An analysis of paired variables was performed with the Wilcoxon test. We conducted subanalyses of temporal changes in the hemostatic activity stratified by the severity of respiratory failure. This was a complete‑case analysis. A P value below 0.05 was considered significant. Statistical analyses were performed with R Studio, packages ggplot2 and dplyr (The R Foundation for Statistical Computing, Vienna, Austria).
Results
Study population
The study cohort included 245 patients at the median age of 63 years (IQR, 52–69), among whom 158 (64.5%) were men. The most common comorbidities were hypertension (61.2%), diabetes mellitus (24.9%), and coronary heart disease (17.1%). The patients were divided into the following subgroups: advanced respiratory support group (n = 77), conventional oxygen therapy group (n = 127), and no supplemental oxygen group (n = 41). Detailed description of the entire cohort and comparison of the subgroups are presented in Table 1.
Overall (n = 245) | Advanced respiratory support (n = 77) | Conventional oxygen therapy (n = 127) | No supplemental oxygen (n = 41) | P valuea | |
a P value for the Kruskal–Wallis test of differences between the groups, post hoc tests were performed using the Dunn test (for qualitative variables); P value for the χ2 test of differences between the groups, post hoc analysis was performed using pairwise comparisons (for quantitative variables).
b Significant difference between all groups
c No significant differences between the groups
d Significant difference between no supplemental oxygen and conventional oxygen therapy group
e Significant difference between no supplemental oxygen and advanced respiratory support group
f Significant difference between conventional oxygen therapy and advanced respiratory support group
Abbreviations: CRP, C‑reactive protein; IQR, interquartile range; LMWH, low‑molecular‑weight heparin; VTE, venous thromboembolism | |||||
Baseline demographic and clinical characteristics | |||||
Men, n (%) | 158 (64.5) | 55 (71.4) | 83 (65.4) | 20 (48.8) | 0.048e |
Age, y, median (IQR) | 63 (52–69) | 63 (53–68) | 63 (51.5–69.5) | 61 (55–69) | 0.99c |
Coronary heart disease, n (%) | 42 (17.1) | 10 (13) | 26 (20.5) | 6 (14.6) | 0.35e |
History of myocardial infarction, n (%) | 25 (10.2) | 8 (10.4) | 13 (10.2) | 4 (9.8) | 0.99c |
Chronic heart failure, n (%) | 21 (8.6) | 6 (7.8) | 12 (9.4) | 3 (7.3) | 0.88c |
Atrial fibrillation, n (%) | 26 (10.6) | 8 (10.4) | 13 (10.2) | 5 (12.2) | 0.94c |
History of stroke, n (%) | 7 (2.9) | 3 (3.9) | 3 (2.4) | 1 (2.4) | 0.80c |
Hypertension, n (%) | 150 (61.2) | 47 (61) | 82 (64.6) | 21 (51.2) | 0.31c |
Diabetes mellitus, n (%) | 61 (24.9) | 24 (31.2) | 32 (25.2) | 5 (12.2) | 0.08c |
Peripheral artery disease, n (%) | 16 (6.5) | 8 (10.4) | 6 (4.7) | 2 (4.9) | 0.25c |
Chronic obstructive pulmonary disease, n (%) | 9 (3.7) | 2 (2.6) | 7 (5.5) | 0 (0) | 0.22c |
Asthma, n (%) | 25 (10.2) | 9 (11.7) | 13 (10.2) | 3 (7.3) | 0.76c |
History of VTE, n (%) | 13 (5.3) | 1 (1.3) | 11 (8.7) | 1 (2.4) | 0.05c |
Chronic kidney disease, n (%) | 17 (6.9) | 6 (7.8) | 10 (7.9) | 1 (2.4) | 0.46c |
Hypothyroidism, n (%) | 38 (15.5) | 11 (14.3) | 19 (15) | 8 (19.5) | 0.73c |
Autoimmune disease, n (%) | 10 (4.1) | 3 (3.9) | 5 (3.9) | 2 (4.9) | 0.96c |
Cancer, n (%) | 11 (4.5) | 5 (6.5) | 4 (3.1) | 2 (4.9) | 0.53c |
Laboratory results, median (IQR) | |||||
White blood cells, × 103/µl | 5.85 (4.4–8.3) | 7.84 (5.1–9.3) | 5.40 (4.3–7.5) | 4.98 (4.1–6.8) | 0.001e,f |
Platelets, × 103/µl | 197 (158–275) | 239.5 (164.3–305.3) | 187.5 (142.5–258.8) | 233 (167.5–267.5) | 0.07f |
CRP, mg/l | 79.2 (38.1–132.8) | 123.0 (78.4–165.5) | 71.9 (34.7–110.8) | 43.4 (11–77.2) | <0.001b |
Procalcitonin, ng/ml | 0.1 (0.06–0.19) | 0.16 (0.11–0.28) | 0.09 (0.06–0.16) | 0.07 (0.04–0.15) | <0.001f |
Interleukin 6, pg/ml | 34 (16.7–59.2) | 47.2 (22.5–83.8) | 34.5 (13.9–58.4) | 28.4 (12.2–44.8) | 0.018e,f |
Maximal LMWH dose | |||||
None, n (%) | 2 (0.8) | 0 (0) | 0 (0) | 2 (4.9) | – |
Prophylactic, n (%) | 86 (35.1) | 7 (9.1) | 52 (40.9) | 27 (65.9) | <0.001b |
Intermediate, n (%) | 73 (29.8) | 21 (27.3) | 47 (37) | 5 (12.2) | 0.008e,f |
Therapeutic, n (%) | 84 (34.3) | 49 (63.6) | 28 (22) | 7 (17.1) | <0.001e,f |
Hemostatic markers on admission and their association with severity of respiratory failure: admission and 28‑day follow‑up
On admission we observed that the levels of coagulation markers (fibrinogen and TAT) were the highest in the patients requiring advanced respiratory support. Additionally, we observed higher concentrations of fibrinolysis inhibitors (α2AP, PAI‑1:Ag), fibrinolysis activators (t‑PA:Ag), plasminogen, as well as longer CLT in the patients with more severe respiratory failure. Finally, we noted significantly higher levels of the markers of endothelial dysfunction in the patients requiring more advanced respiratory support (PAI‑1:Ag, vWF:Ag, and vWF:Ag/ADAMTS‑13 ratio).
A similar analysis performed 28 days after the admission to the hospital revealed intergroup differences only in the endothelial dysfunction markers (vWF:Ag and vWF:Ag/ADAMTS‑13 ratio).
Detailed results of both analyses, including post hoc tests are presented in Table 2.
Admission | |||||
Data are presented as median (interquartile range).
Superscripts a to f, see Table 1.
g Normal range (lower and upper quartiles) calculated based on the results obtained in 30 sex- and age‑matched healthy volunteers
h Normal range for vWF:Ag/ADAMTS‑13 ratio has not been determined
Abbreviations: aCL, anticardiolipin; aPS/PT, antiphosphatidylserine‑prothrombin; β2GP1, β-2 glicoprotein I; CLT, clot lysis time; Ig, immunoglobulin; PAI‑1, plasminogen activator inhibitor 1; PAP, plasmin‑antiplasmin complex; TAT, thrombin‑antithrombin complex; t‑PA, tissue plasmin activator; vWF:Ag, von Willenbrand factor:antigen | |||||
Parameter | Normal range | Advanced respiratory support (n = 77) | Conventional oxygen therapy (n = 127) | No supplemental oxygen
(n = 41) | P valuea |
Fibrinogen, g/l | 1.8–3.6 | 4.9 (4–5.6) | 4.3 (3.75–5.1) | 4 (3.5–4.6) | <0.001b |
Factor VIII, % | 50–150 | 148.7 (109.7–176) | 136.7 (106.95–172.45) | 139 (101.1–169.6) | 0.54c |
TAT, µg/l | 1.2–4.2 | 9.69 (7–20.84) | 7.09 (5.18–11.3) | 7.74 (5.27–14.77) | 0.001e,f |
CLT, min | 74–95g | 119 (104–144.5) | 110 (100–127) | 106 (96–135.25) | 0.007e,f |
D‑Dimer, ng/ml | 0–500 | 1044 (651–2233) | 844 (600–1442.5) | 845 (615–1559) | 0.10f |
α2‑Antiplasmin, % | 80–120 | 112.3 (104.7–116.3) | 108.9 (104.45–115.35) | 107.1 (98.1–109.7) | 0.01d,e |
Plasminogen, % | 75–150 | 126.2 (115.7–137.2) | 122.9 (108–133.45) | 120.6 (105.4–136.2) | 0.17f |
t‑PA:Ag, ng/ml | 4–12 | 14.38 (11.64–19.09) | 13.51 (10.26–16.97) | 10.4 (7.34–12.73) | <0.001b |
PAI‑1:Ag, ng/ml | 10–20 | 38.52 (29.29–47.59) | 33.58 (21.66–43.37) | 29.23 (22.69–41.07) | 0.01e,f |
PAP, ng/ml | 175–487 | 1676.3 (1429.6–2200.1) | 1577.2 (1352.8–1937.4) | 1421.9 (1231–1852.8) | 0.008d,e |
vWF:Ag, % | 50–150 | 336.7 (289.2–395.2) | 317 (257.2–378.65) | 244.7 (206.2–295.9) | <0.001b |
ADAMTS‑13, IU/ml | 0.4–1.3 | 0.84 (0.76–0.9) | 0.87 (0.81–0.91) | 0.82 (0.73–0.93) | 0.17c |
vWF:Ag/ADAMTS‑13 ratio |
| 4.07 (3.52–4.95) | 3.65 (3.08–4.48) | 3.15 (2.40–4.18) | <0.001b |
aCL IgG antibodies, GPL | <15 | 6.44 (4.19–10.92) | 5.85 (4.31–8.98) | 6.84 (4.56–9.79) | 0.78c |
aCL IgM antibodies, MPL | <12.5 | 14.19 (11.36–19.41) | 14.75 (11.73–21.34) | 13.63 (10.74–17.94) | 0.43c |
aβ2GP1 IgG antibodies, SGU | <20 | 3.13 (2.75–3.97) | 2.96 (2.77–3.36) | 2.94 (2.76–3.38) | 0.47c |
aβ2GP1 IgM antibodies, SMU | <20 | 2.52 (1.75–4.52) | 2.67 (1.84–4.52) | 1.94 (1.52–2.9) | 0.01d,e |
aPS/PT IgG, IU | <30 | 6.92 (5.97–8.45) | 7.71 (6.72–9.46) | 7.43 (6.36–9.08) | 0.02f |
aPS/PT IgM, IU | <30 | 15.23 (9.66–25.01) | 15.67 (11.42–23.54) | 14.55 (9.59–21.2) | 0.76c |
28‑day follow‑up | |||||
Parameter | Normal range | Advanced respiratory support (n = 43) | Conventional oxygen therapy (n = 91) | No supplemental oxygen (n = 30) | P valuea |
Fibrinogen, g/l | 1.8–3.6 | 3.4 (2.9–3.7) | 3.2 (2.8–3.6) | 3.2 (2.62–3.38) | 0.27c |
Factor VIII, % | 50–150 | 131.4 (93.75–163.3) | 120.8 (87.65–162.45) | 116.4 (89.2–151.48) | 0.66c |
TAT, µg/l | 1.2–4.2 | 4.83 (3.84–7.68) | 4.48 (3.67–6.42) | 4.56 (3.42–5.86) | 0.60c |
CLT, min | 74–95g | 103 (93.5–119) | 98 (86–106.75) | 99 (91.25–104.5) | 0.056f |
D‑Dimer, ng/ml | 0–500 | 679 (396–1026.5) | 644 (405.5–1084) | 624 (319.75–1032.25) | 0.75c |
α2‑Antiplasmin, % | 80–120 | 105.8 (101.1–109.7) | 104.2 (98.9–108.35) | 104.35 (100.67–109.42) | 0.29c |
Plasminogen, % | 75–150 | 127.1 (118.6–134.85) | 119.4 (111.2–129.95) | 120 (109.4–133.48) | 0.07e,f |
t‑PA:Ag, ng/ml | 4–12 | 9.08 (6.31–11.64) | 8.09 (6.19–9.33) | 6.83 (5.42–9.16) | 0.13e |
PAI‑1:Ag, ng/ml | 10–20 | 22.71 (14.45–35.4) | 22.36 (14.41–32.96) | 22.8 (15.2–30.5) | 0.97c |
PAP, ng/ml | 175–487 | 754.86 (596.15–1165.24) | 732.18 (596.15–1074.32) | 732.18 (593.68–933.94) | 0.85c |
vWF:Ag, % | 50–150 | 205.6 (168.85–252.15) | 174.3 (121.65–228.45) | 142.6 (112.45–195.08) | 0.008e,f |
ADAMTS‑13, IU/ml | 0.4–1.3 | 0.86 (0.81–0.92) | 0.89 (0.83–0.93) | 0.88 (0.82–0.94) | 0.53c |
vWF:Ag/ADAMTS‑13 ratio |
| 2.33 (1.95–2.91) | 1.98 (1.36–2.73) | 1.6 (1.33–2.14) | 0.01e,f |
aCL IgG antibodies, GPL | <15 | 18.55 (12–33.08) | 11.84 (7.32–18.91) | 9.58 (6.32–14.07) | <0.001b |
aCL IgM antibodies, MPL | <12.5 | 19.94 (14.62–34.82) | 17.97 (13.52–28.82) | 13.43 (10.36–20.85) | 0.050 d,e |
aβ2GP1 IgG antibodies, SGU | <20 | 2.59 (2.3–4.54) | 2.65 (2.33–3.34) | 2.61 (2.40–2.76) | 0.84c |
aβ2GP1 IgM antibodies, SMU | <20 | 2.8 (2.07–4.58) | 2.86 (2.12–4.96) | 2.12 (1.82–3.35) | 0.10d |
aPS/PT IgG, IU | <30 | 8.86 (7.73–10.61) | 8.86 (7.06–10.54) | 7.93 (6.85–9.67) | 0.25e |
aPS/PT IgM, IU | <30 | 15.31 (11.7–19.81) | 16.01 (10.88–25.86) | 13.79 (8.91–22.65) | 0.34c |
Temporal variability of hemostatic activity
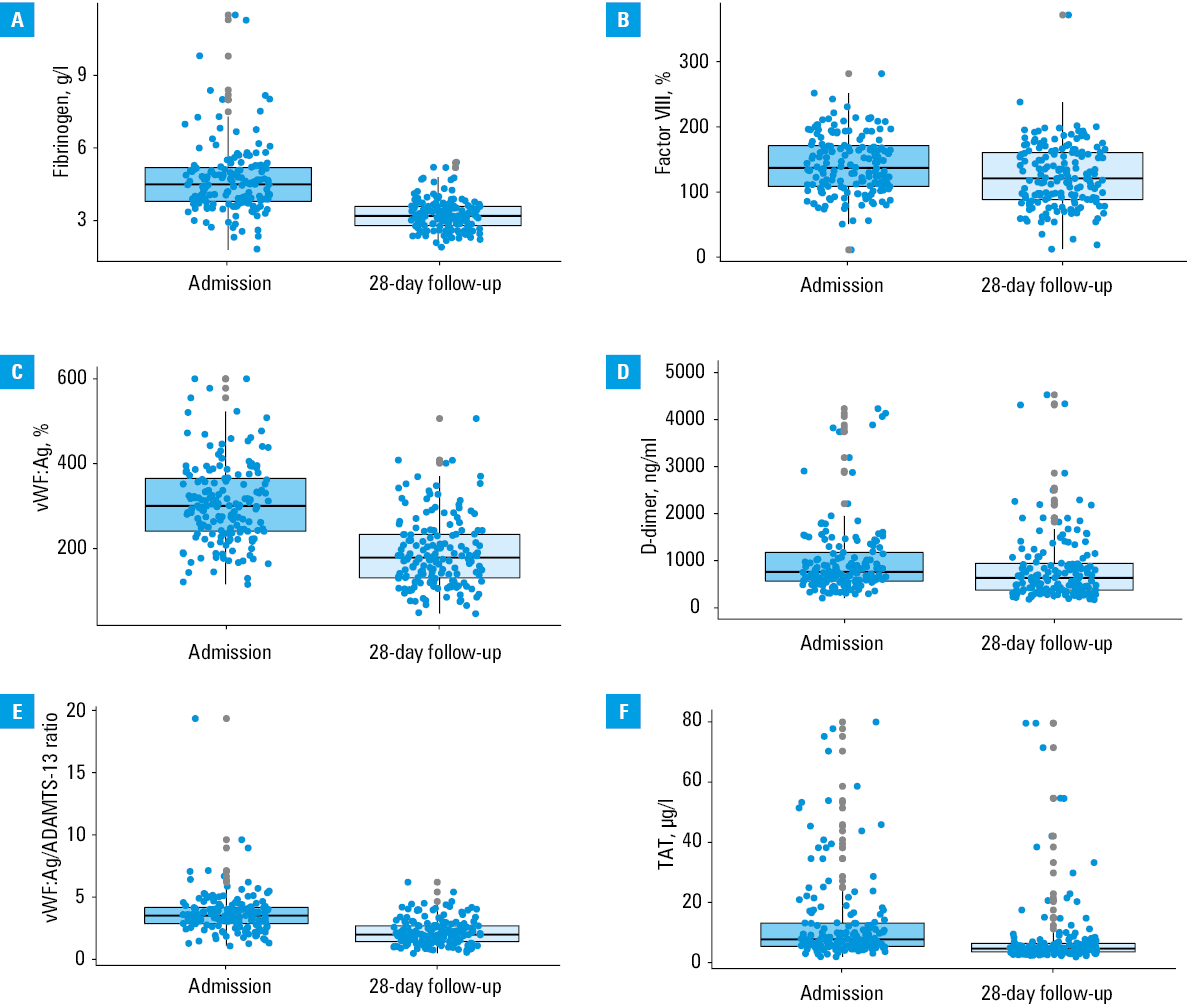
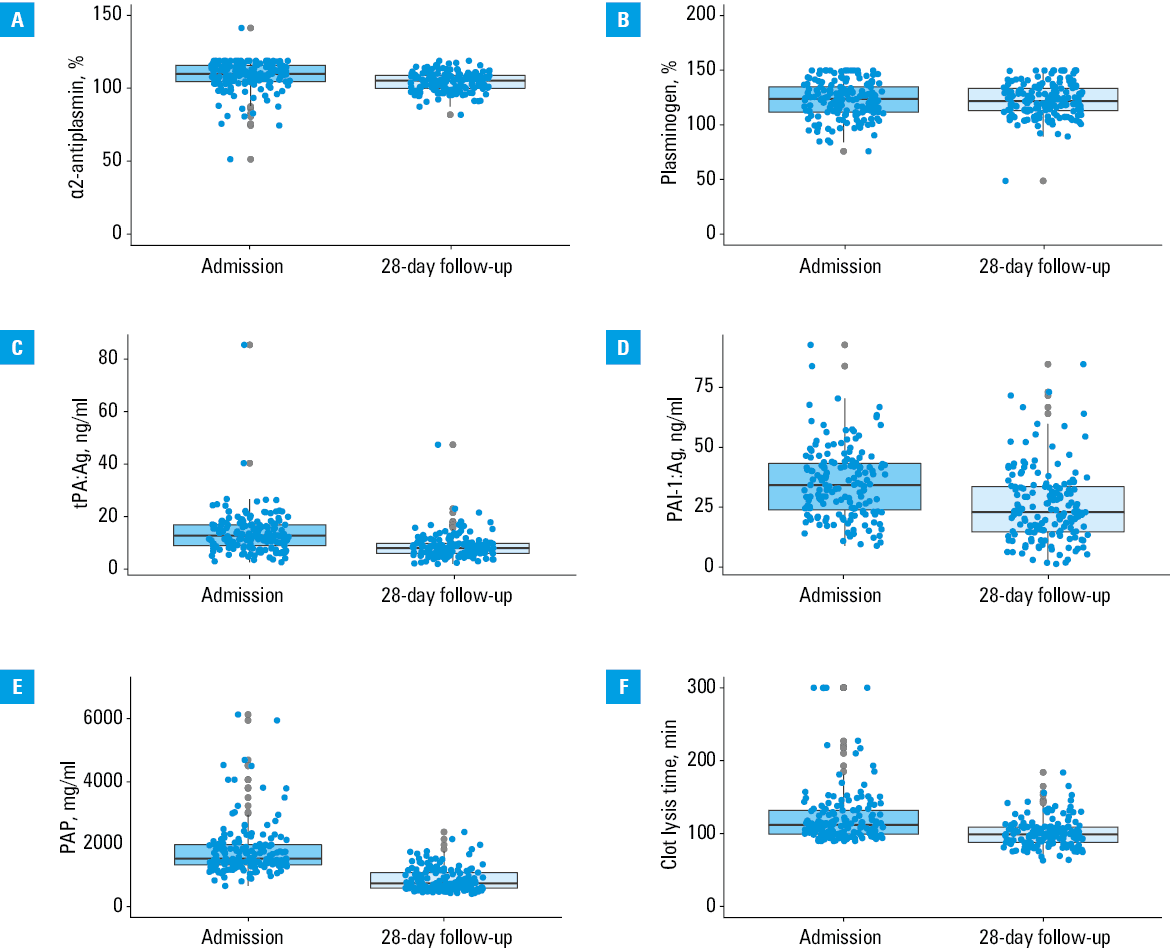
The 28‑day follow‑up evaluation of hemostatic activity was available for 164 patients (66.9%). We revealed a significant decrease in all coagulation, fibrinolysis, and endothelial dysfunction markers, except for plasminogen activity (123.75% vs 121.6%; P = 0.94). Particularly large differences were observed for fibrinogen (4.5 vs 3.2 g/l; P <0.001), PAP (1537.6 vs 741.5 ng/ml; P <0.001), PAI‑1:Ag (34.1 vs 22.8 ng/ml; P <0.001), and vWF:Ag (300.1% vs 178.2%; P <0.001). This analysis is summarized in Table 3 and visualized in Figures 1 and 2. Additional analyses revealed that similar trends were evident in all subgroups (Supplementary material, Table S1).
Factor | Admission | 28‑day follow‑up | P valuea |
Data are presented as median (interquartile range).
a P value for the Wilcoxon test
Abbreviations: see Table 2 | |||
Fibrinogen, g/l | 4.5 (3.8–5.2) | 3.2 (2.8–3.6) | <0.001 |
Factor VIII, % | 137.35 (108.83–171.42) | 121.1 (88.77–161) | <0.001 |
TAT, µg/l | 7.74 (5.42–13.12) | 4.68 (3.6–6.44) | <0.001 |
CLT, min | 112 (99.25–132) | 99 (88–109) | <0.001 |
D‑Dimer, ng/ml | 834.5 (584.25–1473.5) | 643.5 (377.75–1083.25) | <0.001 |
α2-Antiplasmin, % | 109.95 (104.5–115.73) | 105.2 (100–108.8) | <0.001 |
Plasminogen, % | 123.75 (111.57–134.52) | 121.6 (112.98–133.38) | 0.94 |
t‑PA:Ag, ng/ml | 12.84 (9.02–16.94) | 8.1 (6.08–9.85) | <0.001 |
PAI‑1:Ag, ng/ml | 34.06 (23.73–43.06) | 22.76 (14.49–33.36) | <0.001 |
PAP, ng/ml | 1537.58 (1342.16–1991.57) | 741.45 (596.15–1086.99) | <0.001 |
vWF:Ag, % | 300.1 (240.33–365) | 178.2 (130.57–232.85) | <0.001 |
ADAMTS‑13, IU/ml | 0.87 (0.8–0.92) | 0.88 (0.82–0.93) | 0.003 |
vWF:Ag/ADAMTS‑13 ratio | 3.56 (2.91–4.21) | 2.02 (1.46–2.74) | <0.001 |
aCL IgG antibodies, GPL | 5.86 (4.26–9.12) | 12.55 (8.33–20.9) | <0.001 |
aCL IgM antibodies, MPL | 14.60 (11.54–20.23) | 17.91 (12.96–29.03) | <0.001 |
aβ2GP1 IgG antibodies, SGU | 2.96 (2.77–3.38) | 2.59 (2.33–3.32) | <0.001 |
aβ2GP1 IgM antibodies, SMU | 2.47 (1.75–4.4) | 2.69 (2.04–4.64) | 0.06 |
aPS/PT IgG | 7.65 (6.67–10.02) | 8.66 (7.19–10.47) | <0.001 |
aPS/PT IgM | 14.58 (10.80–23.31) | 15.31 (10.92–24.01) | 0.76 |
Abbreviations: see Table 2
Abbreviations: see Table 2
Antiphospholipid antibodies: intergroup differences and temporal variability
Comparison of antibody levels at admission revealed no significant differences between the studied groups with an exception of aβ2GP1 IgM antibodies, which were lower in the patients not requiring oxygen supplementation than in the conventional oxygen therapy group (2.67 vs 1.94 SMU; P = 0.002) and in the advanced respiratory support group (2.52 vs 1.94 SMU; P = 0.01), and aPS/PT IgG antibodies, which were higher in the advanced respiratory support group than in the conventional oxygen therapy group (6.92 vs 7.71 IU; P = 0.003).
A similar analysis of the 28‑day follow‑up data showed a higher aCL IgM concentration in the advanced respiratory support and conventional oxygen therapy groups than in the patients without respiratory failure (19.94 vs 17.97 vs 13.43 MPL; P = 0.05). Also, aCL IgM concentration was the highest in the advanced respiratory support group, followed by the conventional oxygen therapy group and the no supplemental oxygen group (18.55 vs 11.84 vs 9.58 MPL; P <0.001).
An analysis of temporal changes in antibody concentrations showed an increase in aCL IgG antibodies (5.86 vs 12.55 GPL; P <0.001), aCL IgM antibodies (14.60 vs 17.91 MPL; P <0.001), aβ2GP1 IgG antibodies (2.96 vs 2.59 SGU; P <0.001), and aPS/PT IgG antibodies (7.65 vs 8.66 IU; P <0.001). These results are summarized in Tables 2 and 3. Data on the prevalence of positive antibodies and their changes over time are presented in Supplementary material, Tables S2 and S3.
Discussion
In this prospective observational study including 245 patients hospitalized for COVID‑19, we confirmed a tendency for hypercoagulability, hypofibrinolysis, and endothelial dysfunction at a degree associated with severity of respiratory failure. In all studied groups, the markers of coagulation and fibrinolysis decreased within 28 days since initial hospital admission but endothelial dysfunction remained most pronounced in a subgroup of patients with the most severe COVID‑19.
The analysis of coagulation markers on admission revealed increased levels of fibrinogen and TAT suggesting marked hypercoagulability. It was accompanied by a significant fibrinolysis shutdown reflected by prolonged CLT. We believe that increased concentrations of potent fibrinolysis inhibitors (α2AP and PAI‑1) outweighed elevated levels of tPA and shifted the balance toward hypofibrinolysis.23,24 Finally, increased vWF:Ag, PAI‑1, and particularly high vWF:Ag/ADAMTS‑13 ratio suggest significant endothelial dysfunction and significant deviations in the ADAMTS‑13–von Willebrand factor axis.15,25-27 Our results corroborate previous reports in terms of observed abnormalities and confirm their association with severity of COVID‑19. The majority of available studies divided patients according to their survival status or requirement for intensive care unit (ICU) admission.14,28 Our analysis broadens the current knowledge on this issue by using a wider panel of hemostatic markers and by focusing on patients treated primarily in hospital wards and stratified according to the modality of respiratory support. Similar approach was adopted previously by Rauch et al,29 who reported analogous results but used more common coagulation tests without assessment of fibrinolysis. The hemostatic abnormalities described in patients with COVID‑19 made appropriate thromboprophylaxis one of the cornerstones of COVID‑19 management. There are also some promising reports showing a potential benefit of fibrinolytic therapy in the patients with severe COVID‑19.30-32
The requirement for postdischarge thromboprophylaxis remains one of the most widely discussed topics regarding the management of COVID‑19 patients. The American Society of Hematology guideline panel discourages it, while some experts suggest considering extended thromboprophylaxis in the patients with a high risk for thrombotic complications and without a high risk for bleeding.33,34 On the one hand, the risk of thromboembolic events in patients with COVID‑19 is increased up to 4 months after the diagnosis, in comparison with COVID‑19–negative controls.35 On the other hand, a meta‑analysis including nearly 19 000 COVID‑19 survivors revealed that the absolute incidence of postdischarge venous thromboembolism (VTE) in patients hospitalized for COVID‑19 was low and accounted for 1.8%.36 The currently available literature exploring the impact of COVID‑19 on hemostasis after discharge from the hospital pertained to ICU survivors. Serial measurements using viscoelastic assays showed that hypercoagulability and hypofibrinolysis persisted over 6 weeks since admission, but were no longer present in 3‑month and 6‑month follow‑ups.17,18,37 Our results indicate that the severity of all initially observed abnormalities decreased significantly within 28 days since the admission to the hospital, and such a trend was observed in all subgroups. Another important observation is the disappearance of intergroup differences found upon admission in all assessed markers of coagulation and fibrinolysis. This may suggest that hypercoagulability and hypofibrinolysis are typical for acute phase of the disease and subside relatively quickly. Conversely, the degree of endothelial dysfunction remains the highest in the advanced respiratory support group. This observation, together with the results of Fogarty et al,38 may indicate a potentially crucial role of endothelial dysfunction in the development of long COVID. Unfortunately, the lack of a healthy control group in our study does not allow for drawing conclusions about normalization of hemostatic parameters in the follow‑up. Further studies are required to precisely describe the association of prolonged endotheliopathy with long‑term sequelae of COVID‑19.
The clinical significance of antiphospholipid antibodies in COVID‑19 has been discussed since the first months of the pandemic. The transient presence of aPL antibodies is not an exceptional feature of COVID‑19, and had previously been observed in other viral infections.39 In previous studies including COVID‑19 patients, Lupus anticoagulant was found in 5% to 90% of ICU patients and in 2% to 66% of regular ward patients. The prevalence of other aPL antibodies was characterized by similar variability.40 However, to date there has been no robust evidence on their pathogenic role in thrombotic events during COVID‑19, and data on the association between the level of aPL antibodies and severity of the disease are conflicting.41-44 Our study shows some differences between the groups in aPS/PT and aβ2GP1 IgM antibodies levels. Their magnitude and variable directions suggest that the relation between antiphospholipid antibodies and severity of respiratory failure is rather weak and probably clinically insignificant. This corroborates the results of a meta‑analysis by Taha et al,45 which showed a lack of association between aPL positivity and requirement for invasive mechanical ventilation. Temporal changes in antiphospholipid antibodies profile have not been studied extensively but available studies suggest that the majority of patients with initially positive antibodies have normal levels of antiphospholipid antibodies after 1 to 6 months.46,47 Our study shows that aCL and aPS/PT levels increase, while aβ2GP1 levels decrease within 28 days since the initial admission. Importantly, 1 in 4 patients had at least double‑positive antibodies on the 28th day. Unfortunately, we did not gather long‑term data on antibody levels, which would definitely offer some valuable insight into the dynamics of the antibody clearance. This information is crucial in terms of establishing an optimal approach to clinical follow‑up in the patients with COVID‑19 in whom antiphospholipid antibodies were found in the acute phase of the disease. The current recommendations suggest retesting antiphospholipid antibodies–positive patients 12 weeks after the diagnosis, however, this recommendation is based on low‑quality data and further research in this area is warranted.48
The main strength of this paper is a precise description of the disease course with particular regard to respiratory failure and wide range of tests of hemostatic activity. We are aware of several weaknesses of our study. First, a relatively small study sample as well as relatively low mortality and VTE incidence hindered a precise assessment of associations between these outcomes and hemostatic activity. Second, despite our best efforts, low‑molecular‑weight heparin was probably administered in some of the enrolled patients before blood samples were collected, which could affect the results. Third, even though we actively endorsed patients to attend the follow‑up visit, the proportion of patients missing in the 28‑day follow‑up was relatively high. Finally, some might argue that different stratification of patients according to the severity of respiratory failure would be more appropriate, particularly with regard to separation of the patients requiring intubation and hospitalization in the ICU. However, due to a very low number of such patients, after careful discussion among the experts, we decided to include the individuals requiring invasive mechanical ventilation into the advanced respiratory support group.
Summing up, this prospective observational study confirmed that the patients hospitalized for COVID‑19 are characterized by hypercoagulability, hypofibrinolysis, and endothelial dysfunction and these abnormalities are related to the severity of respiratory failure. Interestingly, the majority of hemostatic derangements subsided, at least partially, within a month since admission, regardless of the disease course, with an exception of endothelial damage, which was still present at that time. This may suggest that evaluation of hemostasis on admission may be useful in the prediction of the disease severity, and that the observed abnormalities in coagulation and fibrinolysis are limited to the acute phase of the disease. Further studies are required to determine whether persistent endothelial dysfunction and presence of antibodies are associated with long‑term thromboembolic complications.
- Zhu N, Zhang D, Wang W, et al. A novel coronavirus from patients with pneumonia in China, 2019. N Engl J Med. 2020; 382: 727‑733. | Crossref
- Watson OJ, Barnsley G, Toor J, et al. Global impact of the first year of COVID‑19 vaccination: a mathematical modelling study. Lancet Infect Dis. 2022; 22: 1293‑1302. | Crossref
- Shankar‑Hari M, Vale CL, et al; WHO Rapid Evidence Appraisal for COVID‑19 Therapies (REACT) Working Group. Association between administration of IL‑6 antagonists and mortality among patients hospitalized for COVID‑19: a meta‑analysis. JAMA. 2021; 326: 499‑518.
- Sterne JAC, Murthy S, et al; WHO Rapid Evidence Appraisal for COVID‑19 Therapies (REACT) Working Group. Association between administration of systemic corticosteroids and mortality among critically ill patients with COVID‑19: a meta‑analysis. JAMA. 2020; 324:1330‑1341. | Crossref
- Osuchowski MF, Winkler MS, Skirecki T, et al. The COVID‑19 puzzle: deciphering pathophysiology and phenotypes of a new disease entity. Lancet Respir Med. 2021; 9: 622‑642. | Crossref
SUPPLEMENTARY MATERIAL
ARTICLE INFORMATION