The effectiveness of atrial fibrillation identification using noninvasive long-term electrocardiographic monitoring system (NOMED-AF TECH)
Key words: de novo atrial fibrillation, ECG monitoring, silent atrial fibrillation


 CC BY-NC-SA 4.0
The effectiveness of atrial fibrillation identification using noninvasive long-term electrocardiographic monitoring system (NOMED-AF TECH)
Introduction: Although it is well‑known that longer electrocardiographic (ECG) monitoring allows for detection of paroxysmal silent atrial fibrillation (SAF), it is still unknown how long the ECG monitoring should last to increase the probability of SAF diagnosis.
Objectives: Our aim was to analyze ECG acquisition parameters and timing to detect SAF during the Noninvasive Monitoring for Early Detection of Atrial Fibrillation study.
Patients and methods: The protocol assumed up to 30 days of ECG telemonitoring of each participant in order to reveal AF / atrial flutter (AFL) episodes lasting at least 30 seconds. SAF was defined as AF detected and confirmed by cardiologists in asymptomatic individuals. The ECG signal analysis was based on the results of 2974 participants (98.67%). AF/AFL episodes were registered and confirmed by cardiologists in 515 individuals, that is, 75.7% of all patients (n = 680) in whom AF/AFL diagnosis was established.
Results: The median monitoring time to detect the first SAF episode was 6 days (interquartile range [IQR], 1–13). Fifty percent of the patients with this type of arrhythmia were identified by 6th day (IQR, 1–13) of the monitoring, and 75% by the 13th day of the study. Paroxysmal AF was registered on average on 4th day (IQR, 1–10).
Conclusions: The ECG monitoring time to detect the first episode of SAF in at least 75% of patients at risk of this arrhythmia was 14 days. Detection of 1 patient with de novo AF, SAF, or de novo SAF, required monitoring of, respectively, 17, 11, and 23 patients.
What's new?
The results of our study clearly show what is the most optimal time for electrocardiographic (ECG) monitoring to detect silent atrial fibrillation (SAF) in people older than 65 years. This knowledge may improve detection of AF in those who are at a high risk for developing such an arrythmia, and thus increase the chance for appropriate treatment and ischemic stroke prevention. Extending the ECG monitoring time from 6 to 14 days allows for a significant increase in the detection of SAF episodes from 50% to 75% of cases.
Introduction
Atrial fibrillation (AF) and atrial flutter (AFL) are the most common arrhythmias worldwide and their incidence increases with age. Stroke, heart failure, and increased mortality are the most serious complications in patients with AF/AFL.1,2 Although the incidence of AF/AFL is high, the methods used to diagnose AF/AFL, especially in clinically silent AF (SAF) are still expensive, and therefore their routine use in medical practice is limited.3
Nowadays, screening for AF/AFL might be performed with different, commonly used methods, for example, impedance wave measurement in smart watches or special mobile applications. Moreover, implanted pacemakers or cardioverter‑defibrillators with rapid atrial rhythm identification may allow for screening patients with AF/AFL episodes. However, all these methods are not sufficient for AF/AFL diagnosis.4
Although it is known that the longer the electrocardiographic (ECG) monitoring, the greater the possibility for AF/AFL diagnosis, it has not yet been determined how long it should last to recognize those arrhythmias, especially in clinically asymptomatic patients.5
The aim of this study was to analyze ECG acquisition parameters and timing to detect SAF during the Noninvasive Monitoring for Early Detection of Atrial Fibrillation (NOMED‑AF) study.
Patients and methods
Study population and general rules of long‑term electrocardiographic monitoring
The NOMED‑AF study was a cross‑sectional study based on a nationwide sample of adults aged 65 years and older (n = 3014; 1479 women; mean [SD] age, 77.5 [7.9] years). A detailed description of the study design was provided elsewhere.6 In this paper, we present a substudy focused on an analysis of a 30‑day ECG acquisition in order to detect AF. Patient characteristics are presented in Table 1. The enrollment lasted from March 15, 2017 to March 10, 2018. The study protocol assumed up to 30 days of ECG telemonitoring of each patient in order to reveal AF/AFL episodes lasting at least 30 seconds.7 The ECG continuous monitoring was performed in 3014 participants, however in 40 persons (1.33%) the ECG signal acquisition was not obtained. The ECG signal analysis was therefore based on the results of 2974 participants (98.67%). AF/AFL episodes were registered and confirmed by cardiologists in 515 individuals, that is, 75.7% of all patients (n = 680) in whom AF/AFL diagnosis was established. In 165 patients, AF/AFL diagnosis was made based on medical records. SAF was defined as AF detected and confirmed by cardiologists in asymptomatic individuals.
Parameter | Whole population | Individuals with AF | Individuals without AF | P value (AF vs no AF) | |
Data are presented as number (percentage) of patients unless otherwise indicated.
Abbreviations: AF, atrial fibrillation; BMI, body mass index; CHD, coronary heart disease; CKD, chronic kidney disease; ICH, intracranial hemorrhage; ICS, ischemic cerebral stroke; IQR, interquartile range; PAD, peripheral artery disease; TIA, transient ischemic attack | |||||
Age, y | 65–69 | 572 (19) | 63 (9.3) | 509 (21.8) | <0.001 |
70–74 | 632 (21) | 106 (15.6) | 526 (22.5) | ||
75–79 | 585 (19.4) | 147 (21.6) | 438 (18.8) | ||
80–84 | 529 (17.6) | 148 (21.8) | 381 (16.3) | ||
85–89 | 442 (14.7) | 138 (20.3) | 304 (13) | ||
≥90 | 254 (8.4) | 78 (11.5) | 176 (7.5) | ||
Sex | Women | 1479 (49.1) | 267 (39.3) | 1212 (51.9) | <0.001 |
Men | 1535 (50.9) | 413 (60.7) | 1122 (48.1) | ||
BMI, kg/m2, mean (SD) | 28 (4.81) | 28.4 (4.93) | 27.9 (4.77) | 0.04 | |
Hypertension | 2433 (81.2) | 577 (85.5) | 1856 (79.9) | <0.001 | |
Diabetes | 881 (29.2) | 253 (37.2) | 628 (26.9) | <0.001 | |
Heart failure | 673 (22.4) | 277 (40.9) | 396 (17) | <0.001 | |
CKD | 1005 (34.4) | 310 (47.2) | 695 (30.7) | <0.001 | |
Hemodialysis | 8 (3.1) | 3 (3) | 5 (3.1) | 0.45 | |
Stroke | 283 (9.4) | 101 (14.9) | 182 (7.8) | <0.001 | |
ICS | 206 (6.9) | 78 (11.5) | 128 (5.5) | <0.001 | |
ICH | 16 (0.5) | 3 (0.4) | 13 (0.6) | 0.5 | |
Unclassified stroke | 61 (2) | 20 (2.9) | 41 (1.8) | 0.06 | |
TIA | 186 (6.2) | 56 (8.3) | 130 (5.6) | 0.01 | |
CHD | 666 (22.3) | 222 (32.9) | 444 (19.2) | <0.001 | |
Myocardial infarction | 446 (14.9) | 125 (18.4) | 321 (13.8) | 0.003 | |
PAD | 415 (13.9) | 129 (19) | 286 (12.4) | <0.001 | |
CHA2DS2VASc, points, median (IQR) | 4 (3–5) | 5 (4–6) | 4 (3–5) | <0.001 | |
Current smoker | 355 (11.8) | 44 (6.5) | 311 (13.3) | <0.001 | |
Ex‑smoker | 1127 (37.4) | 292 (42.9) | 835 (35.8) | <0.001 | |
The noninvasive long‑term ECG monitoring system (NOMED‑AF TECH) used in the study was developed by Comarch Healthcare (Kraków, Poland).
Patient tolerance of the monitoring system
The quality of the system used during the long‑term monitoring in this epidemiologic study was assessed by the users. Each person included in the study assessed the discomfort of using the monitoring vest on a 10‑point visual analog scale, where 0 points meant the lowest, and 10 points the highest burden associated with using the vest.
The analysis showed that during the second visit, 82% of the respondents had no adverse effects. The discomfort of wearing the vest was on average 3.6 (3) points. In 80% of the patients the adverse effects were mild to moderate. At the third visit (end of the long‑term monitoring), 79.3% of the patients reported no adverse effects, and they rated the discomfort of wearing the vest at 3.8 (3) points. In 79% of the participants, the adverse events were mild to moderate, including skin redness (9.4%), rash (3.7%), and skin chafing (3.3%).
It should be emphasized that the low incidence of undesirable local effects resulted from the use of textile electrodes and a good fit of the vest made of the materials well‑tolerated by the patient skin.
Long‑term electrocardiographic telemonitoring performance in the study population
The 4‑step treatment decision procedure was as follows: 1) ECG acquisition (vest) and ECG transmission, 2) automatic analysis of the ECG signal using Integrated Medical Algorithms Platform, 3) AF/AFL confirmation by cardiologists, and 4) report generation with a diagnosis.
The key algorithm that was developed and used in the NOMED‑AF study was the AF episode detection together with AF episode merging. The detection of AF events is based on both frequency and time series features, the morphology of QRS episodes, and their locations. First, the signal is cut into small chunks. Then, nearly 200 features extracted from the signal are analyzed with the Random Forest algorithm, which determines the occurrence of AF in each block. The detection results in a series of AF decisions in every small part of the signal. The next stage of the algorithm is to ensure uniformity of decisions. The AF episode merging part removes short (<30 s) episodes and merges small episodes into larger ones. Based on the Hidden Markov Model, it analyses the probability of AF occurrence in adjacent blocks and changes (ie, merges or removes) the decisions of a previous algorithm. At the end of the functional sequence, there is a signal quality verification. The episodes where the number of artifacts exceeds the defined amount are deleted to reduce false alarms caused by bad quality signals. During development, an internal validation was made according to the International Electrotechnical Commission standard 60601‑2‑47. The test was made on the MIT‑BIH Atrial Fibrillation Database8 that was not included in the algorithm development process to prevent overfitting. The database contains 25 records, each 10‑hour long. Thus, 93 hours of AF episodes account for approximately 40% of the registration time. According to the standard, the episode sensitivity was calculated as 93%, and positive predictivity was 85%.
Collected data
Based on the acquired ECG signal and final report, several data about the quality of ECG and AF/AFL episodes registered were collected, including total time of ECG acquisition (from the beginning to the end of the recording), total effective time of ECG acquisition (time of ECG signal analysis during the recording including artifacts), artifacts duration (% of the effective time), number and total duration time of AF/AFL episodes lasting longer than 30 seconds (AF burden), different AF/AFL duration range, and time to detect the first episode of paroxysmal AF and paroxysmal SAF.
Statistical analysis
Patient characteristics were obtained for 2 groups of participants, that is, with and without AF. To compare the significance of differences between these groups, the χ2 test or the Fisher exact test was performed for categorical variables. The comparison of body mass index was performed using the t test, while to compare CHA2DS2VASc scores, the Mann–Whitney test was used. Data in the Tables are presented as mean and SD or median and interquartile range, or minimum to maximum range. The significance level was 0.05.
We also calculated the required number of observations. First, we defined the number of patients in whom AF should be effectively sought (n = individuals with ECG monitoring divided by the number of people with previously diagnosed AF). Then, we calculated how many patients should be monitored to detect 1 patient with de novo AF (n divided by the number of patients with de novo AF) or 1 patient with SAF (n divided by the number of patients with SAF).
The cumulative incidence curves of total paroxysmal and silent AF/AFL episodes were estimated. All statistical analyses were performed using R.4.0.5 software (R Foundation, Vienna, Austria).
Ethics
The NOMED‑AF study complied with the Declaration of Helsinki, was approved by the Local Bioethical Committee (26/2015), and registered at clinicaltrials.gov (NCT03243474; https://clinicaltrials.gov/ct2/show/NCT03243474). Informed consent was obtained from all participants.
Results
The analysis of the ECG signal acquisition quality is presented in Table 2. The median time of ECG acquisition was 25.9 (IQR, 14.9–28.9) days. The median 96.2% (IQR, 89.4%–98.9%) of the recorded ECG signal had quality suitable for analysis (Table 2). The median time of persistence of the study participants was 28.4 (IQR, 19.2–30.1) days. Artifacts were present in a median of 4.2% (IQR, 1.4%–10.1%) of the ECG effective time (Table 2).
Parameter | Value |
Data are presented as median (interquartile range).
Abbreviations: ECG, electrocardiogram | |
Total time of ECG acquisition, d | 25.9 (14.9–28.9) |
Total effective time of ECG acquisition, d | 23.4 (13.1–27.6) |
Total effective time of ECG acquisition, % | 96.2 (89.4–98.9) |
Duration of artifacts, h | 17.8 (5.5–46.4) |
Duration of artifacts as a % of effective time | 4.2 (1.4–10.1) |
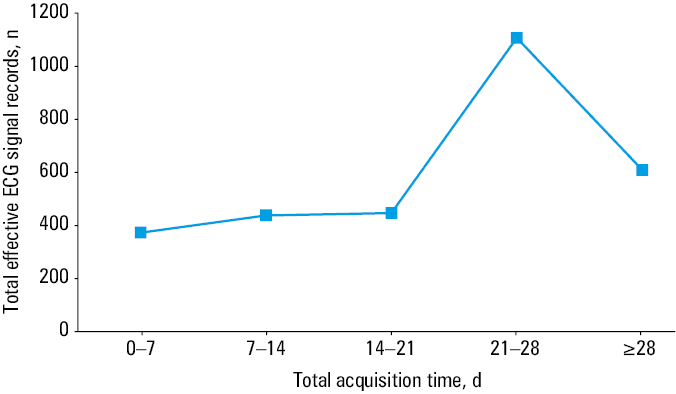
Among 2974 participants, in 88 individuals (2.96%) the effective ECG signal recording time did not exceed 1 day. More than 72% of the participants continued to acquire the ECG signal recording for longer than 14 days. The total effective time of ECG signal recording is presented in Figure 1.
The mean (SD) heart rate during the study was 74 (9) bpm. A complete analysis of heart rate during ECG continuous monitoring in the NOMED‑AF study is presented in Table 3.
Parameter | Mean (SD) | Min–Max |
Max heart rate, bpm | 168 (20) | 75–199 |
Min heart rate, bpm | 44 (10) | 26–107 |
Mean heart rate, bpm | 74 (9) | 46–138 |
Paroxysmal AF/AFL was registered with the vest in 192 participants (54.86%). The ECG signal analysis in the patients with paroxysmal and persistent AF/AFL is presented in Tables 4 and 5, respectively.
Parameter | Value |
Data are presented as median (interquartile range).
Abbreviations: AFL, atrial flutter; others, see Table 1 | |
Day of the first AF/AFL episode | 4 (1–10) |
Total time of AF/AFL duration >30 seconds, h | 13.9 (3.9–41.9) |
The longest time of AF/AFL duration, h | 10.1 (3.2–24.1) |
The shortest time of AF/AFL duration, h | 2.3 (0.1–8.8) |
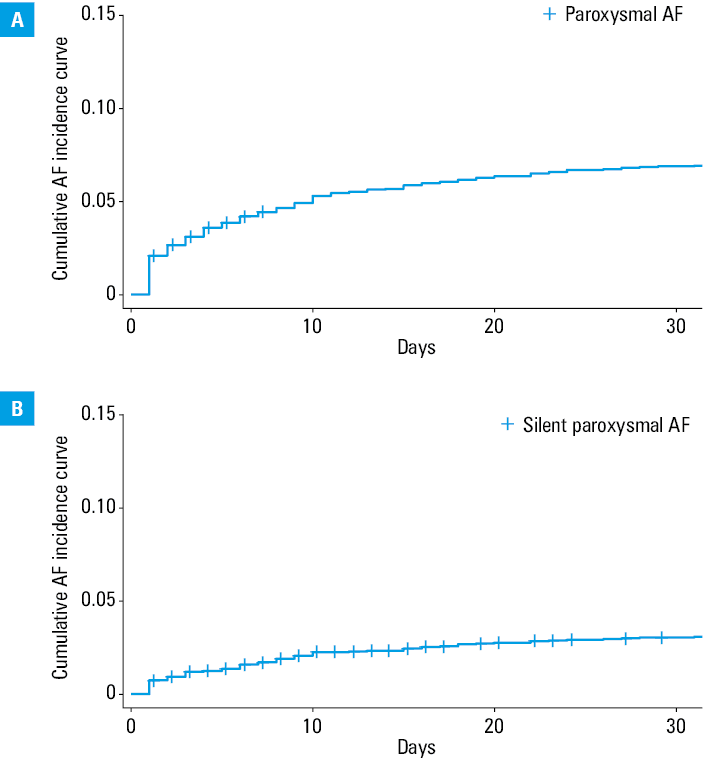
In the NOMED‑AF study, the median monitoring time to detect the first episode of silent, paroxysmal AF was 6 (IQR, 1–13) days. Median time of SAF registration was 4 (IQR, 1–10) days. Fifty percent of the patients with this type of arrhythmia were detected by the 6th day of the monitoring, while 75% of patients by the 13th day of the study. The cumulative incidence curves of total paroxysmal and silent AF/AFL episodes are presented in Figure 2.
To detect de novo AF in 1 person, 17 persons should be monitored. To detect 1 patient with SAF, 11 people should be monitored, and to detect 1 patient with de novo SAF, 23 participants should be monitored.
Discussion
The prevalence of asymptomatic AF in people aged 65 years and older is estimated at approximately 1.5%. Undiagnosed AF correlates with cryptogenic stroke and heart failure. The diagnosis of SAF is of particular importance, especially in patients aged 65 years and older, as stroke is very often the first symptom of the disease. Due to the lack of symptoms, the patients with SAF do not receive anticoagulant therapy and are therefore more exposed to severe thromboembolic complications. Hence, early diagnosis and implementation of anticoagulant therapy is of particular importance in this group.
Methods that enable AF detection are very different and their efficacy depends on the monitoring duration and technology used to detect arrythmia. Currently, there is a wide access to various technologies allowing for the detection of heart rhythm disturbances, that is, smartwatches or recorders connected to smartphones. Unfortunately, these devices have different sensitivity and specificity of detecting arrhythmias, and this can lead to false‑positive results and implementation of unnecessary treatment.9 Although these tools might be helpful in detecting rhythm disturbances, they should not be used as the methods for AF identification.
Generally, AF detection is improved by longer and more precise observations and using more sophisticated methods.10 Indeed, long‑term ECG monitoring allows for detection and diagnosis of new AF/AFL episodes,11 as evidenced recently in the Apple Heart Study and Huawei Heart Study using smartwatches for a population AF screening.12-14 The Apple Heart Study conducted on 419 297 smartwatch application users, allowed for the identification of irregular pulse in 0.5% of them. Further, 1 week of ECG registration allowed for AF identification in more than 30% of all smartwatch application users.11,12 A much higher percentage of diagnosed AF was reported in the Huawei Heart Study,15 where 0.23% of all participants had an irregular rhythm and in the course of further diagnostics, AF was confirmed in 87% of them.
Although the European Society of Cardiology guidelines recommend opportunistic screening for early identification of SAF in patients aged 65 years and older,15 to make this search clinically valuable, it should be rather performed among those who are at an increased risk of harboring SAF.9 To confirm the diagnosis of AF, a single‑lead ECG registration lasting for 30 seconds or longer or 12‑lead ECG registration should be performed and analyzed by a physician.15 The results of the NOMED‑AF study clearly show how useful and helpful long‑term ECG monitoring is in everyday clinical practice thanks to detecting de novo paroxysmal AF, especially clinically SAF.16 Moreover, the analysis of risk factors for the occurrence of SAF allowed for identifying the group of patients for whom the long‑term ECG monitoring is particularly useful.17
To conclude, our study showed that screening based on ECG recording is possible and allows for an immediate diagnosis of AF, without the need for further tests. Longer ECG monitoring in the elderly people allows for detection of more AF episodes. ECG monitoring for 14 days allowed us to detect 75% of AF cases, and by extending it to 22 days, we were able to detect as much as 90% of the cases. Thus, the longer the ECG monitoring, the greater the chance of detecting AF. To detect 1 patient with SAF, 11 individuals should be monitored. The ease and convenience of use and good quality of the ECG recording with the noninvasive long‑term ECG monitoring system vest allow for precise detection of AF episodes in the group of people who are at the highest risk.
- Chugh SS, Havmoeller R, Narayanan K, et al. Worldwide epidemiology of atrial fibrillation. A global burden of disease 2010 study. Circulation. 2014; 129: 837‑847. | Crossref
- Musiałek P, Monteiro A, Siddiqui AH. Atrial fibrillation and stroke: more than a story of a villain and a victim. Pol Arch Intern Med. 2022; 132: 16213. | Crossref
- Nielsen JC, Lin Y‑J, Figueiredo MJO, et al. European Heart Rhythm Association (EHRA) / Heart Rhythm Society (HRS) / Asia Pacific Heart Rhythm Society (APHRS) / Latin American Heart Rhythm Society (LAHRS) expert consensus on risk assessment in cardiac arrhythmias: use the right tool for the right outcome, in the right population. Europace. 2020; 22: 1147‑1148. | Crossref
- Jones NR, Taylor CJ, Hobbs R, et al. Screening for atrial fibrillation: a call for evidence. Eur Heart J. 2020; 41: 1075‑1085. | Crossref
- Dussault C, Toeg H, Narhan M, et al. Electrocardiographic monitoring for detecting atrial fibrillation after ischemic stroke or transient ischemic attack. Systematic review and meta‑analysis. Circ Arrhythm Electrophysiol. 2015; 8: 263‑269. | Crossref
ARTICLE INFORMATION