Association of the ILR1 and FAS gene variants with primary nonresponse to anti–tumor necrosis factor therapy in patients with Crohn disease
Key words: anti-TNF drugs, apoptosis, Crohn disease, genetics, response


 CC BY-NC-SA 4.0
Association of the ILR1 and FAS gene variants with primary nonresponse to anti–tumor necrosis factor therapy in patients with Crohn disease
Introduction: Crohn disease (CD) is a chronic inflammatory disease characterized by an uncontrolled immune response of the intestinal mucosal cells to antigens derived from the gut lumen. Specifically, the introduction of anti–tumor necrosis factor (TNF) drugs has changed the approach to the treatment of inflammatory bowel disease, and set new therapeutic goals, such as that of controlling clinical symptoms while simultaneously achieving complete endoscopic and mucosal remission. The mechanisms of action of anti‑TNF drugs—and consequently the mechanisms of resistance to anti‑TNF therapy—are unknown.
Objectives: Our study was an attempt to discover whether the potential mechanism of nonresponse may be conditioned by polymorphisms in the genes involved in independent inflammatory or apoptotic pathways.
Patients and methods: The study included 196 diagnosed and clinically characterized Polish patients with CD treated with anti‑TNF therapy. Variants rs7539036, rs2041747, rs5746053, rs5746054, rs1061624, rs1143634, rs7896789, and rs55790676 of the FCGR3A, IL1R, TNFRSF1B, IL1B, FAS, and ADAM17 genes were genotyped using Sanger sequencing, and analyzed in the context of response to biologic treatment.
Results: We observed that 33 patients (16.8%) did not respond to the therapy, which was associated with carrying the rs2041747 G allele variant of the ILR1 gene (odds ratio [OR], 3.72; P = 0.009). Moreover, the presence of the FAS rs7896789 homozygous CC genotype correlated with increased susceptibility to the lack of response to the anti‑TNF therapy (OR, 15.22; P = 0.003), whereas TT was identified as a potentially protective genotype.
Conclusions: In patients with CD treated with anti‑TNF drugs, complex pathways with multigene conditioning participate in the mechanism underlying treatment resistance. The genes involved in apoptosis, FAS and ILR1, seem to play an essential role in the lack of response to the treatment, and would be interesting objects of further population and functional research.
What's new?
The number of biologic drugs is increasing, and patients differ in their response to this type of therapy. There is a need for research enabling individualization of biologic treatment based on patient genetic predispositions. Data published to date are limited and inconsistent. In the present study, we analyzed selected genetic variants in the context of the lack of response to anti–tumor necrosis factor (TNF) therapy in patients with Crohn disease (CD), and showed that the genes involved in apoptosis, FAS and ILR1, seem to be associated with treatment nonresponse. The results broaden our understanding of the mechanisms underlying the lack of primary response to anti‑TNF drugs in patients with CD. In addition, our study is the first pharmacogenetic research concerning anti‑TNF therapy in Polish patients with inflammatory bowel disease. The results are highly desirable and needed in clinical practice and personalized therapies, and constitute the basis for further research in other populations.
Introduction
Crohn disease (CD) is a chronic inflammatory disease characterized by an uncontrolled immune response of cells in the intestinal mucosa to antigens derived from its lumen. As a result of these interactions, numerous cytokines are secreted. Among them, tumor necrosis factor-α (TNF-α) is especially active, and drugs that block its activity currently play a fundamental role in the treatment of CD. Specifically, the introduction of anti‑TNF drugs changed the approach to inflammatory bowel disease (IBD) treatment, and set new therapeutic goals, such as that of controlling clinical symptoms while simultaneously achieving complete endoscopic and mucosal remission of the disease. Despite these advances, approximately 40% of patients do not respond to anti‑TNF therapy. Since biologic treatment may also induce adverse effects, there is a clinical need to establish predictive markers of response to identify a subgroup of patients that are more likely to benefit from anti‑TNF treatment. Biochemical markers, mucosal factors, as well as the pharmacokinetics and pharmacogenomics of drugs are being investigated as the potential predictors.
Although the exact mechanisms of action of anti‑TNF drugs, and consequently the mechanisms of resistance to anti‑TNF therapy, are unknown, several proteins have been identified as the key mediators of this targeted clinical approach. One such protein is tumor necrosis factor receptor 1B (TNFR1B), a TNF receptor that has been implicated in the pathogenesis of inflammatory diseases, and is expressed primarily on activated cells of the immune system, fibroblasts, as well as endothelial and epithelial cells in response to proinflammatory factors and cytokines, including TNF itself.1 Specifically, the M196R gene polymorphism is associated with an increased risk of ulcerative colitis (UC), systemic lupus erythematosus, and rheumatoid arthritis.2,3 TNFR1B can bind to both membrane and soluble forms of TNF; however, the complex formed with the membrane form is more stable. Binding of TNF with TNFR1B results in the recruitment of cytoplasmic complexes of TNF receptor–associated factor 2, cellular inhibitors of apoptosis 1 and 2 (TRAF‑2 – cIAP‑1 – cIAP2) domains, which can further exert ubiquitin ligase activity and inhibit caspases and other inducers of apoptosis. This activity not only increases cell survival, but also cell proliferation.4,5 Accordingly, it has recently been generally acknowledged that anti‑TNF therapy limits the antiapoptotic influence of activated TNFR1B, ultimately promoting apoptosis in these proinflammatory cells.6 After binding to cells with TNFR1 receptors on their surface, including mainly macrophages, the anti‑TNF induces apoptosis of target cells through a costimulation mechanism.
Unfortunately, the mechanisms underlying the failure of response to anti‑TNF therapy have not been fully elucidated. Their better understanding would be useful for optimizing the approach to personalized medicine in IBD.7 In our previous pharmacogenetic studies, after sequencing a panel of 23 genes using the next‑generation sequencing (NGS) technology, we observed that 11 loci located in the FCGR3A (rs7539036, rs6672453, rs373184583, and rs12128686), IL1R (rs2041747), TNFRSF1B (rs5746053), IL1B (rs1071676, rs1143639, rs1143637, and rs1143634), and FAS (rs7896789) genes were related to the lack of response following the induction of anti‑TNF therapy in patients with CD.8 Herein, we aimed to confirm these interesting findings in a larger patient cohort to clarify whether the potential mechanism of nonresponse could be driven by independent inflammatory or apoptosis pathways, such as antibody‑dependent cell cytotoxicity, reverse signaling, and blocking of TNF receptor–mediated activities, as well as by neutralization of the anti‑TNF drug due to impaired TNF convertase ADAM17, which together would eventually cause an adverse effect.
Patients and methods
Patient characteristics and samples
The study included 196 Polish patients hospitalized at the Department of Gastroenterology, Dietetics and Internal Diseases of the Poznan University of Medical Sciences in Poznań, Poland. All participants gave their written consent to undergo genetic testing, endoscopy, magnetic resonance (MR) enterography, and blood testing for the assessment of biochemical parameters. The study was approved by the Bioethics Committee of the Poznan University of Medical Sciences (762/13).
The patients with a confirmed diagnosis of CD based on the medical history, physical examination, endoscopy, and MR enterography results were analyzed. All individuals were treated with anti‑TNF therapy under the therapeutic program of the National Health Fund (the official reimbursement program for all biologic therapies in Poland) at the Gastroenterology Department in the years 2017 to 2021. We included biologically‑naïve patients aged over 18 years with active CD and with a history of treatment failure or intolerance to first‑line therapies, such as mesalamine, corticosteroids, and / or immunosuppressants. Presence of an ileostomy or colostomy and infectious complications (including intra‑abdominal infections) were considered exclusion criteria. The diagnosis was based on predefined criteria,9 and clinical disease activity was assessed using the Crohn Disease Activity Index (CDAI).10
The individuals who had never smoked or had quit smoking at least 10 years prior to participating in the study were considered nonsmokers. The patients were administered infliximab infusions at a dose of 5 mg/kg body weight at weeks 0, 2, and 6 (induction phase), and then every 8 weeks up to 1 year (54 weeks; maintenance phase). Adalimumab was administered subcutaneously at a dose of 160 mg at week 0, 80 mg at week 2, and then 40 mg every other week for up to 1 year (54 weeks). Response to the anti‑TNF therapy was assessed after 12 weeks of the treatment, using the CDAI score. Clinical response was defined as a reduction in CDAI by at least 70 points. In patients with fistulas, a complete response was defined as a complete cessation of fistula drainage, while a partial response was defined as a drainage reduction by at least 50%. We also assessed the biological marker (C‑reactive protein [CRP]), endoscopic response (simple endoscopic assessment of Crohn disease [SES‑CD]), and magnetic resonance imaging (simple assessment of enterographic activity in Crohn disease [SEAS‑CD]).10,11 These parameters were assessed twice—before the treatment and 12 weeks after induction of the therapy.
Genotyping
In all participants, genomic DNA was isolated from the peripheral blood using the guanidine isothiocyanate solution, and stored at 4 °C in a TE buffer containing 1 mM EDTA and 10 mM Tris‑Cl. Amplification of the DNA regions containing the loci of the FCGR3A, IL1R, TNFSF1B, IL1B, FAS, and ADAM17 genes was performed using primers designed in a Primer3‑BLAST designing tool (National Library of Medicine, Bethesda, Maryland, USA). Combinations of all the primers used and the length of amplicons are presented in Table 1. A polymerase chain reaction (PCR) was carried out in a total volume of 25 μl with 100 ng of genomic DNA, 2.5 μl of 10‑times concentrated buffer, 1.5 mM MgCl2, 200 μM deoxyribonucleotide triphosphate, 0.15 μM of each primer, and 1 unit of FIREPol DNA Polymerase (Solis BioDyne, Tartu, Estonia). The amplification was performed using a T100 Thermal Cycler (BIO‑RAD, Hercules, California, United States). The PCR program started with initial denaturation at 95 °C for 4 minutes, followed by 32 cycles of denaturation at 94 °C for 30 seconds, annealing at a temperature shown in Table 1 for each fragment, respectively, for 30 seconds, and extension at 72 °C for 1 minute, as well as final extension at 72 °C for 7 minutes. Then, Sanger sequencing was performed in both directions on an Applied Biosystems 3500 Genetic Analyzer (Thermo Fisher Scientific, Waltham, Massachusetts, United States) using a BigDye Terminator v3.1 Cycle Sequencing Kit (Thermo Fisher Scientific), according to the manufacturer’s instructions. The results were analyzed using the Sequencing Analysis Software system (Thermo Fisher Scientific).
No | Gene (variant) | OMIM, No | Chromosome coordinates, GRCh38 / hg19 | Primer sequence (5’→3’) | Annealing temperature, °C | Amplicon length, base pairs |
Abbreviations: chr, chromosome; F, forward; OMIM, Online Mendelian Inheritance in Man; R, reverse | ||||||
1 | FCGR3A (rs7539036) | 146740 | chr1:
161542941 | F: TGGGTACCAAGTCTCTTTCTGC | 57 | 362 |
R: GGTACTCACTGGGGCTTCC | ||||||
2 | TNFRFS1B (rs5746053, rs5746054) | 191191 | chr1: 12202241/ 12202369 | F: GGCCAGTGCGTTGGACA | 65 | 568 |
R: TATCAGTAGCTGGGCCGTG | ||||||
3 | TNFRFS1B (rs1061624) | chr1: 12207208 | F: GGTGTGGGCTGTGTCGTAG | 59 | 404 | |
R: GGTTTTCTGGAAGCCAGAGC | ||||||
4 | ADAM17 (rs55790676) | 603639 | chr2: 9555759 | F: CTTCCGGCTGTGGGTGG | 63 | 265 |
R: GAGACTGCCTCATGTTCCCG | ||||||
5 | 1L1B (rs1143634) | 147720 | chr2: 112832813 | F: CACTCCCAGCTTCATCCCTAC | 61 | 366 |
R: AATTAGCAAGCTGCCAGGAGG | ||||||
6 | IL1R (rs2041747) | 147810 | chr2: 102171949 | F: GGCCAGTTGAGTGACATTGC | 57 | 169 |
R: GCTTTTAAACTGAACCGACAAGGT | ||||||
7 | FAS (rs7896789) | 134637 | chr10: 89005107 | F: AAACTAGGTTGAGTGCTTTGGAG | 57 | 450 |
R: TGAATATGATGATGTGGGGAGGAC | ||||||
Statistical analysis
The comparison of interval data between the responders and nonresponders to the anti‑TNF therapy was conducted using the nonparametric Mann–Whitney test, since the data did not follow the normal distribution (assessed using the Shapiro–Wilk test). The χ2 test was used to compare nominal data, as well as to determine whether the association between the allele frequencies and the response to treatment was significant. These analyses were performed using STATISTICA 13.3 software (StatSoft Inc., Tulsa, Oklahoma, United States), and all differences were considered significant at a P value below 0.05. After selecting the gene variants that were identified as significant in terms of the percentage of particular allele distribution between the groups of responders and nonresponders to the anti‑TNF treatment, in the next step, we calculated odds ratios (ORs) to demonstrate differences in the occurrence of a particular variant between the responders and nonresponders. The analysis of concordance of the genotype distribution with the Hardy–Weinberg equilibrium and calculations of ORs with 95% CIs were performed using the online calculator of the Institute of Human Genetics in Munich, Germany (http://ihg.gsf.de/cgi‑bin/hw/hwa1.pl, accessed October 10, 2022).
Results
Clinical parameters
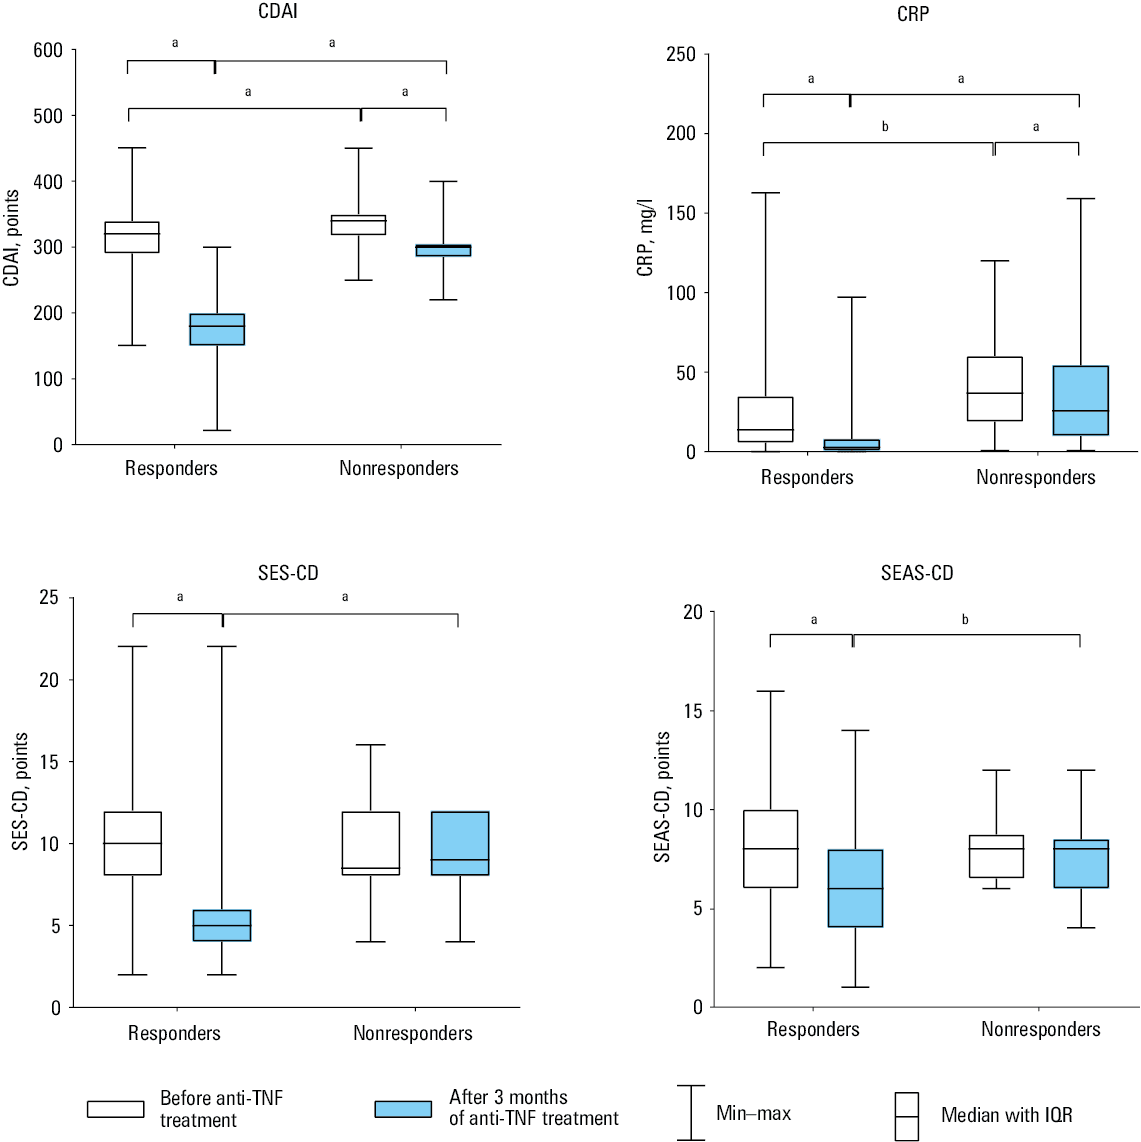
We studied 196 biologic‑naïve patients with CD. Three months after the induction of the therapy, 163 patients (83.16%) achieved a response to anti‑TNF drugs, whereas 33 patients (16.84%) did not respond to the treatment. Clinical characteristics of the patients are shown in Table 2, and the most important differences between the responders and nonresponders are illustrated in Figure 1.
Parameter | All patients (n = 196) | Responders (n = 163) | Nonresponders (n = 33) | P value | |
Data are presented as number (percentage) or median (interquartile range) unless indicated otherwise.
a Before anti‑TNF treatment
b After 3 months of anti‑TNF treatment
c Disease location and behavior were classified according to the Montreal Classification.12
Abbreviations: CDAI, Crohn Disease Activity Index; CRP, C‑reactive protein; F, female; M, male; TNF, tumor necrosis factor | |||||
Sex | F | 77 (39.29) | 62 (38.04) | 15 (45.45) | 0.43 |
M | 119 (60.71) | 101 (61.96) | 18 (54.55) | ||
Age, y, mean (SD; min–max) | 30.65 (10.58; 17–64) | 30.03 (9.77; 17–64) | 33.73 (13.64; 19–64) | 0.25 | |
Smokers | 9 (4.59) | 9 (5.52) | 0 | 0.17 | |
Previous operations | 67 (34.18) | 49 (30.06) | 18 (54.55) | 0.007 | |
CRPa, mg/l | 18.6 (6.3–40.7) | 14 (5.93–35.23) | 37 (18.95–60.4) | 0.001 | |
CRPb, mg/l | 3.95 (1.2–13.18) | 2.9 (1–8.4) | 26 (10.1–54.7) | <0.001 | |
CDAIa, points | 323 (300–344.3) | 320 (290–340) | 340 (320–350) | <0.001 | |
CDAIb, points | 190 (150–220) | 180 (150–200) | 300 (285–305) | <0.001 | |
Disease duration, mo, mean (SD; min–max) | 60.67 (60.67; 3–348) | 65.77 (74.76; 3–620) | 69.88 (65.49; 3–234) | 0.9 | |
Intestinal locationc | |||||
Ileal (L1) | 51 (26.02) | 40 (24.54) | 11 (33.33) | 0.29 | |
Colonic (L2) | 68 (34.69) | 58 (35.59) | 10 (30.3) | 0.56 | |
Ileocolonic (L3) | 77 (39.29) | 65 (39.88) | 12 (36.36) | 0.71 | |
Disease behaviorc | |||||
Nonstricturing, nonpenetrating (B1) | 113 (57.65) | 94 (57.67) | 19 (57.58) | 0.99 | |
Stricturing (B2) | 33 (16.84) | 28 (17.18) | 5 (15.15) | 0.78 | |
Penetrating (B3) | 1 (0.51) | 1 (0.61) | 0 | 0.65 | |
Perianal disease modifier (P) | 51 (26.02) | 42 (25.77) | 9 (27.27) | 0.86 | |
Medication | |||||
Mesalamine | 193 (98.47) | 161 (98.77) | 32 (96.97) | 0.44 | |
Corticosteroids | 59 (30.1) | 49 (30.06) | 10 (30.3) | 0.98 | |
Azathioprine | 111 (56.63) | 96 (58.89) | 15 (45.45) | 0.16 | |
Infliximab | 139 (70.92) | 115 (70.55) | 24 (72.73) | 0.8 | |
Adalimumab | 57 (29.08) | 48 (29.45) | 9 (27.27) | 0.8 | |
Abbreviations: IQR, interquartile range; SEAS‑CD, Simple Enterographic Activity Score for Crohn Disease; SES‑CD, Simple Endoscopic Score for Crohn Disease; others, see Table 2
In the group of responders, the values of all 4 parameters used in CD monitoring (CDAI, CRP, SES‑CD, and SEAS‑CD) decreased significantly after the induction of the therapy, as compared with the values before the therapy (P <0.001). In the group of nonresponders, we did not observe significant differences in these parameters before and after initiation of the therapy.
Genotyping results
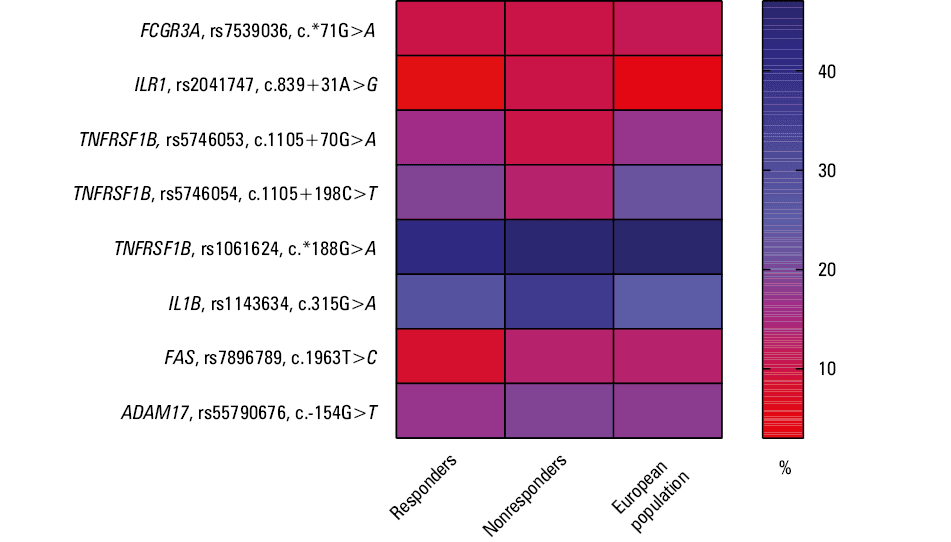
The genotype and allele frequencies for the analyzed loci are summarized in Table 3. Almost all the analyzed single nucleotide polymorphisms (SNPs) were consistent with the Hardy–Weinberg equilibrium. The only exception was the rs7896789 SNP of the FAS gene, for which we observed deviations in the group of nonresponders (P <0.001). The distribution of minor allele frequencies (MAFs) among the responders and nonresponders, and their comparison with the European population are shown in Figure 2. The nonresponders presented different patterns for the ILR1 (rs2041747) and IL1B (rs1143634) gene loci, and the responders presented different patterns for the FAS (rs7896789) gene. For the remaining loci, the MAF distribution among the responders and nonresponders was similar (value differences <5%) to that of the European population.
No | Single nucleotide polymorphism | Gene | Responders (n = 163) | Hardy–Weinberg equilibrium | Nonresponders (n = 33) | Hardy–Weinberg equilibrium | ||||||||||
Genotypes, n (%) | Alleles, n (%) | χ2 | P value | Genotypes, n (%) | Alleles, n (%) | χ2 | P value | |||||||||
11 | 12 | 22 | 1 | 2 | 11 | 12 | 22 | 1 | 2 | |||||||
1 | rs7539036 | FCGR3A | 130 (79.75) | 33 (20.25) | 0 | 293 (89.88) | 33 (10.12) | 2.0677 | 0.15 | 26 (78.79) | 7 (21.21) | 0 | 59 (89.39) | 7 (10.61) | 0.4645 | 0.5 |
2 | rs2041747 | IL1R | 152 (93.25) | 10 (6.15) | 1 (0.61) | 314 (96.32) | 12 (3.68) | 2.9627 | 0.09 | 26 (78.79) | 7 (21.21) | 0 | 59 (89.39) | 7 (10.61) | 0.4645 | 0.5 |
3 | rs5746053 | TNFRSF1B | 115 (70.55) | 43 (26.38) | 5 (3.07) | 273 (83.74) | 53 (16.26) | 0.1583 | 0.69 | 26 (78.79) | 7 (21.21) | 0 | 59 (89.39) | 7 (10.61) | 0.4645 | 0.5 |
4 | rs5746054 | 105 (64.42) | 52 (31.9) | 6 (3.68) | 262 (80.37) | 64 (19.63) | 0.0196 | 0.89 | 24 (72.73) | 9 (27.27) | 0 | 57 (86.36) | 9 (13.64) | 0.8227 | 0.36 | |
5 | rs1061624 | 31 (19.02) | 75 (46.01) | 57 (34.97) | 137 (42.02) | 189 (57.96) | 0.5062 | 0.48 | 6 (18.18) | 19 (57.58) | 8 (24.24) | 31 (46.97) | 35 (53.03) | 0.8006 | 0.37 | |
6 | rs1143634 | IL1B | 86 (52.76) | 61 (37.42) | 16 (9.82) | 233 (71.47) | 93 (28.53) | 1.1036 | 0.29 | 12 (36.36) | 18 (54.55) | 3 (9.09) | 42 (63.64) | 24 (36.36) | 1.0523 | 0.31 |
7 | rs7896789 | FAS | 137 (84.05) | 25 (15.34) | 1 (0.61) | 299 (91.72) | 27 (8.28) | 0.0148 | 0.9 | 27 (81.82) | 3 (9.09) | 3 (9.09) | 57 (86.36) | 9 (13.64) | 12.4423 | <0.001 |
8 | rs55790676 | ADAM17 | 109 (66.87) | 51 (31.29) | 3 (1.84) | 269 (82.52) | 57 (17.48) | 1.1592 | 0.28 | 21 (63.63) | 11 (33.33) | 1 (3.03) | 53 (80.3) | 13 (19.7) | 0.0952 | 0.76 |
Discussion
Due to the increasing number of biologic drugs introduced into IBD therapy, there is a growing need for research to personalize the treatment. However, studies published to date have presented equivocal results that could not help define the genetic markers of response to anti‑TNF drugs. It is known that the process of apoptosis of intestinal inflammatory cells is one of the basic mechanisms responsible for the correct elimination of these cells and, consequently, the reduction of inflammation. This process is disturbed in CD. It has been observed that T cells located in the intestinal lamina propria are resistant to apoptotic signals. On the other hand, in the pathogenesis of IBD, excessive elimination of intestinal epithelial cells occurs. As a result, the integrity of the intestinal barrier is lost and inflammation increases. It is known that both TNF itself and the receptors associated with its activity are involved in the induction of apoptotic processes in intestinal epithelial cells.13 It has been proven that, through a multidirectional mechanism of action, anti‑TNF drugs not only inhibit the activity of this cytokine, but have a much wider effect. It consists, inter alia, in influencing the apoptotic pathways. Epithelial cell apoptosis has been shown to decrease in patients treated with anti‑TNF drugs. The exact mechanism responsible for this process is not fully understood.14 On the other hand, after anti‑TNF administration, apoptosis of lamina propria T cells is increased.15
Therefore, research aimed at determining the genetic markers of apoptosis is largely directed at the receptors and cytokines involved in this process. This theory corresponds with the results of our previous studies, where we demonstrated that differences in the primary response to anti‑TNF among CD patients were associated with molecular variants in the apoptosis and inflammatory pathway genes.8 Using the NGS method in a group of 107 biologically treated patients with CD, we determined the sequences of a panel of 23 genes that may predispose to achieving a response to the anti‑TNF therapy. We showed that variants of the FCGR3A, IL1R, TNFRSF1B, IL1B, and FAS genes were associated with treatment response.8 Herein, we aimed to verify these findings in a larger group of 196 patients with CD. In our study group, there were more men than women (119 vs 77; Table 2). This reflects the observation made by Kucha et al16 in their analysis of Polish nationwide data from the years 2012–2020, that women receive biologic treatment for both CD and UC significantly less frequently than men. We assessed 5 loci identified in our previous study8 (rs7539036, rs2041747, rs5746053, rs1143634, rs7896789) in the FCGR3A, IL1R, TNFRSF1B, IL1, and FAS genes, respectively. There, we found associations with the response to treatment in 11 variants. However, the loci within the IL1B and FCGR3A genes formed 2 haploblocks in complete linkage disequilibrium (D’ = 1); hence, we were limited to choosing 1 haploblock variant (rs7539036 and rs1143634, respectively).8 Moreover, we extended the current research by including 3 additional polymorphisms that had presented borderline significance in our previous NGS analysis—rs1061624 and rs5746054 in the TNFRSF1B gene, and rs55790676 in the ADAM17 gene.8
Cytokines are responsible for the proper interaction between intestinal cells, and many IBD risk loci are found in the genes encoding proteins responsible for maintaining these cell‑to‑cell interactions.17 One of the primary proinflammatory cytokines is interleukin (IL)-1. The IL‑1 family includes 2 IL‑1 agonists (IL‑1α and IL‑1β), and a natural IL‑1 receptor antagonist (IL‑1Ra). These cytokines mainly bind to the IL‑1 type 1 receptor (IL‑1R1), resulting in cell signaling and increasing the messenger RNA (mRNA) expression of hundreds of genes in target cells. There is also a second form of the IL‑1 receptor, IL‑1 type 2 receptor (IL‑1R2). The binding of IL‑1 to this receptor does not cause signaling—it is a decoy receptor. The potent proinflammatory effects of IL‑1α and IL‑1β are limited to 3 main levels: synthesis and release, membrane receptors, and intracellular signal transduction. This pathway summarizes the extracellular and intracellular IL‑1α or IL‑1β signaling, including positive and negative feedback mechanisms that enhance or terminate the IL‑1 response. It is noteworthy that most of the intracellular components that participate in the cellular response to IL‑1 also mediate responses to other cytokines (including IL‑18 and IL‑33), toll‑like receptors, and many forms of cytotoxic stress. It has been shown that some patients have a particularly high concentration of IL‑1 in inflammatory infiltrates. Many researchers suggest that failure to respond to the anti‑TNF treatment may be associated with genetic defects in the IL‑1 pathway. There may also be a group of patients who would clinically benefit from blocking IL‑1 or IL‑1R rather than TNF.18
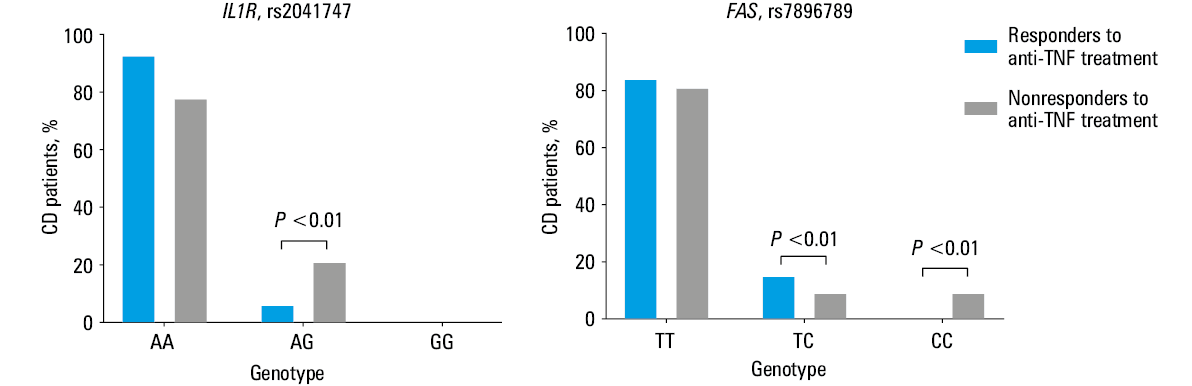
Lacruz‑Guzman et al19 described the potential pharmacogenetic role of the rs1143634 polymorphism (c.315C>T). They showed that the presence of the C allele was associated with a poorer response to infliximab treatment in CD patients, and also with a higher serum concentration of IL‑1β. In our previous publication,8 we also showed an association between the SNP of the IL1B gene and the response to the anti‑TNF treatment. We found that the T allele was more common among the nonresponders than among the responders (50% vs 28%, respectively). Additionally, the rs1071676 (c.*505G>C) polymorphism was described for the first time as a potential pharmacogenetic factor in CD. We also found an association of the other 2 variants of the IL1B gene (rs1143639 [c.597+76G>A] and rs1143637 [c.467‑334G>A]) with the treatment response. In addition, the relationship of the variant in the IL1R gene (rs2041747 [c.839+31G>A]) with anti‑TNF efficacy was first described.8 Here, we confirmed the participation of the rs2041747 variant in the response to the anti‑TNF treatment. We observed that the nonresponders had a significantly higher frequency of the G allele (P = 0.03; Table 4). The AG genotype was overrepresented in the nonresponders almost 4‑fold, as compared with the responders (Figure 3). Because the homozygous GG genotype occurred with a very low frequency (<1%; Table 3), we postulate that the G allele identified in the AG carriers may be a nonresponse risk allele. The rs2041747 variant is located in the intron region (c.839+31G>A), the function of which has not been described so far, but it should be noted that variants of this type may contribute to exon splicing.
Gene; SNP (major > minor allele) | Allele frequency difference | Heterozygous | Homozygous | Allele positivity | ||||
1 vs 2 | 2 vs 1 | 11 vs 12 | 22 vs 12 | 11 vs 22 | 22 vs 11 | 11 vs [22 + 12]; risk allele 2 | [11 + 12] vs 22; risk allele 1 | |
Data are shown as odds ratios (95% CIs). P values <0.05 were considered significant.
a Pearson goodness‑of‑fit χ2 test (df = 1)
b Fisher exact test
Abbreviations: df, degrees of freedom; SNP, single nucleotide polymorphism; 1, the first allele (major); 2, the second allele (minor); 11, the first type of homozygous genotype; 22, the second type of homozygous genotype; 12, heterozygous genotype; [11 + 12] vs 22, dominant model with risk allele 1, eg, [GG + GA] vs [AA], dominant model, risk allele: G; 11 vs [12 + 22], recessive model with risk allele 2, eg, [GG] vs [GA + AA], recessive model, risk allele A | ||||||||
FCGR3A; rs7539036 (G>A) | 1.05 (0.45–2.5) | 0.95 (0.4–2.25) | 1.06 (0.42–2.66) | 0.22 (0–12.21) | 4.93 (0.1–253.75) | 0.2 (0–10.46) | 1.06 (0.42–2.66) | 0.21 (0–10.51) |
P = 0.91a | P = 0.9 | P > 0.99 | P > 0.99 | P = 0.9 | P > 0.99 | |||
IL1R; rs2041747 (A>G) | 3.105 (1.17–8.21) | 0.322 (0.12–0.85) | 4.09 (1.43–11.71) | 2.14 (0.08–60.17) | 1.918 (0.076–48.351) | 0.52 (0.02–13.14) | 3.72 (1.32–10.47) | 0.62 (0.03–15.51) |
P = 0.03b | P = 0.005 | P = 0.41 | P = 0.68 | P = 0.009 | P = 0.65 | |||
TNFRSF1B; rs5746053 (G>A) | 0.61 (0.27–1.41) | 1.64 (0.71–3.78) | 0.72 (0.29–1.78) | 1.9 (0.1–37.98) | 0.4 (0.02–7.39) | 2.52 (0.14–47.06) | 0.65 (0.26–1.59) | 2.33 (0.13–43.06) |
P = 0.24a | P = 0.48 | P = 0.37 | P = 0.29 | P = 0.34 | P = 0.31 | |||
TNFRSF1B; rs5746054 (C>T) | 0.65 (0.3–1.37) | 1.55 (0.73–3.29) | 0.76 (0.33–1.75) | 2.35 (0.12–45.32) | 0.33 (0.02–6.08) | 3.02 (0.16–55.4) | 0.68 (0.3–1.56) | 2.77 (0.15–50.28) |
P = 0.25a | P = 0.51 | P = 0.31 | P = 0.24 | P = 0.36 | P = 0.26 | |||
TNFRSF1B; rs1061624 (G>A) | 0.82 (0.48–1.39) | 1.22 (0.72–2.08) | 1.31 (0.48–3.59) | 1.805 (0.74–4.42) | 0.73 (0.23–2.28) | 1.38 (0.44–4.33) | 1.06 (0.4–2.78) | 1.68 (0.71–3.97) |
P = 0.46a | P = 0.6 | P = 0.19 | P = 0.58 | P = 0.91 | P = 0.23 | |||
IL1B; rs1143634 (G>A) | 1.43 (0.82–2.497) | 0.7 (0.4–1.22) | 2.12 (0.95–4.71) | 1.57 (0.41–6.01) | 1.34 (0.34–5.3) | 0.74 (0.18 =9–2.94) | 1.96 (0.9–4.23) | 1.09 (0.3–3.97) |
P = 0.2a | P = 0.06 | P = 0.5 | P = 0.67 | P = 0.09 | P = 0.9 | |||
FAS; rs7896789 (T>C) | 1.88 (0.83–4.23) | 0.53 (0.24–1.2) | 0.66 (0.19–2.36) | 0.04 (0–0.56) | 15.22 (1.53–151.9) | 0.07 (0.01–0.66) | 1.27 (0.47–3.4) | 0.06 (0.01–0.62) |
P = 0.12a | P = 0.52 | P = 0.003 | P = 0.003a | P = 0.63 | P = 0.002 | |||
ADAM17; rs55790676 (G>T) | 1.16 (0.59–2.26) | 0.86 (0.44–1.69) | 1.12 (0.5–2.5) | 0.65 (0.06–6.82) | 1.73 (0.17–17.45) | 0.58 (0.06–5.83) | 1.15 (0.53–2.52) | 0.6 (0.06–5.95) |
P = 0.67a | P = 0.78 | P = 0.72 | P = 0.64 | P = 0.72 | P = 0.66 | |||
The above results are a valuable addition to the existing pharmacogenetic research. However, it should be noted that their functional aspect is still not fully known. In the previous studies conducted using intestinal mucosa biopsies of CD patients, an increase in the IL1B mRNA expression was observed in the anti‑TNF–refractory patients.20-22 In our previous investigations, we identified such a relationship especially in the samples obtained from sites of inflammation, in relation to the mucosa of healthy people.22 In contrast, the IL1R receptor gene demonstrated increased mRNA expression in the responders to the anti‑TNF treatment. When the relative expression was assessed in vitro in the cultures of peripheral blood mononuclear cells treated with anti‑TNF antibodies, a significant increase in the mRNA level of the IL1B gene was found in the control group, in contrast to both the responders and nonresponders.22 More research is needed in this area.
As mentioned above, one of the basic processes responsible for chronic inflammation is the defective process of apoptosis. The primary receptor responsible for inducing this process is the Fas receptor. It is a member of the TNFR family that contains the death domain. Its activation is carried out by the Fas ligand (FasL), and results in the activation of the effector proteins responsible for the apoptosis process: caspase 8 and adapter molecules released from cytochrome c, as well as in activation of the internal pathway. It has been shown that anti‑TNF drugs, apart from TNF inactivation, show multidirectional activity.23 It is believed that they can bind directly to FasL or indirectly affect the cells that are affected by FasL.24 In our study, we did not find any differences between the responders and nonresponders in the allele frequency of the rs7896789 variant, but we identified a significantly higher frequency of CC homozygotes in the nonresponders than in the responders (9.09% vs 0.61%). This suggests that the rs7896789 T allele in homozygotes may act as a protective allele, while the rs7896789 CC genotype may be associated with an increased susceptibility to nonresponse to anti‑TNF therapy (Figure 3). Similar observations were previously presented by Walczak et al.8
There are many studies showing that selected FASL polymorphisms are associated with the response to anti‑TNF drugs. Netz et al25 reported that the FASL CC genotype was 4 times more common in the nonresponders, as compared with the TC or TT genotype (OR, 4.3; 95% CI, 1.45–12.8; P = 0.009). They also studied the frequency of the rs763110 variant of the FASL gene and the rs1800629 variant of the TNF gene, and showed that a combination of FASL CC genotype and the TNF A allele was significantly more frequent in the nonresponders than in the responders to the anti‑TNF therapy (OR, 4.76; 95% CI, 1.35–16.77; P = 0.015). Hlavaty et al26 showed that the CC and CT genotypes of the FASLG gene in locus c.–843 (rs763110) were significantly associated with better response in the subgroup of patients with both luminal and fistulizing CD. Overall, 75% (n = 135) of the luminal CD patients with FASLG –843 CC and CT genotypes and 38% (n = 21) of the homozygous TT individuals responded to the treatment (OR, 0.11; 95% CI, 0.08–0.56; P = 0.002). In the cohort of fistulizing CD patients, genotype –843 CC/CT was the sole predictor of response (OR, 1.66; 95% CI, 1.21–2.29; P = 0.002). As mentioned earlier, FasL is the key protein of the death effector domain protein family, responsible for apoptosis induction. The FASLG gene c.–834C>T polymorphism occurs in the promoter region at the CAAT binding site of the enhancer protein. In the case of the C allele, the affinity of the protein to the binding site increases 3‑fold and is associated with a 3‑fold higher expression level of FASLG.
Our research did not include the FASLG gene polymorphism. However, we showed the contribution of the FAS receptor gene variant in the anti‑TNF treatment effect. This supports the hypothesis that the involvement of the FasL–Fas receptor–induced apoptosis pathway may play a role in the response to anti‑TNF drugs in CD patients. We did not confirm the contribution of the other studied polymorphisms to the anti‑TNF response. In our study, the groups of responders and nonresponders did not differ in the disease behavior. Therefore, there must be other factors responsible for achieving a response to the treatment. CD is a complex disease in terms of both behavior and immunological processes occurring in inflammatory infiltrates. Therefore, the drug response processes are undoubtedly complex.
Study limitations and strengths
In our study, we did not measure the concentrations of antidrug antibodies. Our observations concerned the response to the therapy in the patients undergoing induction. These were patients who had not previously received anti‑TNF preparations. Therefore, according to the recommendations, there was no need to assess the antibody level. In this group of patients, the response to the treatment is unaffected by anti‑TNF drug concentrations and antibodies, for which the therapy induction period is too short. Most likely, other factors, including genetic ones, are responsible for the therapeutic effect. Another limitation of our study is the relatively small number of patients. However, it should be noted that these investigations are a continuation of a previous study8 in which, based on the analysis of gene polymorphisms using the NGS method, we identified variants that may be responsible for the response to anti‑TNF drugs. Our current study focused solely on the preselected genetic factors, while including a much larger number of patients. It is also a continuation of our expression‑level research concerning individual genes in vitro and in vivo.22The formerly obtained results showed differences in the expression of these genes in particular groups of patients. It could not be ruled out that the variants we described influence this observation.
The strength of the presented investigation is an ethnically homogeneous patient group, similar in terms of the disease behavior and activity. These features, especially in genetic research, are of great importance. Our study is the first one conducted in Poland in this field.
Conclusions
Our results suggest that the response to the anti‑TNF therapy in CD patients is characterized by complex pathways, including multigene conditioning combined with the actual immunological status of the body, as well as mucosal and environmental factors. Among the genetic factors, the genes involved in apoptosis, FAS and ILR1, seem to play an important role in the lack of response to the treatment, but their exact functional characterization requires further research.
- Medler J, Wajant H. Tumor necrosis factor receptor‑2 (TNFR2): an overview of an emerging drug target. Expert Opin Ther Targets. 2019; 23: 295‑307. | Crossref
- Morita C, Horiuchi T, Tsukamoto H, et al. Association of tumor necrosis factor receptor type II polymorphism 196R with systemic lupus erythematosus in the Japanese: molecular and functional analysis. Arthritis Rheum. 2001; 44: 2819‑2827. | Crossref
- Constantin A, Dieudé P, Lauwers‑Cancès V, et al. Tumor necrosis factor receptor II gene polymorphism and severity of rheumatoid arthritis. Arthritis Rheum. 2004; 50: 742‑747. | Crossref
- Zhang R, Xu Y, Ekman N, et al. Etk/Bmx transactivates vascular endothelial growth factor 2 and recruits phosphatidylinositol 3‑kinase to mediate the tumor necrosis factor‑induced angiogenic pathway. J Biol Chem. 2003; 278: 51267‑51276. | Crossref
- Fischer R, Wajant H, Kontermann R, et al. Astrocyte‑specific activation of TNFR2 promotes oligodendrocyte maturation by secretion of leukemia inhibitory factor. Glia. 2014; 62: 272‑283. | Crossref
ARTICLE INFORMATION