Influence of diabetes mellitus on the invasive assessment of myocardial ischemia in patients with coronary artery disease
Key words: discordance, fractional flow reserve, instantaneous wave-free ratio, intermediate coronary lesions, resting full-cycle ratio


 CC BY-NC-SA 4.0
Influence of diabetes mellitus on the invasive assessment of myocardial ischemia in patients with coronary artery disease
Introduction: Current guidelines recommend physiological evaluation of borderline coronary artery stenoses using hyperemic (fractional flow reserve [FFR]) and nonhyperemic (instantaneous wave‑free ratio [iFR] and resting full‑cycle ratio [RFR]) methods. However, comorbidities, such as diabetes mellitus (DM), may influence the results of the assessment.
Objectives: We sought to investigate the impact of DM and insulin treatment on the discordance between FFR and iFR/RFR.
Patients and methods: A total of 417 intermediate stenoses in 381 patients underwent FFR and iFR/RFR assessment. FFR lower than or equal to 0.8 and iFR/RFR lower than or equal to 0.89 indicated significant ischemia. The patients were categorized based on DM diagnosis and insulin treatment status.
Results: Of the 381 patients, 154 (40.4%) had DM. Among these, 58 patients (37.7%) received insulin treatment. Diabetic patients had higher body mass index and glycated hemoglobin levels, and lower ejection fraction. FFR and iFR/RFR analyses were conducted in 417 vessels with available measurements for both tests. A good correlation between FFR and iFR/RFR was confirmed in both diabetic (R = 0.77) and nondiabetic (R = 0.74) patients. Discordance between FFR and iFR/RFR occurred in approximately 20% of cases, and the frequency of discordance was not affected by the diabetic status. However, insulin‑treated DM was independently associated with a higher risk of negative FFR and positive iFR/RFR discordance (odds ratio, 4.61; 95% CI, 1.38–15.4; P = 0.01). Also, the optimal cutoff value for FFR identifying significant ischemia in DM patients treated with insulin was higher (0.84) than the generally recommended value.
Conclusions: The rate of FFR and iFR/FFR discordance was similar regardless of the diabetes status, and insulin‑treated DM was associated with an increased risk of negative FFR and positive iFR/RFR discordance.
What's new?
We evaluated the impact of diabetic status on the diagnostic accuracy of hyperemic (fractional flow reserve [FFR]) and nonhyperemic (instantaneous wave‑free ratio [iFR] / resting full‑cycle ratio [RFR]) methods of physiological assessment of borderline coronary artery stenoses. In a group of 381 patients (417 intermediate coronary lesions as assessed on angiography), we observed a good agreement between FFR and iFR/RFR in diabetic and nondiabetic patients. However, insulin‑treated diabetes mellitus emerged as an independent predictor of the negative FFR–positive iFR/RFR discrepancy. Furthermore, the optimal FFR threshold for identifying significant ischemia (iFR ≤0.89) in insulin‑treated diabetic patients was higher than the generally recommended threshold (0.84 vs 0.8). These insights are crucial for interpreting the clinical relevance of FFR results in patients with insulin‑treated diabetes mellitus.
Introduction
Physiological assessment of coronary artery disease using fractional flow reserve (FFR), instantaneous wave‑free ratio (iFR), and resting full‑cycle ratio (RFR) has become the standard method for evaluating the functional significance of coronary artery lesions.1-4 Notably, its use is recommended for revascularization decision‑making in intermediate‑grade stenoses of 50% to 90% on angiography.1,3,5 High correlation and consistency are noted between the results of these methods.4,6-8 However, discordant results between FFR and iFR/RFR might be observed in about 20% of cases.4,9-16 Thus, numerous efforts have been made to establish the mechanisms of and identify factors that lead to such a discrepancy.4,17 Several clinical, angiographic, and hemodynamic predictors of differences between FFR and iFR/RFR, including sex, age, coronary artery stenosis location, atrial fibrillation (AF), elevated left ventricular end‑diastolic pressure, and diastolic dysfunction, were identified.4,9,11-14 Additionally, discordance due to coronary artery microcirculation dysfunction in patients with diabetes mellitus (DM) and / or chronic renal disease was suggested.9,11,14,17 However, the reliability of FFR and iFR/RFR assessment in patients with DM is incompletely explored, especially regarding the possible effects of insulin treatment and glycemic control. Thus, we sought to investigate the impact of DM and concomitant treatment on the discordance between the methods of invasive assessment of myocardial ischemia.
Patients and methods
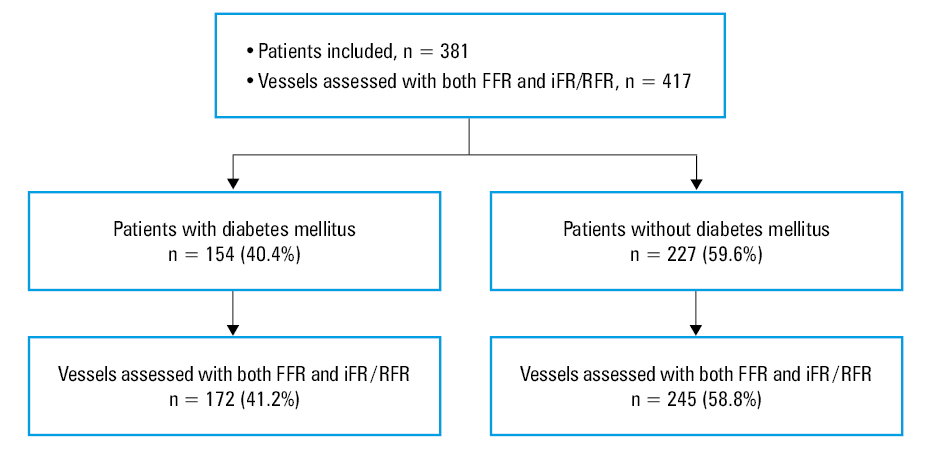
The main results of our study have been published previously.14 The study was conducted at the Clinical Department of Cardiology and Cardiovascular Interventions of the University Hospital in Kraków, Poland. Data on all consecutive patients with chronic coronary syndrome who underwent invasive physiological assessments between January 2020 and December 2021 (24 months) were reviewed retrospectively. The patients were included in the study regardless of the number of vessels assessed and the technique used. Finally, we analyzed 381 patients who underwent coronary angiography and in whom hemodynamic significance of borderline atherosclerotic stenoses (lesions with 50%–90% diameter stenosis by visual assessment) in the coronary arteries was physiologically assessed (Figure 1). The patients were divided into 2 groups depending on the presence of DM. The participants with DM were further stratified based on insulin treatment. No data concerning the type of diabetes (type 1 or 2), duration of symptoms, and type and dose of oral hypoglycemic drugs were collected.
Abbreviations: FFR, fractional flow reserve; iFR, instantaneous wave‑free ratio; RFR, resting full‑cycle ratio
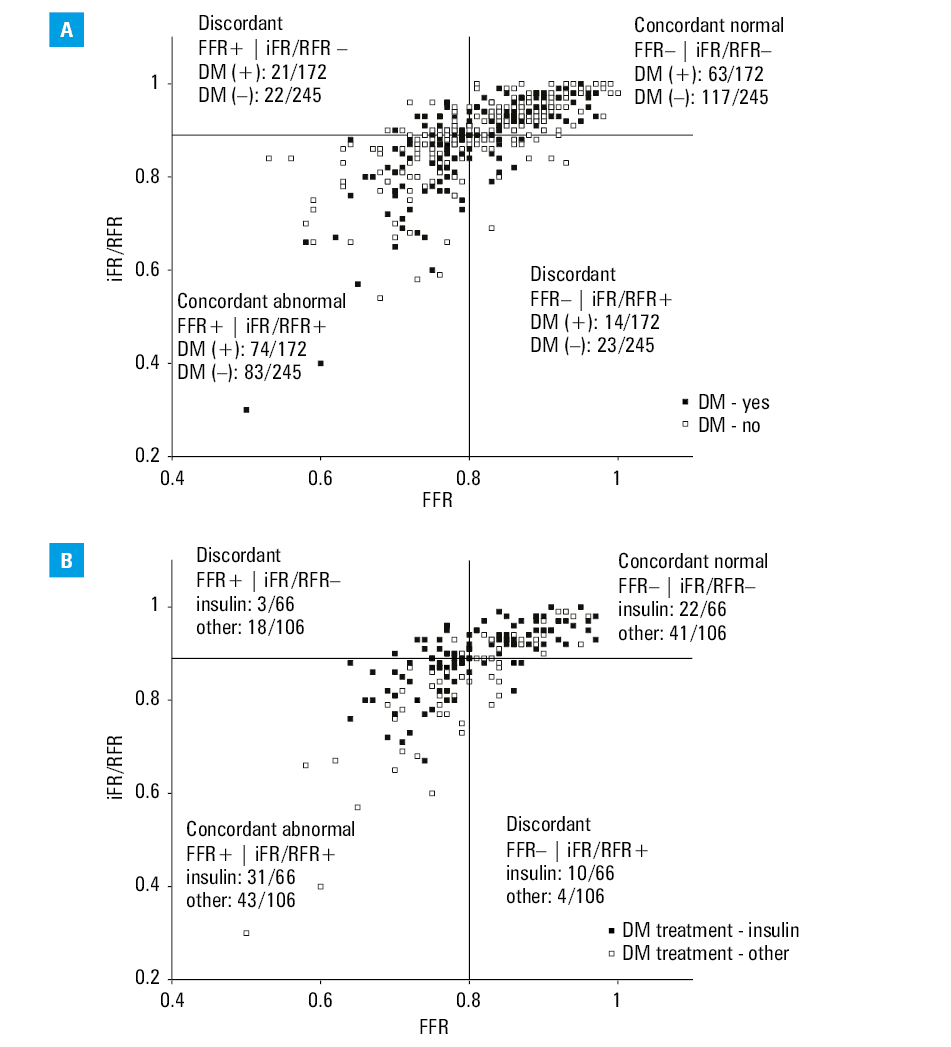
Experienced operators performed all procedures according to a standardized protocol.18 The standard radial or femoral approach was used based on individual operator’s preference. During the same procedure, hemodynamic significance of stenosis was assessed with both FFR and a nonhyperemic method. For the FFR measurement, an intracoronary bolus of adenosine of 100 to 400 µg was administered. Depending on the operator’s preference and device availability, either iFR or RFR was used for the nonhyperemic assessment. The mean value of 3 measurements was analyzed. iFR was calculated by diving distal pressure (Pd) by aortic pressure (Pa) calculated during the wave‑free period in diastole using automated software (Philips Volcano Corporation, San Diego, California, United States). RFR was derived from 4 to 5 consecutive cardiac cycles by calculating the minimum Pd/Pa ratio within the cardiac cycle after smoothing the instantaneous Pd/Pa trace using dedicated software (Abbott Vascular, Santa Clara, California, United States). Pressure wire pullback was mandatory to exclude possible pressure drift. As both nonhyperemic methods are considered mathematically analogous,3,4,19 the iFR and RFR results were combined. The values equal to or lower than 0.8 for FFR and equal to or lower than 0.89 for iFR/RFR were considered positive for ischemia. For 417 vessels, measurements for both FFR and iFR/RFR were available, and based on the FFR and iFR/RFR results, 4 subgroups were distinguished: negative FFR and negative iFR/RFR results (FFR– | iFR/RFR–); negative FFR and positive iFR/RFR results (FFR– | iFR/RFR+); positive FFR and negative iFR/RFR results (FFR+ | iFR/RFR–); and positive FFR and positive iFR/RFR results (FFR+ | iFR/RFR+). Additional analyses were conducted separately for lesions within the left anterior descending artery (LAD) and non‑LAD arteries (diagonal branch, circumflex artery, marginal branch, right coronary artery). Lesions within the left main coronary artery were not evaluated in this study. For each of the 381 patients, at least 1 vessel was included in the FFR vs iFR/RFR analysis.
Ethics approval (1072.6120.257.2022) was granted by the institutional ethics board of the Jagiellonian University Medical College for this retrospective registry study.
Statistical analysis
Categorical variables are presented as numbers and percentages. Continuous variables are expressed as mean with SD or median with interquartile range. The normality of distribution of continuous variables was assessed using the Shapiro–Wilk test. Differences between the groups were compared using the t test for the normally distributed variables and the Wilcoxon rank sum test for the non‑normally distributed continuous variables. Categorical variables were compared by the Pearson χ2 test. Receiver operating characteristic (ROC) curves were created to assess the optimal cutoff values of FFR for predicting iFR/RFR ≤0.89 and of iFR/RFR for predicting FFR ≤0.8. The optimal cutoff values were established by maximizing the Youden index. The correlation between FFR and iFR/RFR was tested using the Spearman correlation coefficient. The multivariable logistic regression model included factors identified in the stepwise regression model with a P value threshold (0.25 to enter, 0.1 to leave). All baseline characteristics and lesion locations (LAD vs non‑LAD) were considered possible covariates. Separate models were constructed for FFR– | iFR/RFR+, FFR+ | iFR/RFR–, and any type of discordance. The results were presented as odds ratios (OR) with 95% CIs. Two‑sided P values below 0.05 were considered significant. All calculations were performed with JMP, version 16.1.0 (SAS Institute Inc., Cary, North Carolina, United States).
Results
We collected data on 381 patients, in whom 599 vessels were assessed by either FFR and / or iFR/RFR. Of those, 154 (40.4%) had DM. Among the diabetic patients, 58 (37.7%) were treated with insulin. The patients with DM tended to be older and more likely to have AF and arterial hypertension than the nondiabetic individuals (Table 1). In addition, a significantly higher body mass index resulting from higher body weight was noted in the diabetic patients. Median left ventricular ejection fraction was lower in the patients with than those without DM, and it was even lower in the diabetic patients treated with insulin than in those treated with other drugs. Significant differences in glycated hemoglobin (HbA1c) levels between the groups were observed (Table 1).
Parameter | DM | P value | DM treatment | P value | ||
Yes (n = 154) | No (n = 227) | Insulin (n = 58) | Other (n = 96) | |||
Abbreviations: BMI, body mass index; CABG, coronary artery bypass grafting; COPD, chronic obstructive pulmonary disease; DM, diabetes mellitus; eGFR, estimated glomerular filtration rate; HbA1c, glycated hemoglobin; IQR, interquartile range; LVEF, left ventricular ejection fraction; MI, myocardial infarction; PAD, peripheral arterial disease; PCI, percutaneous coronary intervention; TIA, transient ischemic attack | ||||||
Women, n (%) | 39 (25.3) | 53 (23.3) | 0.66 | 10 (17.2) | 29 (30.2) | 0.07 |
Age, y, mean (SD) | 68.9 (9.5) | 66.9 (10.6) | 0.06 | 70.0 (9.1) | 68.1 (9.8) | 0.23 |
Height, cm, median (IQR) | 171 (166–176) | 170 (165–176) | 0.99 | 173 (170–178) | 170 (164–175) | 0.01 |
Weight, kg, median (IQR) | 87 (78–98) | 83 (70–91) | <0.001 | 90 (80–98) | 85 (76–96) | 0.13 |
BMI, kg/m2, median (IQR) | 30.1 (26.9–33.1) | 27.8 (24.5–30.7) | <0.001 | 30.4 (26.9–33.1) | 29.7 (26.6–33.1) | 0.76 |
Arterial hypertension, n (%) | 139 (90.9) | 192 (84.6) | 0.07 | 55 (94.8) | 84 (88.4) | 0.18 |
Atrial fibrillation, n (%) | 37 (24) | 38 (16.8) | 0.08 | 14 (24.1) | 32 (24) | 0.98 |
Previous MI, n (%) | 75 (48.7) | 103 (45.4) | 0.52 | 29 (50) | 46 (47.9) | 0.8 |
Previous PCI, n (%) | 84 (54.6) | 112 (49.3) | 0.32 | 30 (51.7) | 54 (56.3) | 0.59 |
Previous CABG, n (%) | 7 (4.6) | 7 (3.1) | 0.45 | 2 (3.5) | 5 (5.2) | 0.62 |
PAD, n (%) | 25 (16.3) | 28 (12.3) | 0.27 | 11 (19.3) | 14 (14.6) | 0.46 |
Current smoker, n (%) | 76 (49.4) | 114 (50.2) | 0.87 | 28 (48.3) | 48 (50) | 0.84 |
COPD, n (%) | 14 (9.2) | 13 (5.7) | 0.2 | 7 (12.3) | 7 (7.3) | 0.31 |
Previous stroke / TIA, n (%) | 14 (9.2) | 21 (9.3) | 0.97 | 5 (8.8) | 9 (9.4) | 0.88 |
Dyslipidemia, n (%) | 119 (77.3) | 174 (76.7) | 0.89 | 42 (72.4) | 76 (79.2) | 0.28 |
eGFR, ml/min/1.73 m2, mean (SD) | 73.8 (25.8) | 78.3 (26.1) | 0.1 | 73.8 (27.3) | 73.8 (25.1) | 0.99 |
HbA1c, %, median (IQR) | 7.8 (6.3–9.4) | 6.0 (5.5–6.2) | <0.001 | 8.6 (7.4–10.1) | 6.4 (5.9–8.5) | 0.007 |
LVEF, %, median (IQR) | 50 (37–60) | 55 (40–60) | 0.04 | 45 (30–55) | 50 (40.5–60) | 0.02 |
Radial access, n (%) | 127 (82.5) | 186 (81.9) | 0.9 | 45 (77.6) | 82 (85.4) | 0.22 |
The analysis of FFR and iFR/RFR was limited to 417 vessels, for which the results of both measurements were available. Among them, 172 vessels (41.2%) were assessed in patients with DM, and 245 vessels (58.8%) in the individuals without the disease. In the DM patients treated with insulin, 66 vessels (37.9%) were evaluated (Figure 1). The distribution of FFR and iFR/RFR values in the study groups is presented in Figure 2. There was a strong positive correlation between FFR and iFR/RFR in both diabetic (R = 0.77; P <0.001) and nondiabetic patients (R = 0.74; P <0.001). Similarly, a strong positive correlation was noted in the diabetic patients treated with insulin (R = 0.85; P <0.001) and those treated with other hypoglycemic drugs (R = 0.74; P <0.001). The frequency of FFR lower than or equal to 0.8, indicating significant ischemia, was more common in the patients with DM than in those without the disease (Table 2). However, no difference in the median FFR was observed between the groups. On the contrary, no difference in the frequency of iFR/RFR lower than or equal to 0.89 was noted, but the median iFR/RFR was lower in the diabetic patients. In the analysis limited to the lesions found in LAD, positive results of both FFR and iFR/RFR were more common in the patients with DM than in the nondiabetic individuals. No such relationship was observed for the non‑LAD lesions. Additionally, iFR/RFR lower than or equal to 0.89 was more frequent in the patients treated with insulin than in those receiving other drugs when all vessels were analyzed (Table 2). A similar relationship was confirmed for the LAD lesions, but only a trend was observed for the non‑LAD lesions. No such association was confirmed for FFR measurements.
Parameter | DM | P value | DM treatment | P value | ||
Yes (n = 172) | No (n = 245) | Insulin (n = 66) | Other (n = 106) | |||
Vessel assessed | ||||||
LAD, n (%) | 99 (57.6) | 150 (61.2) | 0.45 | 36 (54.6) | 63 (59.4) | 0.53 |
non‑LAD, n (%) | 73 (42.4) | 95 (38.8) | 30 (45.5) | 43 (40.6) | ||
All vessels | ||||||
FFR ≤0.8, n (%) | 95 (55.2) | 105 (42.9) | 0.01 | 34 (51.5) | 61 (57.6) | 0.44 |
FFR, median (IQR) | 0.79 (0.75–0.86) | 0.83 (0.76–0.88) | 0.05 | 0.8 (0.75–0.86) | 0.79 (0.75–0.86) | 0.88 |
iFR/RFR ≤0.89, n (%) | 88 (51.2) | 106 (43.3) | 0.11 | 41 (62.1) | 47 (44.3) | 0.02 |
iFR/RFR, median (IQR) | 0.89 (0.82–0.93) | 0.9 (0.87–0.95) | 0.02 | 0.87 (0.79–0.93) | 0.90 (0.86–0.94) | 0.005 |
LAD | ||||||
FFR ≤0.8, n (%) | 70 (70.7) | 79 (52.7) | 0.005 | 24 (66.7) | 46 (73) | 0.5 |
FFR, median (IQR) | 0.77 (0.72–0.83) | 0.8 (0.75–0.85) | 0.03 | 0.77 (0.71–0.83) | 0.78 (0.73–0.84) | 0.54 |
iFR/RFR ≤0.89, n (%) | 65 (65.7) | 80 (53.3) | 0.05 | 28 (77.8) | 37 (58.7) | 0.06 |
iFR/RFR, median (IQR) | 0.88 (0.81–0.91) | 0.89 (0.86–0.93) | 0.008 | 0.84 (0.77–0.89) | 0.89 (0.84–0.92) | 0.01 |
Non‑LAD | ||||||
FFR ≤0.8, n (%) | 25 (34.3) | 26 (27.4) | 0.34 | 10 (33.3) | 15 (34.9) | 0.89 |
FFR, median (IQR) | 0.84 (0.78–0.9) | 0.87 (0.8–0.91) | 0.14 | 0.84 (0.79–0.9) | 0.84 (0.77–0.89) | 0.83 |
iFR/RFR ≤0.89, n (%) | 23 (31.5) | 26 (27.4) | 0.56 | 13 (43.3) | 10 (23.3) | 0.07 |
iFR/RFR, median (IQR) | 0.93 (0.87–0.97) | 0.94 (0.89–0.98) | 0.15 | 0.91 (0.81–0.95) | 0.95 (0.9–0.97) | 0.04 |
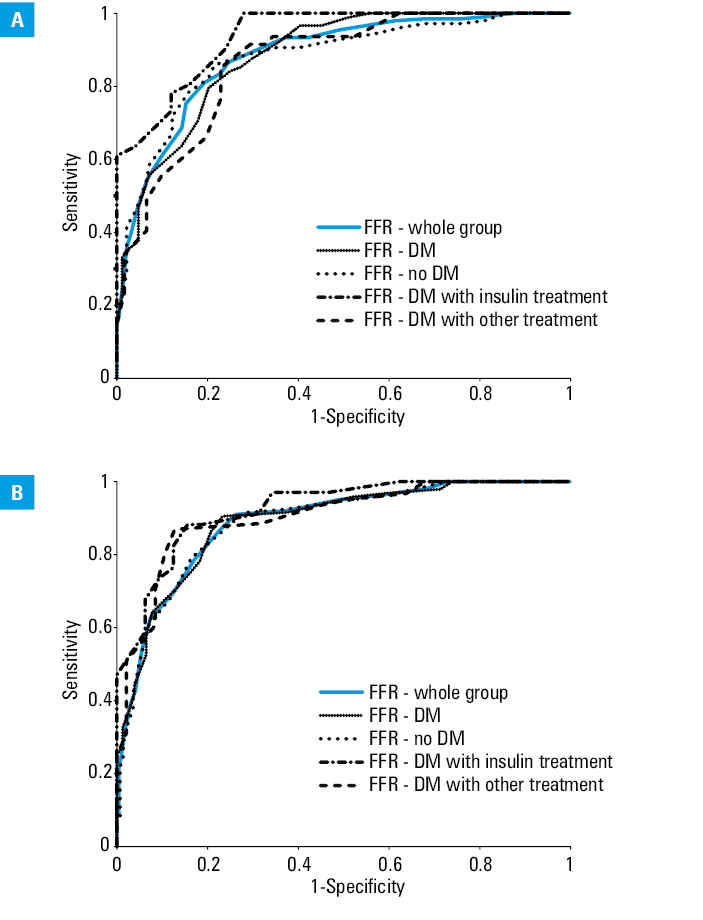
ROC analysis for patients with DM treated with insulin indicated the optimal cutoff point for FFR of 0.84 to identify individuals with iFR/RFR lower than or equal to 0.89. Moreover, the optimal cutoff point for distinguishing groups with FFR lower than or equal to 0.8 for iFR/RFR was 0.87 (Table 3, Figure 3).
Parameter | Optimal cutoff point | AUC (95% CI) | P value |
iFR/RFR to predict FFR ≤0.8 | |||
Whole group | 0.91 | 0.89 (0.86–0.92) | <0.001 |
DM (+) | 0.91 | 0.89 (0.84–0.94) | <0.001 |
DM (–) | 0.91 | 0.89 (0.85–0.93) | <0.001 |
DM (+) treated with insulin | 0.87 | 0.93 (0.86–0.99) | <0.001 |
DM (+) treated with other drugs | 0.91 | 0.9 (0.84–0.96) | <0.001 |
FFR to predict iFR/RFR ≤0.89 | |||
Whole group | 0.82 | 0.88 (0.85–0.91) | <0.001 |
DM (+) | 0.79 | 0.88 (0.83–0.93) | <0.001 |
DM (–) | 0.82 | 0.88 (0.83–0.92) | <0.001 |
DM (+) treated with insulin | 0.84 | 0.94 (0.89–0.99) | <0.001 |
DM (+) treated with other drugs | 0.79 | 0.86 (0.79–0.93) | <0.001 |
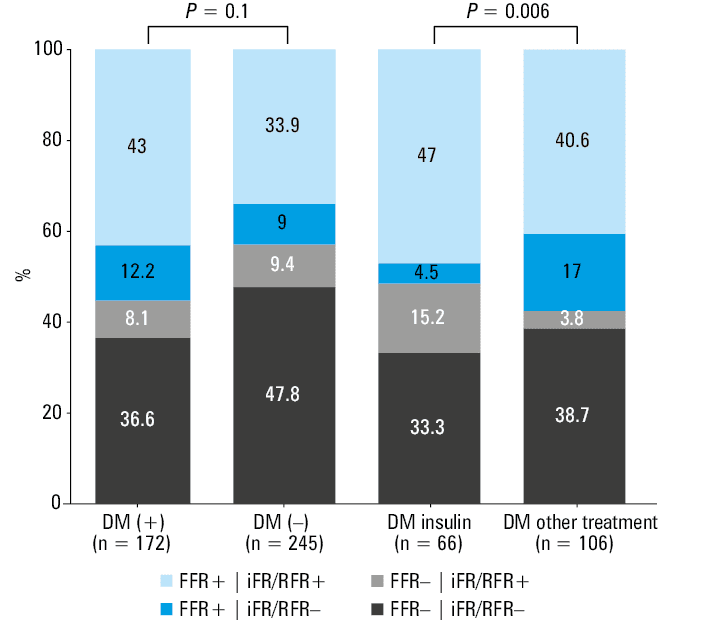
The frequency of the overall discordance between the FFR and iFR/RFR was comparable between the patients with and without DM (20.4% vs 18.4%; P = 0.61). Similarly, no difference between the diabetic patients treated with insulin and those treated with other drugs was observed (19.7% vs 20.4%; P = 0.91). No difference in the type of discordance was noted between the patients with and without DM; however, the FFR– | iFR/RFR+ discordance was more common among the diabetic patients treated with insulin than among those treated with other drugs (Figure 4).
In the multivariable logistic regression models, insulin‑treated DM was the only independent predictor of the FFR– | iFR/RFR+ discordance (OR, 4.61; 95% CI, 1.38–15.4; P = 0.01), whereas age (per 1 year) was the only predictor of the FFR+ | iFR/RFR– discordance (OR, 0.96; 95% CI, 0.93–0.99; P = 0.02). AF was independently associated with any type of discordance (OR, 1.9; 95% CI, 1.02–3.51; P = 0.04).
Discussion
Our major finding is that the results of the FFR and iFR/RFR assessment of intermediate coronary stenoses correlate well in diabetic and nondiabetic patients. Notably, the DEFINE‑FLAIR20 study confirmed that patients with DM have a higher risk of major adverse cardiovascular events than nondiabetic individuals, even after invasive assessment of borderline coronary artery lesions. The study also showed that both FFR and iFR are equally effective in guiding decision‑making about revascularization deferral in diabetic patients. However, DM, among several other clinical and angiographic factors, is considered a predictor of discordant results between FFR and iFR/RFR.9,11,16 In our study, the percentage of patients with discordant results obtained using both methods ranged from 18.4% to 20.4%, which is in line with previous findings.
Several possible mechanisms link DM to FFR and iFR/RFR discordance. Firstly, the disease leads to damage in the microcirculation in the heart and other organs, such as the eyes, kidneys, and brain. More importantly, chronic hyperglycemia is associated with a significant reduction in both endothelial‑dependent and endothelial‑independent coronary vasodilator function.16,17 This might be particularly pronounced in patients with poorly controlled DM. Niewiera et al21 found that coronary flow reserve values were significantly lower in poorly controlled DM, suggesting an association between microcirculation disorders and poor glycemic control. FFR measurement requires maximal dilation of microvascular vessels in response to drug administration.3,17 Thus, impaired vasodilatory response caused by coronary microvascular dysfunction may affect the reliability of FFR.16,17 Importantly, in the study by Legutko et al,15 microvascular dysfunction was a major determinant of FFR and RFR discordance, whereas DM was not identified as an independent predictor of discordance. However, in that study, the occurrence of any type of discordance was assessed. On the contrary, DM might be particularly relevant for the FFR– | iFR/RFR+ discordance,4,14 which suggests that the risk of false‑negative FFR results should be carefully considered in such patients. Our findings did not confirm these assumptions, as there was no significant relationship between DM and any type of discordance. Only insulin‑treated DM was found to be an independent predictor of the FFR– | iFR/RFR+ discordance, suggesting that diabetes severity and treatment type are significant factors for FFR and iFR/RFR results. These findings are in line with the results of the study by Niewiara et al,21 in which poor glycemic control assessed with fasting glucose levels was associated with microcirculation disorders and potentially impaired vasodilatory response. In contrast, no relationship between glycemic control, defined based on HbA1c levels, and coronary microvascular dysfunction was confirmed in the work by Valenzuela‑Garcia et al.22 In our study, no relationship between HbA1c, fasting glucose levels, and the risk of a FFR and iFR/RFR discrepancy was observed. Thus, we considered insulin treatment a marker of more advanced DM. However, currently, sodium‑glucose cotransporter 2 inhibitors (SGLT2is) and glucagon‑like peptide 1 receptor agonists (GLP‑1 RAs) are more common in the treatment of DM than insulin.23-25 Interestingly, dapagliflozin, an SGLT2i, has been shown to improve endothelial function26 and coronary microvascular dysfunction.27 The impact of these drugs on FFR and iFR/RFR results, however, remains unknown. Of course, as the 95% CI for insulin‑treated DM in the multivariable model was wide, the influence of chance cannot be excluded.
Another explanation for the association between DM and FFR and iFR/RFR discordance in the previous studies might be the differences in sex, age, and comorbidities between the patients with and without DM. One of the late complications of DM is kidney damage, which often results in a reduced estimated glomerular filtration rate.17 Similarly to diabetic patients, FFR measurements in patients with chronic kidney disease may not accurately reflect the level of ischemia. The FREAK study28 identified a higher percentage of negative FFR results in patients with renal impairment, potentially due to the microvascular impairment observed in those patients. Importantly, DM and chronic kidney disease are associated with a higher coronary plaque burden and more diffuse atherosclerosis.29-31 In addition, in patients with DM complicated by chronic kidney disease, a higher level of calcifications may affect coronary blood flow and exacerbate the hyperemic response. It has been shown that not only the location of the lesion but also the pattern of coronary disease (focal vs diffuse), lesion length, reference vessel diameter, and stenosis severity are associated with the discordance between FFR and iFR/RFR.17,29 However, due to the lack of quantitative coronary angiography data, we could not thoroughly analyze the effect of the type of coronary lesions on the discrepancies between FFR and iFR/RFR. In our cohort, AF was the only independent predictor of the overall FFR and iFR/RFR discordance.14 The increased likelihood of FFR and iFR/RFR discordance may be attributed to increased beat‑to‑beat variability of individual iFR measurements in patients with AF, as compared with individuals with sinus rhythm.32 This may reduce iFR reproducibility in patients with AF and lead to increased lesion reclassification. Importantly, AF is common among diabetic patients.
The established cutoff values for FFR (≤0.8) and iFR/RFR (≤0.89) may not be suitable for all patients, especially those with microcirculatory disorders.4,17 In our study, a value of 0.84 for FFR was optimal for identifying significant ischemia in patients with DM treated with insulin. Consequently, in these patients, borderline FFR values between 0.8 and 0.84 may still suggest significant ischemia warranting revascularization. Therefore, relying on positive iFR results appears more prudent for decision‑making in patients with potential microcirculation disorders, such as those with poorly controlled DM. Nevertheless, further studies should confirm these findings.
Limitations
Several limitations of this study deserve consideration. First, the sample size was relatively small. Second, the study lacked a noninvasive assessment of myocardial ischemia, which could have served as an additional reference technique. Third, there were no data on coronary flow reserve, concomitant valvular heart disease, and central venous pressure. Fourth, as FFR values achieved with intracoronary boluses of adenosine are similar but not identical to those obtained using intravenous adenosine administration,18 our findings may not apply to patients in whom intravenous adenosine infusion was used to induce hyperemia. Fifth, the impact of differences in iFR and RFR calculation algorithms on the occurrence of discrepancy cannot be ruled out. However, the RE‑VALIDATE RFR study33 and a study by Kawase et al34 confirmed an excellent agreement of RFR with iFR and FFR, with large differences being rare and not leading to vessel reclassification. In fact, some differences are also expected in FFR values derived from different systems / pressure wires used in the study.34 Sixth, the quantitative coronary angiography analysis and the extent of coronary artery disease were not assessed. The long‑term follow‑up for clinical end points was not conducted. Lastly, information on concomitant pharmacotherapy, particularly SGLT2is and GLP‑1 RAs, was unavailable.
Conclusions
In routine clinical settings, FFR and iFR/FFR discordance was common, and occurred at a similar frequency regardless of the diabetic status. Insulin‑treated DM was associated with an increased risk of negative FFR and positive iFR/RFR discordance.
- Knuuti J, Wijns W, Saraste A, et al. 2019 ESC Guidelines for the diagnosis and management of chronic coronary syndromes. Eur Heart J. 2020; 41: 407‑477.
- Siudak Z, Bartus S, Hawranek M, et al. Interventional cardiology in Poland in 2021. Annual summary report of the Association of Cardiovascular Interventions of the Polish Cardiac Society (AISN PTK) and Jagiellonian University Medical College. Adv Interv Cardiol. 2022; 18: 87‑89. | Crossref
- Kogame N, Ono M, Kawashima H, et al. The impact of coronary physiology on contemporary clinical decision making. JACC Cardiovasc Interv. 2020; 13: 1617‑1638. | Crossref
- Michail M, Thakur U, Mehta O, et al. Non‑hyperaemic pressure ratios to guide percutaneous coronary intervention. Open Heart. 2020; 7: e001308. | Crossref
- Rodriguez‑Padial L, Moreu Burgos J, Barderas MG. Coronary flow reserve in degenerative aortic stenosis and diabetes mellitus: an intriguing question. Kardiol Pol. 2022; 80: 1187‑1189. | Crossref
ARTICLE INFORMATION