Diuretic, natriuretic, and chloride-regaining effects of oral acetazolamide as an add-on therapy for acute heart failure with volume overload: a single-center, prospective, randomized study
Key words: acetazolamide, congestion, heart failure, natriuresis, renal biomarkers


 CC BY-NC-SA 4.0
Diuretic, natriuretic, and chloride-regaining effects of oral acetazolamide as an add-on therapy for acute heart failure with volume overload: a single-center, prospective, randomized study
Introduction: Decongestion is a therapeutic target in acute heart failure (AHF). Acetazolamide is a diuretic that decreases proximal tubular sodium reabsorption, and may also reverse hypochloremia.
Objectives: We assessed the decongestive, natriuretic, and chloride‑regaining effects as well as the renal safety profile of oral acetazolamide (250 mg) used as an add‑on therapy in patients with AHF.
Patients and methods: This prospective, randomized study was conducted at the Institute of Heart Diseases in Wrocław, Poland. It involved patients with AHF who were randomly assigned to receive either 250 mg of oral acetazolamide or standard care, and who underwent clinical and laboratory follow‑up for 3 consecutive days since the beginning of the treatment and at discharge.
Results: The study population comprised 61 patients (71% men), of whom 31 (51%) were included in the acetazolamide group. The mean (SD) age of the patients was 68 (13) years. In comparison with the controls, the acetazolamide group demonstrated significantly higher cumulative diuresis after 48 and 72 hours since treatment implementation, negative fluid balance, weight loss after 48 hours of treatment, weight loss throughout the hospitalization, natriuresis, and serum chloride concentration. In terms of the renal safety profile, no increase in the creatinine concentration and urinary renal biomarker levels was noted.
Conclusions: Oral acetazolamide seems to be a valuable add‑on therapy that helps achieve comprehensive decongestion in patients with AHF.
What's new?
The main goal of treatment in patients with acute heart failure (AHF) is to achieve safe and effective decongestion, which translates into clinical improvement. Loop diuretics remain the cornerstone of decongestive therapy, yet in some clinical situations they might be insufficient. Acetazolamide is a diuretic used in the treatment of several illnesses (ie, glaucoma, idiopathic intracranial hypertension, altitude sickness). It reduces sodium reabsorption in the proximal renal tubule, which promotes diuresis. Recently, it has been shown that the addition of intravenous acetazolamide to loop diuretics in patients with AHF leads to more successful decongestion, as compared with the standard care. Whether the same effect can be achieved with oral acetazolamide (the only form of the drug that is available in Poland) remains unanswered. Our study provides encouraging findings about the diuretic, natriuretic, and chloride‑regaining effects of combined decongestive therapy with oral acetazolamide in AHF patients with volume overload.
Introduction
Acute heart failure (AHF), despite advances in therapy, remains to be associated with poor prognosis.1 Congestion plays a significant role in the AHF pathophysiology, and decongestion constitutes an important therapeutic target.2 Recently, a novel approach to the decongestive therapy has emerged.3 Combination of diuretic classes allows to involve different mechanisms of action in various nephron segments to ensure an effective and efficient treatment. It should be emphasized that ineffective diuresis, natriuresis, and dyschloremia are among the multiple causes of AHF worsening.4-8
There is a growing trend for acetazolamide use in decongestive therapy in patients with AHF.3,9-11 The ADVOR (Acetazolamide in Decompensated Heart Failure with Volume Overload) trial3 showed that the addition of 500 mg of intravenous (IV) acetazolamide to loop diuretics in patients with AHF with volume overload resulted in decongestion, as compared with the standard therapy. Acetazolamide blocks carbonic anhydrase in the proximal renal tubule, which increases the excretion of water, potassium, sodium, and bicarbonate ions, strongly alkalizing the urine.9 It also has potential as a chloride‑regaining diuretic that may help preserve the plasma volume and enhance vascular “tonicity.”9,12
Orally administered diuretics have limited and variable bioavailability. Intestinal mucosal edema and slow blood flow in the gastrointestinal tract found in HF patients additionally impair their absorption, potentially increasing drug resistance.13-16 Even though IV administration of acetazolamide is possible, the oral dosage has its advantages. Unlike the IV route, it does not require placement of an IV line, thus reducing pain and the risk of infection. Another downside related to the IV administration is that the results of studies involving patients receiving the drug via this route cannot not be generalized to the outpatient population. The ADVOR trial,3 which demonstrated beneficial effects of IV acetazolamide, prompted us to investigate whether it would be possible to achieve similar results with the oral form of the drug.
The aim of our study was to analyze the spectrum of the decongestive, natriuretic, and chloride‑regaining effects of oral acetazolamide (250 mg) used on top of the standard diuretic therapy, as compared with the standard of care.
Patients and methods
Study population
This prospective, randomized, single‑blind (participants) study was carried out in the Institute of Heart Diseases in Wrocław, Poland, between February 2020 and November 2021. The participants were randomly assigned with a 1:1 allocation (using a randomization algorithm) to receive 250 mg of oral acetazolamide (as an add‑on to the standard therapy) or the standard of care. All consecutive patients hospitalized in our institution whose primary cause of hospitalization was AHF were screened for eligibility. The inclusion criteria comprised age of at least 18 years, administration of IV furosemide on admission, and ability to express informed consent, whereas the exclusion criteria were acute coronary syndrome, cardiogenic shock, mean arterial pressure below 65 mm Hg or systolic blood pressure below 90 mm Hg on admission, history of severe liver disease, baseline estimated glomerular filtration rate (eGFR) lower than 15 ml/min/1.73 m2 according to the Modification of Diet in Renal Disease (MDRD) formula, end‑stage renal disease requiring renal replacement therapy or ultrafiltration, and chronic angle‑closure glaucoma. AHF was diagnosed according to the European Society of Cardiology guidelines.1
Only the patients who provided written informed consent were included. The study was approved by the institutional Ethics Committee (502/2020), and carried out in accordance with the principles of the Declaration of Helsinki and Good Clinical Practice.17
Worsening renal function (WRF) was defined as an increase in the serum creatinine level greater than or equal to 0.3 mg/dl or a decrease in eGFR by at least 25% between any time points.
Study design
On admission to the hospital, detailed information about the patients’ clinical history, comorbidities, physical examination findings, and prior treatment history was collected. At baseline, the patients were randomized to receive acetazolamide (250 mg orally, once daily, administered only until day 3) or the standard of care (control group). Although there was no strict protocol for diuretic dosing, furosemide was usually administered through short‑term continuous infusion starting between 7:00 and 9:00 AM. Venous blood and urine samples were collected, and the patient clinical condition was assessed at the beginning of treatment (day 1; 0–24 h since treatment implementation), then on day 2 (24–48 h), day 3 (48–72 h), and at discharge. To reduce the risk of bias, we collected the first morning urine samples after diuretic administration. The clinical status of each patient was based on the assessment of signs and symptoms of HF, that is, edema (0–1 point), pulmonary congestion (0–1 point), and weight fluctuation. The assessment of dyspnea severity was performed using a self‑reported 11‑point (0–10) Likert scale (with 0 corresponding to “absence of dyspnea” and 10 corresponding to “dyspnea of the worst severity”).
Laboratory analysis of peripheral blood and urine samples
Plasma levels of N‑terminal pro–B‑type natriuretic peptide (NT‑proBNP; immunoenzymatic method, Siemens, Marburg, Germany) and troponin I (immunoenzymatic method; Dimension RxLMax analyzer, Siemens) were assessed. Spot urine samples were analyzed for urinary sodium (UNa+), urinary potassium, chloride, creatinine, and urea. Additional urine samples were collected, centrifuged, and frozen at –70 °C for further analysis of renal biomarkers: neutrophil gelatinase–associated lipocalin (NGAL), kidney injury molecule‑1 (KIM‑1), and cystatin C (Cys‑C), which were measured using the Quantikine enzyme‑linked immunoassay kit (R&D Systems, Inc., Minneapolis, Minnesotta, United States).
In the patients who required an indwelling urinary catheter (ca 5%), the urine samples were taken directly from the catheter. All patients were instructed to limit their fluid intake during the study period to 1.5 to 2 liters per 24 hours. Fluid balance was estimated on the basis of daily urine collection carried out during 24 hours, from 6:00 AM to 6:00 AM on the following day. Diuretic efficiency was calculated based on the 24‑hour urine output and total daily dose of furosemide.
Study outcomes
The following parameters were compared between the 2 groups at all the analyzed time points: 1) diuresis, fluid balance, weight loss; 2) natriuresis, serum chloride concentration, serum creatinine concentration, and eGFR calculated using the MDRD formula; 3) occurrence of WRF, and 4) urinary levels of kidney biomarkers (NGAL, KIM‑1, and Cys‑C).
Statistical analysis
Continuous variables with normal distribution were presented as means and SD, variables with skewed distribution were shown as medians with interquartile ranges (IQRs), and nominal variables were presented as numbers and percentages. Normality of the distribution was measured with the Shapiro–Wilk test. The t test for independent variables, Mann–Whitney test, repeated measures analysis of variance (ANOVA), Fischer exact test, and Newman–Keuls multiple comparison test were used as appropriate for comparisons between the acetazolamide group and the control group. Logistic regression was performed to assess the impact of the administered treatment on WRF occurrence. A P value below 0.05 was considered significant. Statistica 13.3 package (Tibco, Palo Alto, California, United States) was used for statistical analysis.
Results
Study population
A total of 61 patients were enrolled, of whom 31 were randomized to the acetazolamide group and 30 to the control group. The mean (SD) age of the patients was 68 (13) years, 71% were men, and the mean (SD) left ventricular ejection fraction was 37% (15%). Baseline characteristics and laboratory values of the study population are presented in Table 1. The median (IQR) NT‑proBNP level on admission was 7045.5 (3572–11 003) pg/ml. During the hospitalization, all patients received IV furosemide. In the acetazolamide group, 11 patients (35%) received a vasodilator (nitroglycerin) and 2 (6%) received an inotropic agent (dobutamine); the respective numbers of patients receiving these drugs in the control group were 13 (43%) and 3 (10%), and the difference was not significant. The 2 groups did not differ in terms of the IV dose of furosemide administered over 3 consecutive days (Table 2).
Parameter | All patients (n = 61) | Acetazolamide group (n = 31) | Control group (n = 30) | P value | |
Data are presented as number (percentage) of patients or median (interquartile range) unless otherwise indicated.
SI conversion factors: to convert hemoglobin to g/l, multiply by 10; creatinine to μmol/l, by 88.4; NT‑proBNP to ng/l, by 1; ALT, AST, and GGTP to μkat/l, by 0.0167; bilirubin to μmol/l, by 17.104.
Abbreviations: ACEI, angiotensin‑converting enzyme inhibitor; ALT, alanine transaminase; ARB, angiotensin receptor blocker; ARNI, angiotensin receptor neprilysin inhibitor; AST, aspartate transaminase; eGFR, estimated glomerular filtration rate; GGTP, γ-glutamyl transferase; HF, heart failure; HFmrEF, hear failure with mildly reduced ejection fraction; HFpEF, heart failure with preserved ejection fraction; HFrEF, heart failure with reduced ejection fraction; IV, intravenous; LVEF, left ventricular ejection fraction; MRA, mineralocorticoid receptor antagonist; NT‑proBNP, N‑terminal pro–B‑type natriuretic peptide; SGLT‑2, sodium‑glucose cotransporter 2 | |||||
Male sex | 43 (71) | 22 (71) | 21 (70) | 0.58 | |
Age, y, mean (SD) | 68 (13) | 69 (12.7) | 68 (14) | 0.54 | |
Heart rate, bpm, mean (SD) | 82 (14) | 83 (12.9) | 80 (16) | 0.47 | |
Systolic blood pressure on admission, mm Hg, mean (SD) | 125 (20) | 127 (20) | 122 (20) | 0.36 | |
Diastolic blood pressure on admission, mm Hg, mean (SD) | 80 (16) | 80 (16) | 79 (17) | 0.72 | |
LVEF, %, mean (SD) | 37 (15) | 36 (15) | 38 (16) | 0.74 | |
HF phenotype | HFrEF (EF ≤40%) | 37 (61) | 19 (61) | 18 (60) | 0.88 |
HFmrEF (EF 41%–49%) | 5 (8) | 2 (7) | 3 (10) | ||
HFpEF (EF ≥ 50%) | 19 (31) | 10 (32) | 9 (30) | ||
Acute HF (de novo) | 39 (64) | 18 (58) | 21 (70) | 0.43 | |
Decompensation of chronic HF | 22 (36) | 13 (42) | 9 (30) | 0.43 | |
Ischemic HF | 31 (51) | 14 (45) | 17 (57) | 0.45 | |
Comorbidities | |||||
Hypertension | 58 (95) | 30 (97) | 28 (93) | 0.61 | |
Atrial fibrillation | 36 (59) | 20 (65) | 16 (53) | 0.6 | |
Diabetes mellitus | 28 (46) | 17 (55) | 11 (37) | 0.2 | |
Laboratory parameters | |||||
Hemoglobin, g/dl, mean (SD) | 12.7 (2.5) | 12.9 (2.5) | 12.5 (2.6) | 0.55 | |
Hematocrit, %, mean (SD) | 39.2 (7) | 39.7 (6.7) | 38.7 (7.6) | 0.55 | |
White blood cells, G/l, mean (SD) | 7 (2.9) | 7.9 (1.9) | 8.12 (3.7) | 0.75 | |
Platelets, G/l, mean (SD) | 21 (74.7) | 221 (77.6) | 218 (73) | 0.88 | |
Serum Na+, mmol/l, mean (SD), | 140 (4.4) | 141 (3.2) | 139 (5.2) | 0.04 | |
Serum Cl, mmol/l, mean (SD) | 103.5 (8.8) | 105 (10.6) | 101 (5.8) | 0.07 | |
Potassium, mmol/l, mean (SD) | 4.2 (0.4) | 4.17 (0.3) | 4.18 (0.6) | 0.99 | |
eGFR, ml/min/1.73 m2, mean (SD) | 58 (20.9) | 58 (21.2) | 58 (21.6) | 0.56 | |
Creatinine, mg/dl, mean (SD) | 1.3 (0.4) | 1.29 (0.5) | 1.34 (0.5) | 0.73 | |
Urea, mg/dl | 48 (34.5–72.5) | 44.5 (33–72) | 53 (35–76) | 0.52 | |
NT‑proBNP, pg/ml | 7045.5 (3572–11 003) | 6752 (3659–9968) | 7060 (3486–12 648) | 0.47 | |
Troponin I, ng/ml | 49 (15–56) | 51.6 (17–56) | 36.4 (11–59) | 0.59 | |
ALT, U/l | 25 (16–38) | 27 (16–38) | 22.5 (15–38) | 0.61 | |
AST, U/l | 28 (21–37) | 27 (20–39) | 28.5 (21–34) | 0.97 | |
GGTP, U/l | 89 (45–138) | 89 (48–112) | 91 (24–209) | 0.85 | |
Total bilirubin, mg/dl | 1.3 (0.9–2.1) | 1.3 (1–1.9) | 1.3 (0.8–2.6) | 0.93 | |
Drug class before hospitalization | |||||
ACEI/ARB | 37 (60) | 18 (58) | 19 (63) | >0.99 | |
β-Blocker | 49 (80) | 25 (81) | 24 (80) | 0.47 | |
MRA | 25 (41) | 11 (35) | 14 (45) | 0.61 | |
ARNI | 5 (8) | 3 (10) | 2 (7) | 0.27 | |
Drug class during hospitalization | |||||
ACEI/ARB | 57 (90) | 28 (90) | 27 (90) | >0.99 | |
β-Blocker | 61 (100) | 31 (100) | 30 (100) | 0.49 | |
MRA | 52 (85) | 27 (87) | 25 (83) | 0.73 | |
SGLT‑2 inhibitor | 15 (25) | 8 (25) | 7 (23) | 0.12 | |
ARNI | 5 (8) | 3 (10) | 2 (7) | 0.25 | |
Dobutamine, IV | 5 (8) | 2 (6) | 3 (10) | >0.99 | |
Nitroglycerin, IV | 24 (39) | 11 (35) | 13 (43) | 0.44 | |
Variable | Acetazolamide group (n = 31) | Control group (n = 30) | P value | |
Data are presented as number (percentage) of patients or median (interquartile range) unless otherwise indicated.
a The number of patients for some variables does not sum up to 100% due to missing data.
Abbreviations: OR, odds ratio; WRF, worsening renal function | ||||
Day 1 (0–24 h) | ||||
Dyspnea at rest | 31 (97) | 28 (93) | 0.75 | |
Weight, kg, mean (SD) | 94.9 (23) | 82.7 (19) | 0.03 | |
Diuresis (0–24 h), ml | 2750 (1870–3950) | 1850 (1450–3000) | 0.05 | |
Dose of IV furosemide, mg | 100 (80–120) | 80 (80–120) | 0.25 | |
Diuretic efficiency, ml/mg of furosemide/24 h | 31.7 (19.2–40) | 22.2 (15–33.3) | 0.07 | |
More than trace edema | 29 (94) | 28 (93) | >0.99 | |
Limb edema (rebound time) | No edema | 3 (10) | 2 (7) | 0.44 |
10–15 s | 3 (10) | 7 (23) | ||
16–30 s | 8 (26) | 9 (30) | ||
>30 s | 17 (54) | 12 (40) | ||
Rales | 30 (97) | 30 (100) | 1 | |
Rales extent | No rales | 1 (3) | 0 | 0.03 |
1/3 of the lungs | 20 (65) | 27 (93) | ||
1/3–2/3 of the lungs | 10 (32) | 2 (7) | ||
>2/3 of the lungs | 0 | 0 | ||
Elevated jugular venous pressure | 28 (87.5) | 28 (93) | 1 | |
Ascites | 8 (26) | 4 (13) | 0.34 | |
Day 2 (24–48 h) | ||||
Dyspnea at rest | 13 (42) | 14 (47) | 0.45 | |
Weight, kg, mean (SD) | 93.2 (22) | 81.9 (18) | 0.04 | |
ΔWeight (0–24 h), kg | 2 (0.9–3.3) | 0.85 (0–3.3) | 0.1 | |
Diuresis (0–48 h), ml | 5300 (4050–6750) | 3750 (2900–5150) | 0.01 | |
Dose of IV furosemide, mg | 80 (60–100) | 60 (60–80) | 0.21 | |
Diuretic efficiency, ml/mg of furosemide/24 h | 41.3 (23.3–47.5) | 26.3 (18.3–45) | 0.16 | |
More than trace edema | 26 (84) | 26 (87) | 1 | |
Limb edema (rebound time) | No edema | 6 (19) | 5 (17) | 0.94 |
10–15 s | 2 (6) | 2 (7) | ||
16–30 s | 10 (33) | 12 (40) | ||
>30 s | 13 (42) | 11 (36) | ||
Rales | 27 (87) | 25 (83) | 1 | |
Rales extent | No rales | 5 (16) | 5 (17) | 0.91 |
1/3 of the lungs | 23 (74) | 23 (77) | ||
1/3–2/3 of the lungs | 3 (10) | 2 (7) | ||
>2/3 of the lungs | 0 | 0 | ||
Elevated jugular venous pressure | 28 (87.5) | 28 (93) | 1 | |
Ascites | 6 (20) | 4 (13) | 0.73 | |
Day 3 (48–72 h) | ||||
Dyspnea at rest | 3 (9.7) | 3 (10) | 0.67 | |
Weight, kg, mean (SD) | 91.7 (22) | 81.1 (17) | 0.07 | |
ΔWeight (0–48 h), kg | 3.25 (1.7–4.8) | 1.13 (0.4–4.2) | 0.03 | |
Diuresis (0–72 h), ml | 7800 (6500–9300) | 5500 (4150–6900) | 0.004 | |
Dose of IV furosemide, mg | 60 (60–100) | 60 (40–80) | 0.13 | |
Diuretic efficiency, ml/mg of furosemide/24 h | 32.5 (23.1–43.8) | 25 (14.4–47.5) | 0.41 | |
More than trace edema | 21 (68) | 23 (77) | 0.39 | |
Limb edema (rebound time) | No edema | 10 (32) | 6 (20) | 0.23 |
10–15 s | 0 | 2 (7) | ||
16–30 s | 14 (45) | 18 (60) | ||
>30 s | 7 (23) | 4 (13) | ||
Rales | 22 (71) | 24 (80) | 0.78 | |
Rales extent | No rales | 10 (32) | 8 (27) | 0.76 |
1/3 of the lungs | 20 (65) | 20 (67) | ||
1/3–2/3 of the lungs | 1 (3) | 2 (6) | ||
>2/3 of the lungs | 0 | 0 | ||
Elevated jugular venous pressure | 24 (75) | 25 (83) | 0.75 | |
Ascites | 6 (20) | 4 (13) | 0.73 | |
Discharge | ||||
Dyspnea at rest | 0 | 0 | – | |
Weight, kg, mean (SD) | 88.6 (22) | 79.5 (17) | 0.09 | |
ΔWeight, kg (baseline–discharge) | 5.3 (3.4–9.3) | 2.7 (0–7) | 0.02 | |
Dose of oral furosemide, mg | 80 (40–80) | 80 (60–120) | 0.56 | |
More than trace edema | 10 (32) | 13 (43) | 0.2 | |
Limb edema (rebound time) | No edema | 21 (68) | 15 (50) | 0.36 |
10–15 s | 3 (10) | 7 (23) | ||
16–30 s | 5 (16) | 7 (23) | ||
>30 s | 2 (6) | 1 (4) | ||
Rales | 10 (32) | 15 (50) | 0.41 | |
Rales extent | No rales | 21 (68) | 15 (50) | 0.18 |
1/3 of the lungs | 9 (29) | 15 (50) | ||
1/3–2/3 of the lungs | 1 (3) | 0 | ||
>2/3 of the lungs | 0 | 0 | ||
Elevated jugular venous pressure | 20 (62.5) | 23 (76.7) | 0.4 | |
Ascites | 2 (6.5) | 4 (13) | 0.43 | |
WRF during hospitalization | 8 (25) | 9 (30) | >0.99 | |
WRF, OR (95% CI) | 0.85 (0.27–2.68) | 0.78 | ||
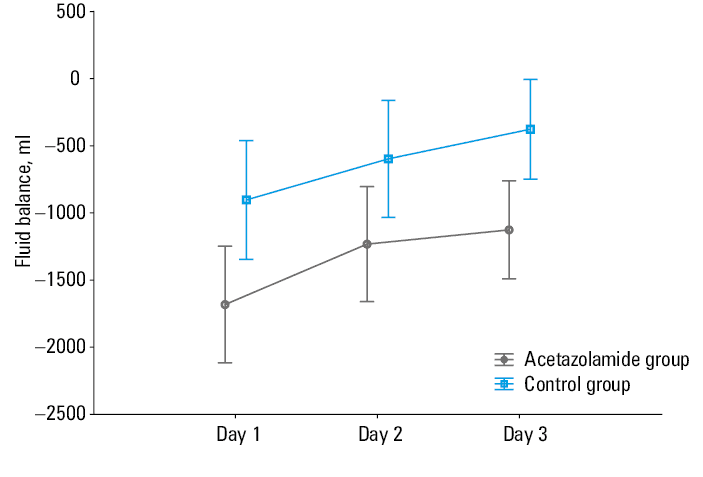
Diuresis, negative fluid balance, and weight loss
There was a significant difference in cumulative diuresis after 48 hours (day 2; median [IQR], 5300 [4050–6750] ml vs 3750 [2900–5150] ml, respectively, in the acetazolamide group and the control group; P = 0.01) and after 72 hours of treatment (day 3; median [IQR], 7800 [6500–9300] ml vs 5500 [4150–6900] ml, respectively, in the acetazolamide group and the control group; P = 0.004). The patients receiving acetazolamide showed greater diuresis after 24 hours of treatment (day 1) than the controls (median [IQR], 2750 [1870–3950] ml vs 1850 [1450–3000] ml, respectively; P = 0.05). There was a significant difference in the mean (SD) fluid balance values between the acetazolamide group and the control group (day 1 [0–24 h]: –1682 [1042] ml vs –903 [1320] ml, respectively); P = 0.015; F = 6.33; day 2 [24–48 h]: –1232 [977] ml vs –597 [1342] ml, respectively; P = 0.042; F = 4.33; day 3 [48–72 h]: –1126 [834] ml vs –376 [1143] ml, respectively; P = 0.006; F = 8.32). The comparison of the fluid balance between the groups is presented in Figure 1. There were significant differences between the 2 groups in terms of weight loss after 48 hours (acetazolamide group: median [IQR], 3.25 [1.7–4.8] kg vs control group: median [IQR], 1.13 [0.4–4.2] kg; P = 0.03) and weight loss throughout the whole duration of hospitalization (acetazolamide group: median [IQR], 5.3 [3.4–9.3] kg vs control group: median [IQR], 2.7 [0–7] kg; P = 0.02). There was no significant difference in weight loss after 24 hours (acetazolamide group: median [IQR], 2 [0.9–3.3] kg vs control group: median [IQR], 0.85 [0–3.3] kg; P = 0.1). Data on diuresis and weight loss for all the analyzed time points are shown in Table 2. The patients treated with acetazolamide had more severe pulmonary congestion at baseline (with no difference in peripheral edema), but this difference was not observed in subsequent assessments (Table 2). The groups did not differ in liver function tests at baseline or in diuretic efficiency (P = 0.07).
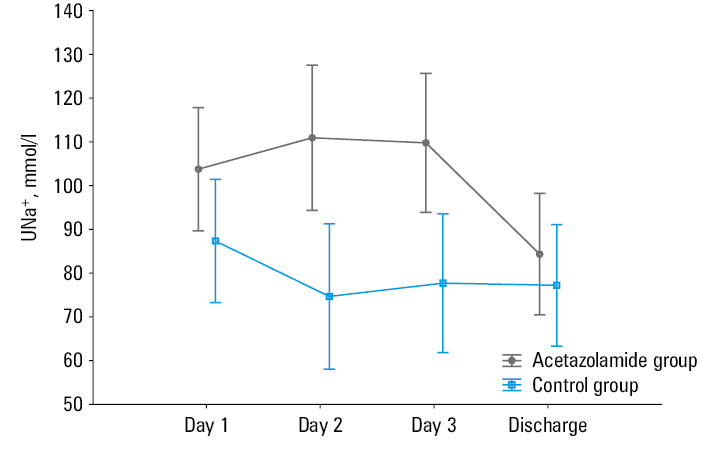
Natriuresis
The baseline UNa+ did not differ between the groups. However, the level of UNa+ increased day by day, and the difference reached significance on day 2 (acetazolamide group: mean [SD], 114.7 [41] mmol/l vs control group: mean [SD], 74.4 [44] mmol/l; P = 0.003; F = 9.64) and day 3 (acetazolamide group: mean [SD], 110.2 [41] mmol/l vs control group: mean [SD], 76.4 [42] mmol/l; P = 0.006; F = 8.24) (Figure 2).
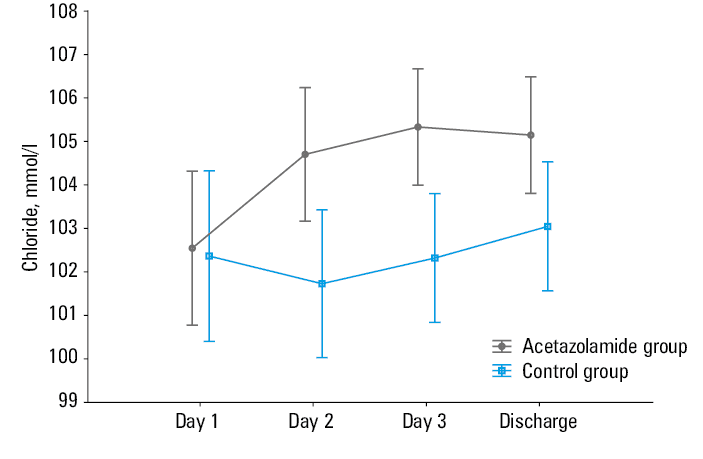
Serum chloride
There was a significant increase in serum chloride levels in the acetazolamide group, as compared with the control group, on day 2 (mean [SD], 104.7 [4] mmol/l vs 101.9 [4] mmol/l, respectively; P = 0.01; F = 6.82) and on day 3 (mean [SD], 105.3 [4] mmol/l vs 102.5 [4] mmol/l, respectively; P = 0.004; F = 4.46). The difference between the 2 groups was not significant at baseline or at discharge (Figure 3).
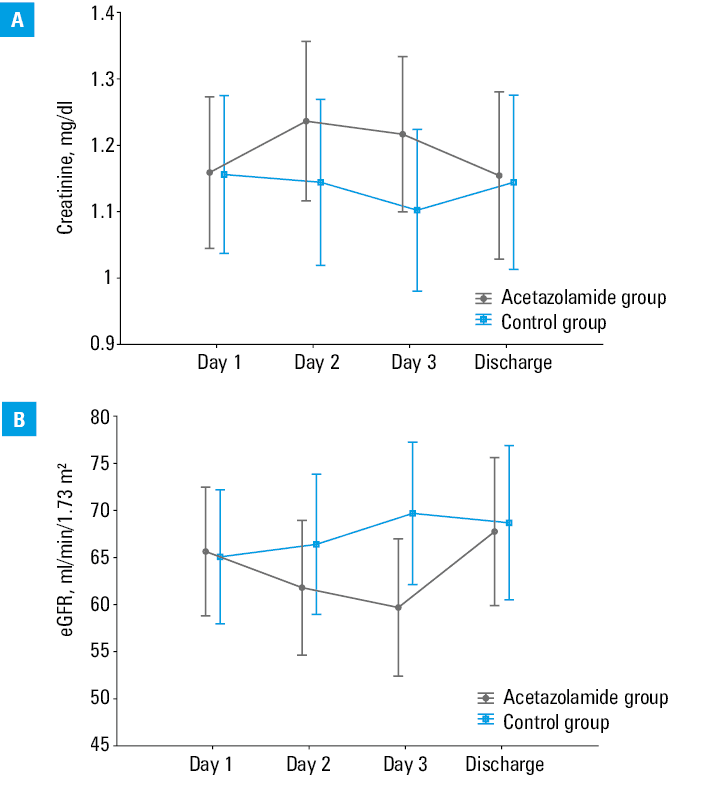
Creatinine, estimated glomerular filtration rate, and worsening renal function
There were no significant differences in serum creatinine levels and eGFR between the acetazolamide group and the control group at any of the 4 time points (Figure 4). The WRF occurrence was equally common in both groups (odds ratio [OR] = 0.85; 95% CI, 0.27–2.68; P = 0.78).
Urinary renal biomarkers
Neutrophil gelatinase–associated lipocalin
The urinary NGAL levels did not differ significantly at any of the analyzed time points. The difference was the most pronounced after 24 hours of treatment (P = 0.07) (Figure 5).
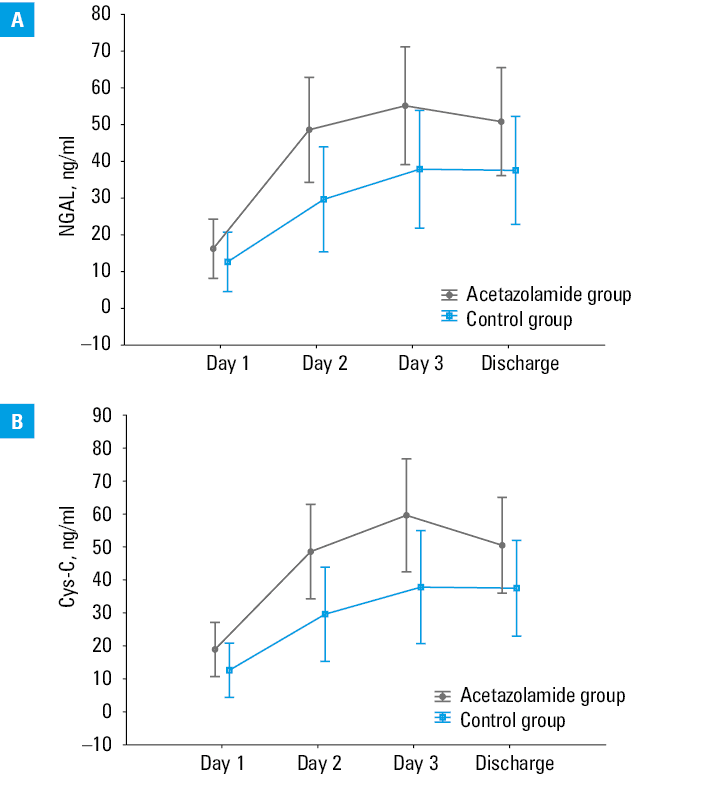
Cystatin C
There were no significant differences in urinary Cys‑C levels between the acetazolamide group and the control group at any of the 4 time points (Figure 5). The greatest difference was observed after 24 hours of treatment (P = 0.07). In each, group the Cys‑C levels increased significantly over time (P <0.001).
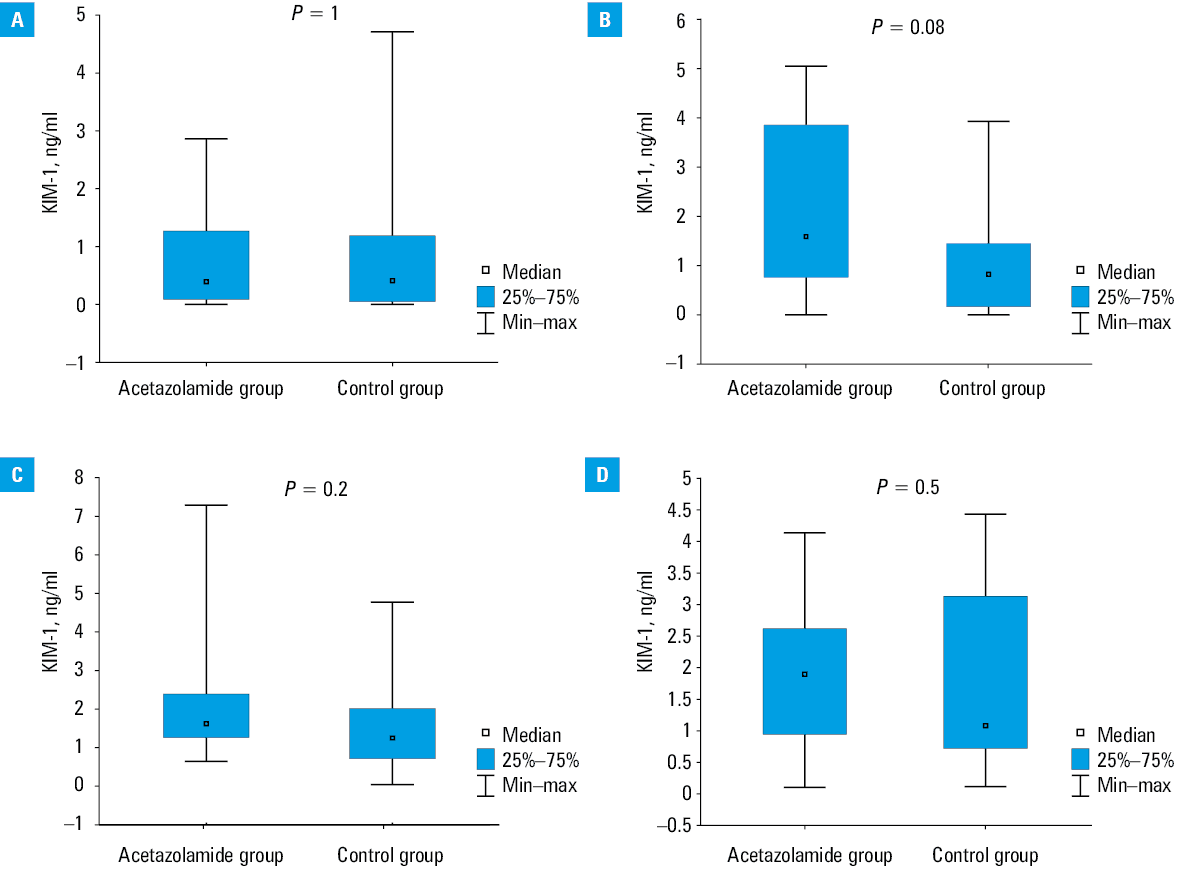
Kidney injury molecule‑1
The change in the urinary KIM‑1 level was similar in both groups at all 4 time points (P >0.05). However, as compared with the other time points, the difference was the greatest after 24 hours of treatment (P = 0.08) (Figure 6).
Discussion
The findings of the present study potentially confirm the comprehensive efficacy of oral acetazolamide in AHF. Treatment with oral acetazolamide (250 mg daily for 3 days) in addition to the standard diuretic therapy resulted in improvement in the following: 1) diuresis, leading to negative fluid balance, 2) weight loss, 3) natriuresis, and 4) serum chloride concentration. Moreover, the therapy was safe, with no increase in the creatinine concentration or any significant increase in urinary renal biomarkers (NGAL, Cys‑C, KIM‑1) of acute kidney injury.
The beneficial effect offered by the combination of the standard diuretic therapy including loop diuretics and acetazolamide has been recently indicated. There are several reasons that encourage the use of acetazolamide as an adjunct diuretic in AHF.3,9,10 The combination treatment with acetazolamide may be effective due to different mechanisms of action of diuretics in various nephron segments, allowing for effective elimination of volume overload understood as simultaneous, effective removal of water and sodium from the body in HF patients. This is supported by several studies on IV acetazolamide.3,9,18 According to DIURESIS‑CHF (Acetazolamide and Spironolactone to Increase Natriuresis in Congestive Heart Failure),9 a randomized study involving patients with AHF and marked volume overload, the addition of 250 to 500 mg of acetazolamide, administered as an IV bolus, to low‑dose loop diuretics (bumetanide 1–2 mg twice daily) improves natriuresis and loop diuretic efficacy. The results of the multicenter, randomized, double‑blind ADVOR trial3 confirmed that treatment with 500 mg of IV acetazolamide in addition to IV loop diuretics significantly increased decongestion within 3 days of randomization, and resulted in improved diuretic response measured by higher cumulative diuresis, natriuresis, and shorter duration of hospitalization. Another small study involving 9 patients with HF revealed that an addition of 250 mg of oral acetazolamide to 40 mg of furosemide increased diuresis similarly to that obtained with a double dose of furosemide.18
In the context of natriuresis and chloride handling, the renal tubular function and tubuloglomerular feedback serve an important role in achieving effective diuresis and maintaining intravascular compartments.19-21 Natriuresis was shown to have a strong impact on decongestion abilities in AHF as well as on the prognosis, while data on chloride are scarce.6-8,20,22 The greatest amount of chloride is reabsorbed in the proximal convoluted tubule (PCT).23 Acetazolamide blocks carbonic anhydrase (located on the apical membrane of the PCT), resulting in increased levels of bicarbonate in the urinary space, thus increasing the electrochemical gradient, which improves chloride reabsorption and may reverse hypochloremia.21 Through this mechanism and bicarbonate excretion, the risk of alkalosis in HF is reduced.9,21 In addition, acetazolamide activates the tubuloglomerular feedback mechanism (through increased delivery of chlorides to the macula densa cells) and, as a result, prevents the release of renin by the afferent arteriole of the nephron and the activation of the neurohormonal axis of the renin–angiotensin–aldosterone system.21 According to the “chloride theory,” a diuretic therapy that increases serum chloride preserves the plasma volume and renal function, and it tends to inhibit the fluid shift from the intravascular to the interstitial space. In contrast, reducing the serum chloride concentration through the use of standard diuretic therapy for HF may adversely affect the treatment. Patients with hypochloremia take higher doses of loop diuretics than those with normal serum chloride concentrations.5 A small retrospective study on acetazolamide confirmed that the serum chloride concentration markedly increased in the acetazolamide group.10 Moreover, our findings concerning serum chloride confirmed the idea that oral acetazolamide could be used as an adjunct to the diuretic therapy, especially in HF patients with volume overload and hypochloremia, with the aim of correcting the electrolyte imbalance, especially during the early stages of decongestive treatment, which are crucial.
It should be noted that the dose of oral acetazolamide in our study was smaller than the IV dose used in the ADVOR trial,3 and it was not increased proportionally to the patient body weight. Due to the small number of recruited patients, it was not possible to detect significant differences between the 2 groups with respect to resolution of HF symptoms, that is, edema, rales, and others (Table 2). However, despite the suspected limited bioavailability due to intestinal mucosal edema flow found in HF patients, the participants demonstrated successful diuresis, negative fluid balance, and weight loss during the combination therapy with oral acetazolamide. Although the diuretic efficiency (expressed as urine output per loop diuretic dose) was numerically higher in the acetazolamide group, the difference was not significant. We may speculate that this was due to the study being underpowered. Importantly, at baseline, the 2 groups did not differ in the levels of markers that reflect the congestion status (NT‑proBNP, serum creatinine, and liver function tests).24
Congestion is associated with poor prognosis and may lead to WRF25,26; hence, quick and safe elimination of water and sodium is essential in AHF therapy. Therefore, consistent evaluation of the renal function should be conducted in each patient with AHF to ensure the safety of the treatment. The selected urinary renal biomarkers (NGAL, KIM‑1, and Cys‑C), being more sensitive than creatinine, may be helpful in predicting WRF. However, they are not widely used in everyday clinical practice, as their measurement can be time‑consuming and rather costly.27-29 Nonetheless, we used NGAL, KIM‑1, and Cys‑C in our study to be able to monitor the patients more accurately and predict the potential signs of WRF at the earliest possible stage. The DIURESIS‑CHF study9 showed that the use of acetazolamide was associated with WRF (defined as a >0.3 mg/dl increase in serum creatinine within 72 hours) during decongestive treatment in AHF, although no adverse impact on the clinical outcome was noted. In the ADVOR trial,3 the incidence of WRF and adverse events was similar in all groups. Our study confirmed that a small dose of oral acetazolamide used in addition to the standard diuretic therapy may offer a good renal safety profile, without significant increase in creatinine, eGFR, and urinary renal biomarkers. Noteworthy, the addition of acetazolamide to the standard diuretic care and its effect on higher diuresis did not increase the incidence of WRF. It is an important observation, suggesting that volume depletion may be avoided even with more exhaustive decongestion using acetazolamide. For these reasons, such a treatment strategy may be helpful in comprehensive decongestive therapy for AHF.
Limitations
Several limitations of the present study should be acknowledged. First, the number of the included patients was relatively small. Second, the population was imbalanced in terms of the HF phenotypes—there was an overrepresentation of HF with reduced ejection fraction (61%). However, there was no difference in terms of HF phenotypes between the analyzed groups. Third, low number of patients on sodium‑glucose cotransporter‑2 (SGLT‑2) inhibitors may limit the generalizability of the results. However, our study was conducted between 2020 and 2021, prior to the publication of conclusive clinical trials on SGLT‑2 inhibitors in AHF.30-32 Importantly, in the ADVOR trial,3 the patients who received SGLT‑2 inhibitors were excluded. Safety and efficacy of the combination of SGLT‑2 and acetazolamide should be further assessed.
Conclusions
The combination of low‑dose diuretics with different sites of renal action (sequential nephron blockade) could be more effective and safer for the patients than the conventional high‑dose monotherapy. This study provides significant evidence supporting the use of oral acetazolamide to achieve effective decongestion in patients with AHF, improve serum chloride concentration and natriuresis, and potentially produce intrinsic renoprotective effects.
- McDonagh TA, Metra M, Adamo M, et al. 2021 ESC Guidelines for the diagnosis and treatment of acute and chronic heart failure. Eur Heart J. 2021; 42: 3599‑3726.
- Mullens W, Damman K, Harjola VP, et al. The use of diuretics in heart failure with congestion – a position statement from the Heart Failure Association of the European Society of Cardiology. Eur J Heart Fail. 2019; 21: 137‑155. | Crossref
- Mullens W, Verbrugge FH, Nijst P, et al. Rationale and design of the ADVOR (Acetazolamide in Decompensated Heart Failure with Volume Overload) trial. Eur J Heart Fail. 2018; 20: 1591‑1600. | Crossref
- Verbrugge FH, Dupont M, Steels P, et al. The kidney in congestive heart failure: “are natriuresis, sodium, and diuretics really the good, the bad and the ugly?” Eur J Heart Fail. 2014; 16: 133‑142. | Crossref
- Kataoka H. Proposal for heart failure progression based on the ‘chloride theory’: worsening heart failure with increased vs. non‑increased serum chloride concentration. ESC Hear Fail. 2017; 4: 623‑631. | Crossref
ARTICLE INFORMATION