Alterations of the kynurenine pathway in patients with type 1 diabetes are associated with metabolic control of diabetes


 CC BY-NC-SA 4.0
Alterations of the kynurenine pathway in patients with type 1 diabetes are associated with metabolic control of diabetes
Introduction
Type 1 diabetes mellitus (T1D) is an autoimmune disease, in which the progressive destruction of pancreatic β cells by autoreactive T cells leads to endogenous insulin deficiency that causes hyperglycemia.1
In recent years, there has been a gradual increase in the incidence of T1D and type 2 diabetes (T2D).2,3 In 2040, the number of T1D cases is predicted to reach 13.5 to 17.4 million, increasing the incidence by 60% to 107%, as compared with 2021.1 Diabetes has become a growing health problem, mainly due to macro- and microvascular complications, which are the most common causes of excess morbidity and mortality in the diabetic population, regardless of rapid technologic progress allowing for better metabolic control.4
Defects in the immune response mechanisms play an important role in the pathogenesis of T1D.5 Concomitantly, prolonged inflammation activates numerous metabolic pathways, such as the kynurenine pathway (KP), leading to the production of nicotinamide adenine dinucleotide. This metabolic route is the major pathway of tryptophan (TRP) catabolism, leading to the formation of many bioactive metabolites, namely kynurenine (KYN), kynurenic acid (KYNA), 3‑hydroxykynurenine (3‑HKYN), anthranilic acid (AA), and 3‑hydroxyanthranilic acid.6 Published data indicate that TRP metabolites are related to obesity, T2D, atherosclerosis, and hypertension.6 However, the data regarding TRP metabolism in T1D patients are limited.
The first stable metabolite of TRP is KYN, formed via enzymatic degradation by indoleamine 2,3‑dioxygenase (IDO) and tryptophan 2,3‑dioxygenase (TDO). It has been shown that KYN directly affects normal rat pancreatic islets, increasing insulin secretion during their stimulation with glucose.7 Moreover, KYN may enhance helper T‑cell apoptotic activity and regulatory T‑cell immunosuppressive activity, thus exhibiting immunomodulatory properties.5
Another metabolite, AA, is a compound derived from KYN by kynureninase. In physiological conditions, AA inhibits 3‑hydroxyanthranilic acid dioxygenase, thus reducing the production of quinolinic acid (QA).8 AA derivatives have already been studied as potential antidiabetic drugs. The potential mechanisms of action of AA derivatives, leading to the reduction of blood glucose levels, are related to the inhibitory activity against α-glucosidase and glycogen phosphorylase.9
Another compound originating from KYN via the action of kynurenine‑3‑monooxygenase is 3‑HKYN. It was demonstrated that 3‑HKYN inhibits leucine‑stimulated insulin release from β cells, and shows a positive association with glycated hemoglobin (HbA1c) levels and impaired glucose tolerance.10 Furthermore, 3‑HKYN is a precursor of neurotoxins, such as QA and xanthurenic acid (XA).
This case‑control study aimed to evaluate serum TRP, KYN, 3‑HKYN, and AA concentrations in the patients with T1D, and to assess the relationship between the tested compounds and metabolic parameters.
Patients and methods
Study participants
The study group comprised 50 adult participants previously diagnosed with T1D, recruited from September 2019 to July 2022 from among the patients of the Department of Internal Medicine and Metabolic Diseases at the Medical University of Bialystok and diabetology outpatient clinics. The control group consisted of 43 healthy volunteers, similar in age and body mass index (BMI) to the study group, recruited from among the employees of the Medical University of Bialystok and through media advertisements. The participants between 20 and 60 years of age, with BMI below 40 kg/m2, were enrolled in the study. The exclusion criteria for both groups included T2D, infection in the past month, taking antidepressants, chronic kidney disease with glomerular filtration rate (GFR) below 60 ml/min/1.73 m2, active malignancy, resistant hypertension, advanced heart failure, and advanced coronary artery disease. The exclusion criteria for the T1D group included HbA1c level above 10% and newly diagnosed diabetes (less than a month before the study). Each volunteer gave their written informed consent for participation in the study. The study protocol was approved by the Ethics Committee of the Medical University of Bialystok (R‑I‑002/641/2019). The research was performed in compliance with the Declaration of Helsinki.
Study protocol
The participants underwent physical examination with anthropometric measurements. Waist circumference was obtained midway between the lower costal margin and the iliac crest. Hip circumference was measured at the maximum circumference at the level of the femoral trochanters. BMI and waist‑hip‑ratio (WHR) were calculated from the measurements. The bioelectrical impedance method was used to analyze the body composition (InBody 570, InBody Co., Ltd., Cerritos, California, United States). The degree of obesity was calculated using the formula: (current weight / standard weight) × 100. In the T1D patients (n = 18), the glucagon test was conducted by intravenously administering 1 mg of glucagon, and assessing serum C‑peptide concentration before and at 6 minutes after the administration to estimate residual insulin secretion.
Blood sampling and assays
Laboratory analyses were performed after overnight fast. The hexokinase method measured plasma glucose concentrations (Alinity ci‑series, Abbott GmbH & Co. KG, Green Oaks, Illinois, United States). HbA1c level was assessed with high‑performance liquid chromatography (HPLC) (D‑10 Instrumentation, Bio‑Rad, Hercules, California, United States). Concentrations of serum total cholesterol, high‑density lipoprotein cholesterol (HDL), triglycerides (TG), and creatinine were measured using the enzymatic method, C‑peptide concentrations were assessed using the photometric method, and C‑reactive protein concentrations using the turbidimetric method (Alinity ci‑series).
The assessment of serum levels of KP metabolites was performed by HPLC, using the methodology outlined by Pawlak et al.11
Statistical analysis
Statistical analyses were carried out using Statistica 13 software (StatSoft, Tulsa, Oklahoma, United States) and GraphPad Prism version 9.0.0 (GraphPad Software, Boston, California, United States). The variables were tested for normal distribution using the Shapiro–Wilk test. The data were presented as medians and interquartile ranges (IQRs). The T1D and the control group were compared using the Mann–Whitney test and the χ2 test. The relationships between the variables were studied using the Spearman correlation coefficient and multivariable linear regression analysis. The results were considered significant if P value was below 0.05.
Results
The clinical and biochemical characteristics of the study participants are presented in Supplementary material, Table S1. All patients with T1D received insulin, of which 34 were treated with multiple daily injections (MDIs), and 16 with continuous subcutaneous insulin infusion (CSII). The patients with T1D and chronic complications received appropriate treatment with angiotensin‑converting enzyme inhibitor (6 individuals), statin (8 individuals), and β-blocker (9 individuals). In addition, 7 patients were treated with extended‑release metformin, and 6 with levothyroxine. The patients in the control group did not receive any medications.
Tryptophan metabolism in the serum of patients with type 1 diabetes
Concentrations of serum TRP, KYN, and 3‑HKYN were higher in the T1D group than in the controls, while AA levels were lower (Figure 1).
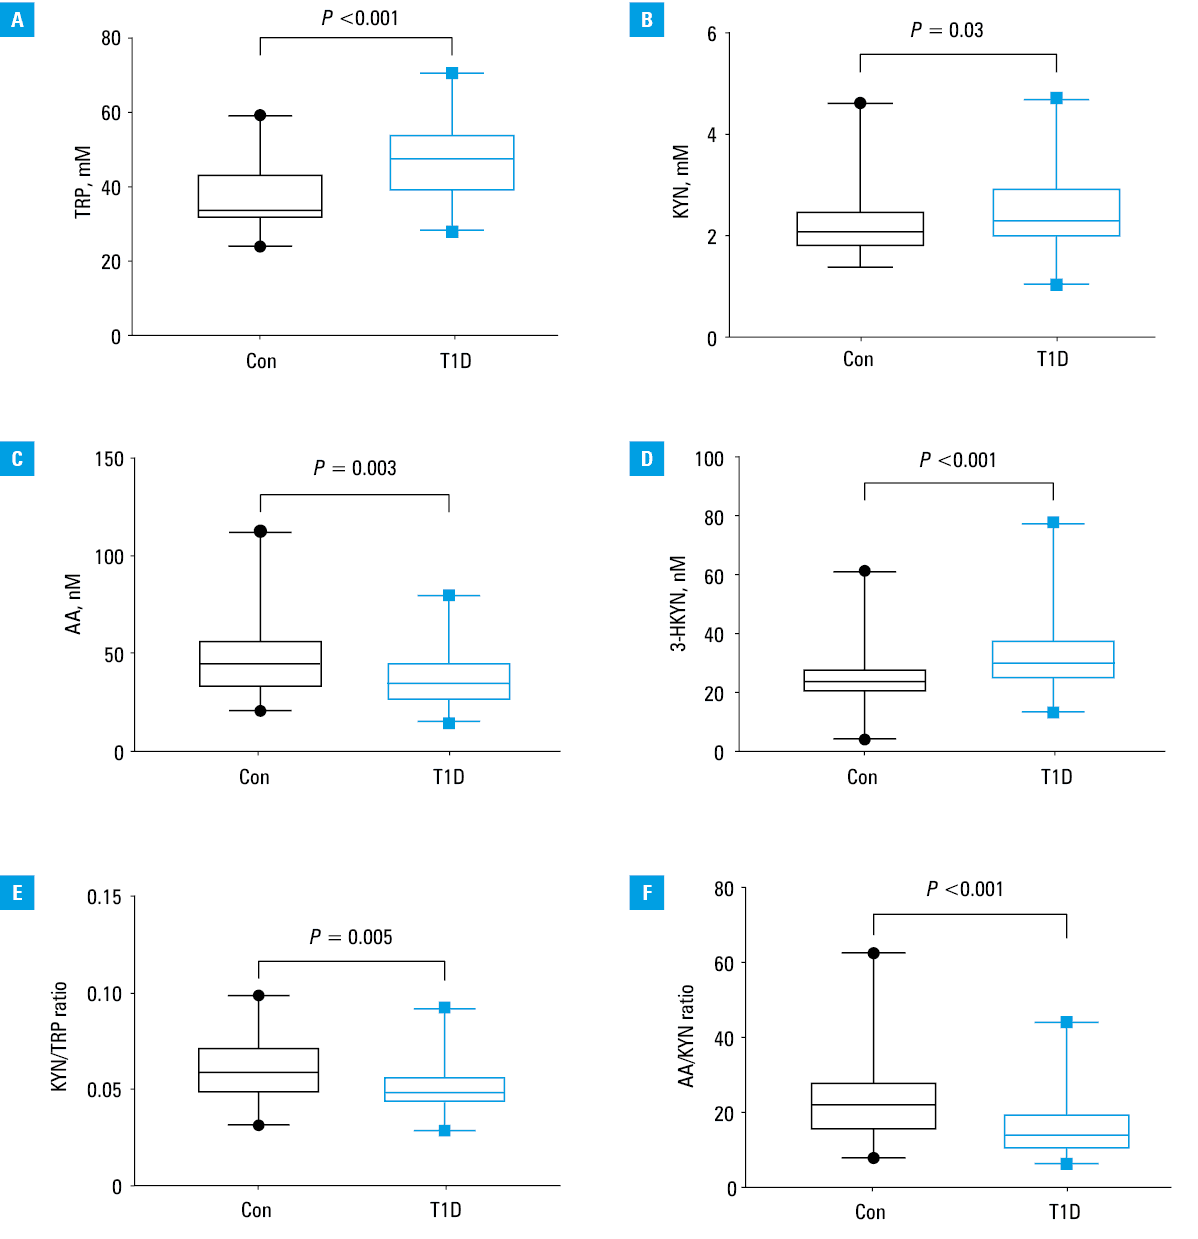
Abbreviations: 3‑HKYN, 3‑hydroxykynurenine; AA, anthranilic acid; Con, control group; KYN, kynurenine; T1D, type 1 diabetes; TRP, tryptophan
To assess the possible differences between KYN concentrations depending on the mode of insulin administration, the patients with T1D were divided into subgroups. The group treated with MDIs had higher HbA1c levels (P = 0.04) and lower AA levels (P = 0.01) than the patients treated with CSII, while there were no differences in daily insulin dose (P = 0.22) or the levels of other KYN metabolites between the groups. Additionally, in the whole T1D group, the participants with HbA1c level exceeding 7% (n = 33; irrespectively of the mode of insulin administration) had higher median KYN concentrations in comparison with those with HbA1c levels equal to or below 7% (2.614 μM [IQR, 2.037–3] vs 1.998 μM [IQR, 1.807–2.306]; P = 0.01).
Additionally, a product‑to‑substrate ratio was used to assess the involvement of specific enzyme systems in the synthesis of individual compounds. Thus, the KYN/TRP ratio reflects IDO and TDO activity, and the AA/KYN ratio reflect kynureninase activity. KYN/TRP and AA/KYN ratios were lower in the T1D group (P = 0.005 and P <0.001, respectively) (Figure 1).
Correlations between tryptophan metabolites, anthropometric and biochemical parameters, and diabetes duration in the type 1 diabetes group
Serum TRP levels positively correlated with BMI (R = 0.324; P = 0.02), body fat mass (R = 0.34; P = 0.03), degree of obesity (R = 0.33; P = 0.04), visceral fat level (R = 0.35; P = 0.03), and TG concentrations (R = 0.362; P = 0.02). In contrast, a negative correlation with HDL level was observed (R = –0.4; P = 0.007).
Positive correlations were found between KYN concentration and HbA1c (R = 0.42; P = 0.002), diabetes duration (R = 0.34; P = 0.02), and TG concentrations (R = 0.35; P = 0.02). A positive correlation occurred between AA levels and those of C‑peptide assessed 6 minutes after glucagon injection (R = 0.72; P = 0.005). A negative relationship was observed between AA concentration and WHR (R = –0.43; P = 0.006).
To investigate the effects of the parameters related to diabetes on KP metabolites, multivariable linear regression was performed. The included variables were HbA1c, HDL, and diabetes duration. BMI, age, and GFR were added as potential confounders. HbA1c, HDL, and diabetes duration were associated with KYN concentrations (B = 0.178; 95% CI, 0.03–0.326; B = –0.014; 95% CI, –0.027 to –0.002; B = 0.043; 95% CI, 0.015–0.71, respectively), while BMI and HDL were associated with TRP concentrations (B = 0.937; 95% CI, 0.038–1.836; B = –0.234; 95% CI, –0.423 to –0.046, respectively) (Supplementary material, Table S2).
Discussion
The alterations in downstream KP metabolite concentrations in T1D patients have been investigated in very few studies, which showed conflicting results. The main finding of our study was identification of a specific shift in the KP metabolism toward excessive formation of 3‑HKYN with parallel reduction in AA formation in the T1D group. Interestingly, higher AA concentrations but lower KYN concentrations were observed in the patients with better metabolic control of diabetes.
T1D patients and healthy controls did not differ in terms of sex, age, BMI, and blood pressure. This confirms the validity of the results, and indicates a relationship between activation of the KP and T1D. However, at this stage of research, it is unknown whether TRP metabolites are involved in the pathogenesis of diabetes or are a consequence of the disease.
Tryptophan
TRP is an exogenous amino acid, and its serum concentration mainly reflects dietary habits. There are only 3 studies that assessed TRP concentrations in T1D patients. Decreased TRP concentrations were observed in patients with diabetic ketoacidosis,12 and in those with poor metabolic control of diabetes.13 On the other hand, Oxenkrug et al14 showed higher TRP concentrations in individuals with T1D. In our study, we observed an increase in TRP concentrations in the T1D group. It cannot be ruled out that this is due to dietary recommendations for patients with T1D, which include many products rich in TRP. Moreover, TRP concentrations correlated positively with the parameters reflecting visceral obesity, TG concentrations, and BMI in the T1D group, despite normal BMI in these patients. Interestingly, such correlations were not observed in the control group (data not shown). Multivariate regression analysis showed that TRP concentrations were most influenced by BMI and HDL levels in the T1D group. Our results are consistent with the published data6 showing an association between higher TRP concentrations and the diagnostic criteria for metabolic syndrome.
Kynurenine
Increased KYN levels in the T1D group, as compared with controls, has been observed. Moreover, a strong positive correlation between KYN concentrations and HbA1c and TG levels was shown. Higher KYN concentrations were associated with worse metabolic control of diabetes and appeared to increase with the duration of diabetes, irrespective of age, BMI, or GFR. This may be due to increased formation of advanced glycation end‑products in T1D patients with poor glycemic control.15 This leads to overproduction of reactive oxygen species and release of proinflammatory cytokines. The increase in proinflammatory cytokines, such as interleukin (IL)-1, IL‑6, and interferon-γ, stimulates IDO activity in many organs and peripheral tissues, leading to enhanced KYN synthesis.5 The observed serum concentrations of KYN could also result from higher plasma TRP concentrations.
The serum KYN concentration depends on its synthesis, glomerular filtration, and metabolic transformations. Higher plasma KYN concentrations were associated with higher albuminuria in the T1D population.16 Diabetic nephropathy, which is a common complication of diabetes and aggravates with the duration of the disease, leads to impaired renal excretion of various metabolites.
Indirect evaluation of KP enzyme activities showed a decrease in the activity of IDO, TDO, and kynureninase. IDO is involved in the mechanisms of acquired peripheral immune tolerance. Clinical trials showed a decrease in IDO‑1 expression in β cells and peripheral blood mononuclear cells of T1D patients.17 It was also demonstrated that the duration of T1D positively correlated with the degree of IDO activity loss.5 Gürcü et al13 examined the concentrations of TRP, KYN, and KYN/TRP ratio in the serum of T1D patients and showed their lower concentrations and nonaltered ratio in comparison with controls. However, the study group consisted of patients with higher HbA1c and shorter duration of diabetes than ours, which might explain these differences. Another study comparing the TRP catabolism in the patients with T1D and diabetic neuropathic pain (DNP) (n = 13) and individuals without neuropathy (n = 8) reported higher KYN/TRP ratio and a positive correlation with pain severity in the DNP group.18 The patients in the DNP group presented 40% higher serum interferon-γ levels than those in the control group, which can indicate a coexisting inflammatory process in diabetic neuropathy. In our study, there were no significant differences in serum concentrations of all KP metabolites in the patients with and without diabetic complications, which might be explained by the limited number of cases with complications (n = 13; 26%).
Anthranilic acid
Our research revealed a significant decrease in AA concentrations in the T1D patients in comparison with the control group. It also demonstrated a positive correlation of this metabolite with the pancreatic endocrine reserve and a negative correlation with the WHR value. In contrast, Oxenkrug et al14 showed higher AA concentration in T1D patients than in healthy individuals, and suggested it might be considered a biomarker of T1D. These discrepancies could be partially due to a different size of the study populations, as the abovementioned study assessed a group of 15 T1D patients. Additionally, a lack of a detailed description of the study group, such as the age of the participants, BMI, duration of diabetes, and diabetes metabolic control parameters, could affect the results, making it difficult to compare with other studies. Furthermore, in the group of patients treated with MDIs and characterized by worse metabolic control of diabetes, we observed lower AA levels than in the CSII‑treated group, while there were no differences in the concentration of other KYNs. Hoffman et al12 showed an interesting pattern of changes in KP metabolite concentrations during ketoacidosis in a cohort of adolescents with T1D, as they compared KYN concentrations at 3 time points. At the time of the T1D diagnosis accompanied by high glucose values, lower concentrations of TRP, KYN, QA, and XA were observed. In contrast, AA concentrations were the highest at the beginning of the ketoacidosis, and were decreasing over time. These results suggest that AA may be a compound with antidiabetic properties, and its decrease may reflect the metabolic control of diabetes.
3‑Hydroxykynurenine
3‑HKYN has not yet been well studied in T1D. However, studies conducted in patients with T2D have shown elevated levels of 3‑HKYN, and their positive correlation with impaired glucose tolerance, which is also observed in T1D, especially of long duration.19,20 Similarly, we observed higher serum concentrations of 3‑HKYN in the patients with T1D than in the controls.
Study limitations
An important limitation of this study was the small number of participants. Additionally, the lack of serum KYNA, XA, and QA concentrations made it difficult to assess changes in all KP metabolites in T1D. We also did not conduct a nutritional questionnaire, so we did not obtain information on TRP consumption.
Conclusions
Upregulation of the KP increases degradation of TRP with simultaneous changes in serum levels of several metabolites in T1D patients. Our findings suggest an impairment of the protective mechanisms through a decreased formation of AA, and an unfavorable change in the KYN transformation toward enhanced synthesis of 3‑HKYN, and further formation of its neurotoxic metabolites, such as QA and XA, which may contribute to developing diabetic complications in the patients with T1D.
- Ga G, Tig R, Se L, et al. Global incidence, prevalence, and mortality of type 1 diabetes in 2021 with projection to 2040: a modelling study. Lancet Diabetes Endocrinol. 2022; 10: 741‑760. | Crossref
- Cieluch A, Araszkiewicz A, Naskręt D, et al. Metabolic control and presence of chronic complications of type 1 diabetes mellitus: 25 years of the Poznan Prospective Study. Pol Arch Intern Med. 2023; 133: 16534. | Crossref
- Zieleniewska NA, Szum‑Jakubowska A, Chlabicz M, et al. The prevalence of diabetes and prediabetes: a population‑based study. Pol Arch Intern Med. 2023; 133: 16407. | Crossref
- Sibiak R, Mantaj U, Gutaj P, et al. Continuous glucose monitoring parameters in pregnancy‑related complications in patients with type 1 diabetes: a retrospective cohort study. Pol Arch Intern Med. 2023; 133: 16501. | Crossref
- Krupa A, Kowalska I. The kynurenine pathway‑new linkage between innate and adaptive immunity in autoimmune endocrinopathies. Int J Mol Sci. 2021; 22: 9879. | Crossref
SUPPLEMENTARY MATERIAL
ARTICLE INFORMATION