Treatment regimens and disease activity could alter salivary myeloperoxidase levels in patients with inflammatory bowel diseases
Key words: disease activity, endoscopic assessment, myeloperoxidase, saliva, ulcerative colitis


 CC BY-NC-SA 4.0
Treatment regimens and disease activity could alter salivary myeloperoxidase levels in patients with inflammatory bowel diseases
Introduction: Inflammatory bowel diseases (IBDs) present with alternating periods of exacerbation and remission; therefore, it is necessary to develop noninvasive diagnostic tools to control the disease activity and improve therapeutic effectiveness. Recently, we have found that patients with ulcerative colitis (UC) who qualified for biologic therapy had significantly lower salivary myeloperoxidase (MPO) levels.
Objectives: This cross‑sectional study aimed to assess the impact of IBD activity and applied treatment on salivary antioxidant system as reflected by the levels of catalase, total antioxidant status, and MPO.
Patients and methods: The study group comprised 99 patients diagnosed with Crohn disease (CD) and 61 patients with UC. The Crohn Disease Activity Index and modified Mayo scale were used to estimate the clinical activity of CD and UC, respectively. Unstimulated whole mixed saliva was collected. Salivary levels of selected markers were measured with enzyme‑linked immunosorbent assays and colorimetric assays.
Results: The patients with clinically active UC showed significantly decreased median (interquartile range) salivary MPO levels (79.4 [30.1–157.5] vs 94.8 [58.2–274.7] ng/ml) with significant correlations with the endoscopic stage on the Mayo scale (R = 0.423; P = 0.02). Receiver operating characteristic analysis confirmed a potential usefulness of MPO concentrations in predicting clinically active UC (area under the curve = 0.654; P = 0.03; cutoff <210.4 ng/ml). Moreover, in the patients treated with biologics and without steroid therapy, salivary MPO concentrations negatively correlated with neutrophil counts in the individuals with UC and positively with C‑reactive protein level in the patients with CD.
Conclusions: Salivary MPO levels changed depending on the disease activity in the patients with UC. Decreased MPO concentration in the saliva could be a predictor of clinically active UC.
What's new?
To our knowledge, this is the first cross‑sectional study in Polish patients with inflammatory bowel diseases (IBDs) that assesses the impact of the disease activity and applied treatment on salivary antioxidant system parameters, including myeloperoxidase (MPO). We found that lowered salivary MPO concentrations could be a predictor for a noninvasive diagnosis of clinically active ulcerative colitis, and that they significantly correlated with endoscopic severity of the disease in these patients. Also, only the patients treated with biologics and not steroids demonstrated significant correlations between salivary MPO and selected blood parameters reflecting their inflammatory status. Our findings suggest that salivary MPO could be used to monitor IBD activity and treatment effectiveness.
Introduction
In the treatment of inflammatory bowel diseases (IBDs), the primary goal is to achieve and maintain clinical remission without the use of steroids. In patients with ulcerative colitis (UC), the first‑line induction treatment includes 5‑aminosalicylic acid derivatives (mesalazine and sulfasalazine), with or without corticosteroids. In IBD patients with treatment failure and steroid resistance or intolerance, thiopurines are primarily administered. In the cases nonresponsive to a standard therapy, biologics, such as infliximab, adalimumab, vedolizumab, and ustekinumab, are recommended.1-5 Moreover, in patients with UC, new small‑molecule drugs, such as Janus kinase inhibitors and sphingosine‑1‑phosphate receptor modulators, have been administered.6,7
In the active forms of Crohn disease (CD) and UC, the mucosal barrier is damaged by intestinal inflammatory processes.8 This is caused by enhanced neutrophil infiltration, which is a specific histologic feature of IBD.9,10 Neutrophil recruitment and accumulation in the gastrointestinal wall lead to the production of reactive oxygen species (ROS) and proinflammatory cytokines.11,12 Maintaining a balance between ROS and endogenous antioxidant levels is crucial for gut mucosal integrity.13 Myeloperoxidase (MPO) released from activated neutrophils is a fundamental enzyme for the formation of neutrophil extracellular traps.14 Additionally, it plays a key role in bacteria killing and ROS‑induced inflammatory processes.15,16 In addition to systemic prooxidative action, MPO exhibits antioxidant properties, especially in saliva. As an enzyme from the group of peroxidases, it belongs to the salivary enzymatic antioxidant system.17-20 Extracellular MPO activity reflects oxidative stress in inflammatory diseases. While MPO expression or protein level measurements can give some information concerning the abundance of MPO molecules, the enzymatic activity of MPO can vary considerably between individuals, even if the amount of MPO is similar.21 MPO activity does not always correspond to MPO protein or expression level.22 Age, sex, and multiple polymorphisms can alter MPO activity.21,23
Recently, the number of patients with IBD in different regions of the world, including Poland, has been increasing, and the chronic course of IBD has had a significant impact on patients’ quality of life.24 IBDs are associated with alternating periods of exacerbation and remission; therefore, it is necessary to identify diagnostic tools to control the disease activity and improve treatment effectiveness. In addition to standard invasive methods, such as colonoscopy, international guidelines encourage the search for auxiliary noninvasive biomarkers that could be used to monitor treatment outcomes.25-27 Previous studies have shown that fecal MPO may positively correlate with the disease activity and progression or healing of endoscopic lesions during IBD therapy.28,29 Chami et al30 speculated that MPO could be a potential therapeutic target for protecting the colon tissues from inflammatory injury.
Recently, we have observed that patients with UC demonstrated significantly decreased salivary MPO levels, which increased to the levels comparable to control as a result of the induction phase of a biologic therapy.31,32 However, we included only IBD patients with active disease eligible for biologic therapy, and did not consider other therapeutic regimens or patients in remission. Therefore, this cross‑sectional study aimed to assess the impact of IBD activity and treatment on salivary antioxidant system, as reflected by MPO, catalase (CAT), and total antioxidant status (TAS) levels.
Patients and methods
Study participants
The study group included 160 adult patients of both sexes, with IBD, hospitalized at the Department of Gastroenterology, Dietetics and Internal Medicine, Poznan University of Medical Sciences, between July 2022 and February 2023. Of the eligible patients, 99 were diagnosed with CD and 61 with UC. IBD diagnosis was based on the clinical picture of the disease, endoscopic and / or radiologic appearance of inflammatory lesions in the gastrointestinal tract, and histologic assessment of biopsies taken during endoscopy, after exclusion of other etiologies (mainly infectious) of the inflammation.33,34 The exclusion criteria included concomitant autoimmune diseases (including diabetes), pregnancy, use of medications affecting salivary secretion, periodontal disease, and other active inflammatory foci in the oral cavity.
The Crohn Disease Activity Index (CDAI) scale35 and modified Mayo scale36 were used to estimate the clinical activity of CD and UC, respectively. Clinical remission was determined at a maximum of 150 points for CD and at a maximum of 2 points for UC. In the patients with UC, endoscopic assessment was performed by a gastroenterologist experienced in IBD, using the endoscopic Mayo score, in which score 0 reflected a normal appearance of the colonic mucosa (inactive disease); score 1 reflected the presence of erythema, decreased vascular pattern, and mild friability of the colonic mucosa; score 2 reflected the presence of marked erythema, mucosal frailty and erosions, and absence of vascular pattern; and score 3 reflected the presence of ulcerations or spontaneous mucosal bleeding.
Routine laboratory tests were also performed. Fasting venous blood samples were collected in the morning to determine the following laboratory parameters: C‑reactive protein (CRP) and hemoglobin level, and white blood cell (WBC) and platelet count.
Saliva collection and analysis
Unstimulated whole mixed saliva samples were collected as previously described.37 Briefly, the saliva was collected in the morning at least 2 hours after a meal by passive drooling for 20 minutes. Then, the saliva was centrifuged to remove any debris, aliquoted, and placed at −80 °C until assayed.
In the laboratory analysis, the saliva samples were blinded to the sequential numbers. All analyses were performed by a single laboratory technician, and the plates were prepared for analysis according to a set schedule.
Salivary levels of selected markers were measured using enzyme‑linked immunosorbent assay (MPO) and colorimetric assays (TAS, CAT), according to the manufacturer’s instructions (Table 1). After the assay procedures, absorbance readouts were executed at recommended wavelengths with a microplate reader Varioskan LUX (Thermo Scientific, Waltham, Maryland, United States). TAS determination was based on measuring the absorbance of oxidized 2,2'-azino‑bis(3‑ethylbenzothiazoline‑6‑sulfonic acid), which can be reduced by antioxidants (Trolox, an analog of vitamin E, was used as the reference antioxidant).
Analyte | Manufacturer | Catalog number | Sensitivity | Absorbance wavelength, nm |
Myeloperoxidase (concentration) | Bio‑Techne, R&D Systems
(Minneapolis, Minnesota, United States) | DY3174 | 6.25 ng/ml | 450 |
Total antioxidant status | Elabscience (Houston, Texas, United States) | E‑BC‑K801‑M | 0.23 mM/l | 660 |
Catalase (activity) | Life Technologies Corporation (Frederick, Maryland, United States) | EIACATC | 0.052 U/ml | 560 |
To detect MPO activity, we used the methods described by Suzuki et al38 and Pulli et al.39 Briefly, 10 µl of saliva were mixed with 80 µl of 0.75 mM hydrogen peroxide (Merck, Darmstadt, Germany) and 110 µl of 3,3',5,5'-tetramethylbenzidine (TMB) solution (Merck) containing 2.9 mM TMB in 14.5% dimethyl sulfoxide (Merck) and 150 mM sodium phosphate buffer pH 5.4 (Merck). The plate was incubated at 37 °C for 5 minutes. The reaction was stopped by adding 50 µl of 2 M sulfuric acid (Merck). The optical density (OD) was measured at 450 nm. Each measurement was accompanied by a negative control (phosphate buffer pH 5.4) and a positive control (MPO). The results of MPO activity were expressed as OD.
Statistical analysis
Because the data did not follow a normal distribution (as determined by the Shapiro–Wilk test), medians and interquartile ranges (IQRs) were used for descriptive statistics, and the nonparametric Mann–Whitney test was used for comparisons. Spearman rank coefficients were determined for correlation analysis. Receiver operating characteristic (ROC) analysis was performed to assess the predictive power, and the cutoff values were determined according to the Youden index. The significance level for all analyses was set at a P value below 0.05. The statistical analyses were performed using Statistica 13.3 package (Statsoft, Kraków, Poland).
Ethical considerations
This study was conducted in accordance with the guidelines of the Declaration of Helsinki, and approved by the Bioethics Committee of Poznan University of Medical Sciences (1266/18). Informed consent was obtained from all participants involved in the study.
Results
Patient characteristics
Detailed patient characteristics by IBD form are presented in Table 2.
Parameter | CD (n = 99) | UC (n = 61) | ||
Active (n = 46) | Remission (n = 53) | Active (n = 34) | Remission (n = 27) | |
Data are presented number (percentage) or median (interquartile range) unless indicated otherwise.
SI conversion factors: to convert hemoglobin to g/l, multiply by 10.
Abbreviations: BMI, body mass index; CD, Crohn disease; CDAI, Crohn Disease Activity Index; CRP, C‑reactive protein; HGB, hemoglobin; IFX, infliximab; LYM, lymphocytes; NEU, neutrophils; PLT, platelets; UC, ulcerative colitis; VZD, vedolizumab; WBC, white blood cells | ||||
Demographic and anthropometric parameters | ||||
Women | 18 (39.1) | 19 (35.8) | 16 (47.1) | 5 (18.5) |
Age, y | 36 (28–44) | 29 (21–38) | 36.5 (28–49) | 30 (26–38) |
BMI, kg/m2 | 21.6 (19.8–24.6) | 22 (19.9–26.2) | 22.5 (20.7–26.8) | 23.7 (20.4–28.1) |
Smokers | 12 (26.1) | 15 (28.3) | 4 (11.7) | 3 (11.1) |
Disease‑related parameters | ||||
Steroids | 19 (41.3) | 2 (3.8) | 28 (82.4) | 4 (14.8) |
Immunosuppressants (thiopurines) | 14 (30.4) | 12 (22.6) | 11 (32.4) | 5 (18.5) |
Biologics | 16 (34.8) | 49 (92.5) | 10 (29.4) | 24 (88.9) |
IFX | 12 (26.1) | 40 (75.5) | 4 (11.8) | 13 (48.1) |
VZD | 1 (2.2) | 7 (13.2) | 6 (17.6) | 10 (37) |
Other | 3 (6.5) | 2 (3.7) | – | 1 (3.7) |
Severity of disease (CDAI for CD and Mayo scale for UC) | 319 (244.3–360.6) | 87.9 (67.7–102.6) | 8 (6–9) | 1 (1–2) |
Disease duration, y | 9 (5–13) | 7 (5–12) | 6.5 (2–13) | 7 (5–12) |
Selected complete blood count parameters | ||||
CRP, mg/l | 12.9 (3.7–41.7) | 1.7 (0.6–5.2) | 8 (0.7–22.9) | 1.3 (0.7–4) |
WBC, × 103/µl | 7.5 (6.1–9.2) | 6.7 (5.6–8.2) | 8.2 (6.5–9.3) | 6.7 (5.1–7.6) |
NEU, × 103/µl | 5.0 (3.7–6.4) | 3.8 (3–5) | 4.9 (4.1–7.1) | 3.5 (2.9–4.2) |
LYM, × 103/µl | 1.6 (0.9–2.1) | 1.8 (1.4–2.4) | 1.4 (1.0–2.2) | 1.8 (1.6–2.5) |
HGB, g/dl | 12.4 (10.6–13.8) | 14.2 (13–14.9) | 11.5 (10.2–12.9) | 14.5 (13.2–15.5) |
PLT, × 103/µl | 332 (263–422) | 271 (234–294) | 320.5 (274–382) | 260 (227–300) |
Comparative analysis of the selected salivary markers
First, we compared the levels of selected markers in the saliva according to the form of IBD and its clinical activity (Table 3). There were no significant differences in any of the selected markers between the patients with CD and those with UC. Only MPO activity was bordeline significantly lower in the individuals with active UC, as compared with the patients with active CD. In terms of the disease activity, only the patients with UC demonstrated significantly higher MPO concentrations in remission than in the active phase. The TAS showed a similar trend in these patients, but it was not significant. However, considering only the remission associated with the patient‑reported outcome or endoscopic assessment, there was no significant difference in any of the salivary parameters (Table 4).
Parameter | Disease clinical activity | P value | ||
Active CD (n = 46) UC (n = 34) | Remission CD (n = 53) UC (n = 27) | |||
Data are presented as median (interquartile range).
a Significant difference for the Mann–Whitney test
Abbreviations: CAT, catalase; MPO, myeloperoxidase; OD, optical density; TAS, total antioxidant status; others, see Table 2 | ||||
MPO, ng/ml | CD | 100.5 (45.2–199.5) | 97.1 (52.6–161.1) | 0.94 |
UC | 79.4 (30.1–157.5) | 94.8 (58.2–274.7) | 0.046a | |
P value | 0.41 | 0.22 | ||
MPO activity, OD | CD | 0.249 (0.164–0.403) | 0.2 (0.147–0.294) | 0.2 |
UC | 0.153 (0.089–0.403) | 0.245 (0.164–0.356) | 0.09 | |
P value | 0.07 | 0.38 | ||
CAT, U/ml | CD | 5.94 (5.39–6.21) | 5.88 (5.46–6.15) | 0.98 |
UC | 5.83 (5.26–6.25) | 5.86 (5.56–6.12) | 0.86 | |
P value | 0.77 | 0.87 | ||
TAS, mM/l | CD | 1.06 (0.43–1.45) | 1.15 (0.49–1.66) | 0.51 |
UC | 0.8 (0.13–1.25) | 1.05 (0.35–1.5) | 0.17 | |
P value | 0.21 | 0.85 | ||
Parameter | Disease activity | P value | ||
Active PRO‑2 (n = 50) Endoscopic (n = 38) | Remission PRO‑2 (n = 11) Endoscopic (n = 23) | |||
Data are presented as median (interquartile range).
Abbreviations: PRO‑2, patient‑reported outcome; others, see Table 3 | ||||
MPO, ng/ml | PRO‑2 | 88.1 (35.9–179.4) | 92.1 (45–230.3) | 0.66 |
Endoscopic | 93.3 (31–163.3) | 88.4 (50.1–234.2) | 0.27 | |
MPO activity, OD | PRO‑2 | 0.19 (0.106–0.403) | 0.245 (0.1–0.356) | 0.55 |
Endoscopic | 0.163 (0.09–0.403) | 0.219 (0.155–0.355) | 0.39 | |
CAT, U/ml | PRO‑2 | 5.85 (5.27–6.19) | 5.84 (5.56–6.11) | 0.84 |
Endoscopic | 5.8 (5.27–6.24) | 5.86 (5.56–6.12) | 0.86 | |
TAS, mM/l | PRO‑2 | 0.93 (0.35–1.46) | 0.9 (0.01–1.85) | 0.88 |
Endoscopic | 0.92 (0.25–1.5) | 0.94 (0.22–1.47) | 0.71 | |
Correlation analysis of the selected salivary markers
When examining the relationship between the antioxidants, a positive correlation between MPO activity and MPO concentration was observed in the patients with active CD and in the patients with UC in remission. In addition, MPO levels positively correlated with CAT in the patients with CD, regardless of the disease activity. In contrast, in the patients with UC, the only negative correlation was found for TAS in the case of clinically active disease (Table 5).
MPO activity, OD | CAT, U/ml | TAS, mM/l | |||
a Significant correlation for P <0.05
| |||||
CD | Clinically active disease | MPO, ng/ml | 0.518a | 0.352a | 0.275 |
MPO activity, OD | – | 0.21 | 0.45a | ||
CAT, U/ml | – | – | 0.368a | ||
Clinical remission | MPO, ng/ml | 0.185 | 0.286a | –0.11 | |
MPO activity, OD | – | 0.357a | 0.04 | ||
CAT, U/ml | – | – | 0.087 | ||
UC | Clinically active disease | MPO, ng/ml | 0.154 | –0.006 | –0.38a |
MPO activity, OD | – | 0.265 | 0.227 | ||
CAT, U/ml | – | – | 0.047 | ||
Clinical remission | MPO, ng/ml | 0.403a | –0.017 | 0.071 | |
MPO activity, OD | – | 0.204 | 0.271 | ||
CAT, U/ml | – | – | 0.158 | ||
No significant correlations were found between the levels of selected salivary markers and total disease activity on the CDAI and Mayo scales (Table 6). Interestingly, in the patients with active UC, a significant positive correlation was observed between the MPO concentrations and the progression of endoscopic lesions on the Mayo scale (R = 0.423; P = 0.02), and a significant negative correlation was observed for TAS (R = –0.356; P = 0.04). No significant correlations were found in the overall UC group and the patients in clinical remission. Futhermore, salivary parameters did not significantly differ between the patients with and without endoscopic remission (Table 4). All the patients with UC in endoscopic remission showed also clinical remission.
The correlations between the levels of salivary markers and selected complete blood count parameters are presented in Table 7. The majority of correlations were observed for MPO concentrations. Notably, the correlations with CRP levels in the patients with CD were positive for MPO level in the patients in remission, especially in the individuals treated biologically and without steroid therapy, and negative for TAS level in the same group. In the patients with UC, MPO level negatively correlated with neutrophil counts in the individuals treated biologically and without steroid therapy. In contrast, TAS level negatively correlated with WBC counts in the patients with active UC.
MPO, ng/ml | MPO activity, OD | CAT, U/ml | TAS, mM/l | ||
a Significant for P <0.05
b Not significant for P <0.1
| |||||
CD | Clinically active disease | – | – | – | HGB (0.385)a, LYM (0.273)b |
Clinical remission | PLT (0.412)a, CRP (0.253)b | CRP (0.243)b | CRP (0.238)b | CRP (–0.279)a, WBC (0.246)b | |
Remission without steroids | CRP (0.281)a, PLT (0.388)a | CRP (0.234)b | CRP (0.245)b | CRP (–0.259)b | |
Remission with biologics | CRP (0.298)a, PLT (0.452)a | CRP (0.268)b | CRP (0.241)b | CRP (–0.341)a, WBC (0.241)b | |
UC | Clinically active disease | – | – | – | WBC (–0.417)a, NEU (–0.463)a |
Clinical remission | – | – | – | – | |
Remission without steroids | WBC (–0.422)a, NEU (–0.41)b, LYM (–0.409)b | – | – | – | |
Remission with biologics | WBC (–0.444)a, NEU (–0.405)a | – | – | – | |
Receiver operating characteristic analysis
ROC analysis confirmed the potential usefulness of MPO level in predicting the clinically active form of UC (Figure 1). The proposed cutoff concentration (<210.4 ng/ml) was characterized by high sensitivity and low specificity (93.5% and 37%, respectively).
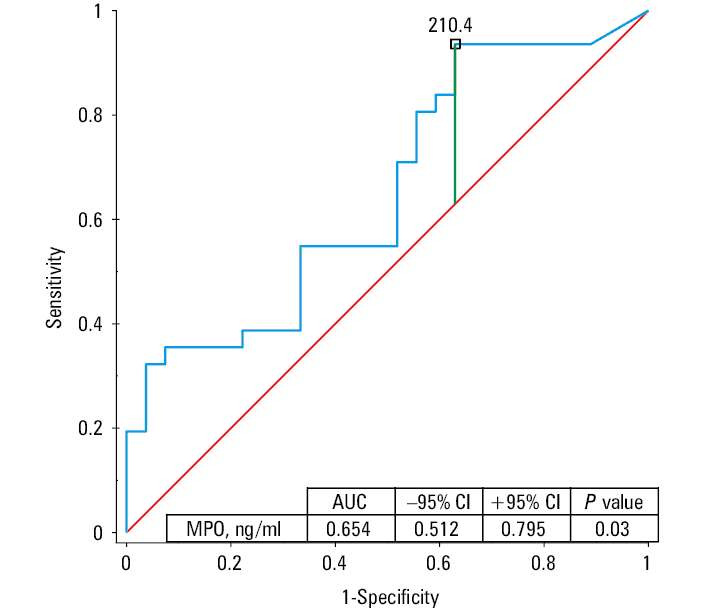
Abbreviations: AUC, area under the curve
Discussion
To the best of our knowledge, this is the first cross‑sectional study to evaluate the changes in salivary antioxidant system parameters, including MPO, in the patients with CD and UC in the active phase and in remission, taking into account the potential impact of different treatments. We found that decreased MPO concentrations in the saliva could be a predictor of clinically active UC. Importantly, salivary MPO levels closely correlated with the endoscopic severity of the intestinal mucosa lesions in the patients with clinically active UC. Interestingly, the observed correlations between the levels of salivary markers and selected complete blood count parameters differed according to the IBD treatment. In the patients with UC, MPO level negatively correlated with neutrophil counts, whereas in the patients with CD, it positively correlated with CRP levels during remission, especially in the individuals treated with biologics and not steroids.
Our previous studies focused only on MPO concentrations in the saliva of patients with IBD. In the individuals who qualified for biologic treatment, salivary MPO and CAT levels were significantly decreased. In this group, salivary MPO level appeared to be more potent in differentiating between the patients with CD and those with UC, irrespective of its total protein content in the saliva.31 The observed changes in antioxidant levels were not related to oral health status assessed at that time. The qualified patients demonstrated good indicators of both oral hygiene and dental and gingival health.40
Furthermore, after the induction phase of the biologic treatment, only the patients with UC who responded satisfactorily to this therapy showed a significant increase in the salivary MPO levels comparable to those in control participants.32 There was also no significant correlation between salivary MPO levels and the disease activity before initiation of the therapy. The subjective components included in the disease activity scales may limit their association with the antioxidant parameters.
Other researchers have assessed the levels of different antioxidants in the saliva depending on the disease activity, especially in patients with CD. Jahanshahi et al41 reported elevated oxidative stress, reflected by reduced antioxidant capacity and increased malondialdehyde levels in the saliva of patients with CD but not with UC. Similarly, Janšáková et al42 detected a reduction in antioxidant capacity and lactoferrin levels, accompanied by decreased unstimulated salivation. However, no difference in MPO concentrations was observed.
In the patients with active CD, Szczeklik et al43 found decreased salivary and serum levels of the reduced form of glutathione and reduced CAT activity. Moreover, these parameters significantly negatively correlated with CDAI (R = –0.5). A similar correlation with the clinical activity for only plasma superoxide dismutase (SOD) was previously determined by the same authors. No significant relationship with CDAI was noted for glutathione peroxidase (GPx) activity in the saliva or plasma.44
Most studies assessing MPO levels in the patients with IBD according to the disease activity have used feces as the biological material. In the patients with active IBD investigated by Saiki et al,45 significantly elevated fecal MPO levels correlated with endoscopic grade and laboratory parameters. After resolution of IBD exacerbation, MPO concentrations decreased. Wagner et al46 stated that fecal calprotectin and MPO levels could be predictors of treatment outcomes in the patients with CD and UC. Peterson et al47 showed analogous findings regarding fecal MPO examination complementing endoscopic evaluation in the daily care of patients with UC.
Similarly, Masoodi et al48 observed significantly higher fecal MPO levels in the patients with active UC, with a decrease during follow‑up. However, correlations between the endoscopic extent and activity scores were not noted. In contrast, the most recent study by Swaminathan et al29 concluded that fecal MPO could be an accurate biomarker for the evaluation of endoscopic activity, and the prediction of moderate‑to‑severe disease activity with a more complicated IBD course in the patients with CD and UC.
Only a few studies have assessed MPO activity in tissue biopsies collected during surgical interventions. Zielińska et al49 observed significantly decreased SOD activity and increased CAT activity in the colonic tissues. In the patients with CD, GPx activity was significantly lower, while no differences in TAS were observed. Moreover, antioxidant parameters did not correlate with the disease activity, pain score, or the disease duration.
In a recent study by Schroder et al,50 transitional and diseased specimens demonstrated greater MPO‑positive immunostaining than unaffected specimens from patients with CD. The authors speculated that excessive MPO‑mediated production of hypochlorous acid exacerbated the course of CD by causing host intestinal tissue damage.
A potential limitation of this study is a lack of precise determination of oral hygiene and periodontal status indices. However, our previous studies in the patients with IBD showed good oral hygiene and gingival health in this group; therefore we limited the screening for potential inflammatory foci in the oral cavity.
Conclusions
Salivary levels of MPO, a representative of antioxidant system, change depending on the disease activity and the treatment used in patients with IBD. Significantly decreased salivary MPO levels and significant correlations with the endoscopic stage of the intestinal lesions were observed in the patients with clinically active UC. Moreover, in the patients treated with biologics and without steroid therapy, salivary MPO levels were related to CRP levels in CD and neutrophil count in UC.
- Eder P, Łodyga M, Gawron‑Kiszka M, et al. Guidelines for the management of ulcerative colitis. Recommendations of the Polish Society of Gastroenterology and the Polish National Consultant in Gastroenterology. Gastroenterology Rev. 2023; 18: 1‑42. | Crossref
- Łodyga M, Eder P, Gawron‑Kiszka M, et al. Guidelines for the management of patients with Crohn’s disease. Recommendations of the Polish Society of Gastroenterology and the Polish National Consultant in Gastroenterology. Gastroenterology Rev. 2021; 16: 257‑296. | Crossref
- Kucha P, Zagórowicz E, Walkiewicz D, et al. Biologic treatment of inflammatory bowel disease in Poland, 2012‑2020: nationwide data. Pol Arch Intern Med. 2022; 132: 16287. | Crossref
- Raine T, Bonovas S, Burisch J, et al. ECCO Guidelines on Therapeutics in Ulcerative Colitis: medical treatment. J Crohns Colitis. 2022; 16: 2‑17. | Crossref
- Torres J, Bonovas S, Doherty G, et al. ECCO Guidelines on Therapeutics in Crohn’s Disease: medical treatment. J Crohns Colitis. 2020; 14: 4‑22. | Crossref
ARTICLE INFORMATION