Subcutaneous adipose tissue expression of genes associated with glucocorticoid action: relationship with insulin sensitivity, obesity, and weight loss


 CC BY-NC-SA 4.0
Subcutaneous adipose tissue expression of genes associated with glucocorticoid action: relationship with insulin sensitivity, obesity, and weight loss
Introduction
Glucocorticoids are steroid hormones that regulate multiple metabolic and inflammatory processes. Chronic glucocorticoid excess, for instance in Cushing syndrome, resembles metabolic syndrome, with central obesity, hypertension, dyslipidemia, and glucose intolerance.1 However, in the general population, associations between circulating cortisol and adiposity measures were reported to be U‑shaped.1
Tissue‑specific cortisol availability is regulated by a local activity of 11β-hydroxysteroid dehydrogenase type 1 (HSD11B1), which converts cortisone to cortisol, and 11β-hydroxysteroid dehydrogenase type 2 (HSD11B2), which oxidizes cortisol to inactive cortisone. Glucocorticoids exert their action through an intracellular glucocorticoid receptor (GR), which is a transcriptional activator. GR is encoded by the NR3C1 gene, and its predominant form is subunit α (GRα), which is a functionally active receptor generated via splicing of exon 8 to the proximal part of exon 9.2
In adipose tissue, glucocorticoid‑enhanced lipolysis occurs mainly in peripheral fat depots. In abdominal fat, proadipogenic and prolipogenic actions may prevail. In Chub‑S7 cells, glucocorticoids decreased lipogenesis, however, low‑dose dexamethasone pretreatment augmented insulin‑mediated stimulation of lipogenesis.3
Glucocorticoids may decrease insulin sensitivity.1 Insulin‑desensitizing glucocorticoid effects occur mainly in the skeletal muscle and liver. Data about insulin‑desensitizing glucocorticoid action in abdominal subcutaneous adipose tissue (SAT) come mainly from rodent studies. In human cultured subcutaneous adipocytes, glucocorticoids increased insulin signal transduction pathway and insulin‑stimulated glucose uptake.4 Overnight hydrocortisone infusion administered to healthy volunteers induced systemic insulin resistance, but failed to cause SAT insulin resistance.5 Given the differential effect of glucocorticoids on lipogenesis,3 it is possible that glucocorticoid action in SAT may depend on metabolic conditions, such as insulin concentration.
Increased abdominal SAT HSD11B1 expression and / or enzyme activity in obesity and insulin resistance were demonstrated in humans.6,7 There are limited data on decreased abdominal SAT GRα expression in obesity.8
Data on the potential effects of insulin and / or free fatty acids (FFAs) on SAT HSD11B1 expression are limited and equivocal.7,9 Data on a decrease in abdominal SAT HSD11B1 expression and / or HSD11B1 activity after weight loss come mainly from bariatric surgery reports,10 whereas studies focused on the effects of dietary interventions on SAT HSD11B1 expression yielded conflicting results.11,12
Given the equivocal data on the role of glucocorticoids in abdominal SAT, it seems reasonable to study abdominal SAT expression of the genes associated with glucocorticoid action in relation to obesity and insulin sensitivity in individuals without potential confounding factors, such as morbid obesity and hyperglycemia. Such an approach may allow for the estimation of early dysregulation of abdominal SAT glucocorticoid gene expression in relation to insulin resistance. Furthermore, to better understand the relationship between glucocorticoids in abdominal SAT and insulin resistance, we decided to assess the influence of hyperinsulinemia and FFA‑induced insulin resistance on abdominal SAT expression of the genes associated with glucocorticoid action. We also analyzed SAT expression of these genes in the conditions of improved insulin sensitivity, associated with diet‑induced weight loss, which leads to health benefits in patients with obesity.13
The aim of this study was to analyze the relationship between abdominal SAT expression of the genes associated with glucocorticoid action and insulin sensitivity and obesity, obesity regulation by insulin, FFA‑induced insulin resistance, and weight‑reducing dietary interventions.
Patients and methods
This study describes the results from 2 study protocols.
The study group 1 comprised 101 young individuals, 54 with normal weight (body mass index [BMI] <25 kg/m2; 39 men and 15 women; mean [SD] age, 22.83 [2.24] years; mean BMI, 22.46 [1.53] kg/m2) and 47 with overweight or obesity (39 men and 8 women; mean age, 24.51 [3.76] years; mean BMI, 28.5 [3.02] kg/m2). This study group was a part of a previously described group,14 where SAT was available for analyses. All participants were nonsmokers, had no diseases other than obesity, and were not taking any drugs. Exclusion criteria included prediabetes or diabetes and morbid obesity. Body weight of the participants remained stable (±1 kg) for at least 3 months prior to the study. All individuals had no clinical or laboratory indicators of inflammation (high‑sensitivity C‑reactive protein, white blood cell count, and fibrinogen were within the normal range) and were not taking anti‑inflammatory drugs within the last 3 months. All participants underwent clinical examination, anthropometric measurements, and appropriate laboratory tests. Oral glucose tolerance test (OGTT) was performed and reveled normal glucose tolerance in all individuals. OGTT and clamp test were performed after an overnight fast.
The study group 2 comprised 38 individuals recruited separately, with marked overweight or obesity (BMI >28 kg/m2; 18 men and 20 women; mean [SD] age, 32.79 [7.38] years; mean [SD] BMI, 32.8 [3.09] kg/m2). The inclusion and exclusion criteria were identical as in the study group 1, with the exception of the upper age limit being 45 years. A detailed study protocol was described previously.15
Both study protocols were approved by the Ethics Committee of the Medical University of Bialystok. A written informed consent was obtained from all volunteers before their participation in the study.
Dietary intervention program (study group 2)
Overweight / obese participants underwent a 12‑week dietary intervention program, in the form of an individually planned low‑calorie diet (20 kcal per kg of proper body weight), as described previously.15 All analyses were performed before and after the dietary intervention.
Data reported in this study cover 38 individuals with overweight / obesity who completed the dietary intervention program and had insulin sensitivity measured both before and after the program.
Measurement of insulin sensitivity and subcutaneous adipose tissue biopsy
In both study groups, insulin sensitivity was measured with the 2‑hour hyperinsulinemic‑euglycemic clamp technique, as described previously.16 Before each clamp, SAT biopsy from the umbilical region was performed in local anesthesia, as described before.14,15
In the study group 1, in a subgroup of 20 men (9 normal‑weight and 11 overweight / obese), with similar clinical characteristics as the respective BMI categories in the entire study group 1, the clamp test was prolonged to 6 hours. After 1 week, another 6‑hour clamp test, with concurrent intralipid / heparin infusion, was performed as described before.16 Intralipid is a lipid emulsion for intravenous infusion. Heparin is given as a stimulator of lipoprotein lipase to hydrolyze triglycerides contained in intralipid and to rapidly rise the concentration of circulating FFAs. SAT biopsies were performed before and after the 6‑hour clamps.
In the study group 2, clamp and SAT biopsy were performed before and after the dietary intervention as described before.15
Serum cortisol was measured with Chemiluminescent Microparticle Immunoassay with the Architect analyzer (Abbott Diagnostics, Abbott Park, Illinois, United States).
Subcutaneous adipose tissue gene expression analysis
RNA purification and gene expression analyses were performed as previously described.14,15 Gene expression was assessed by quantitative polymerase chain reaction using a LightCycler 480 II System (Roche Diagnostics International AG, Rotkreuz, Switzerland). The expression of HSD11B1, HSD11B2, and PGK1 mRNA was measured using validated PrimePCR Probe Assays (Bio‑Rad, Hercules, California, United States): HSD11B1 (qHsaCIP0030952), HSD11B2 (qHsaCEP0054433), and PGK1 (qHsaCEP0050174). For the measurement of GRα expression, we used a TaqMan probe 6‑FAMTGACTCTACCCTGCATGTACGAC‑BHQ1–1, and the following primers: forward, 5′-TGTTTTGCTCCTGATCTGA‑3′, reverse, 5′-TCGGGGAATTCAATACTCA‑3′, as described by Gola et al.2 The reverse primer is specific for GRα, located in exon 9α.2 The probe and the primers for GRα measurement were purchased from the Institute of Biochemistry and Biophysics, Polish Academy of Sciences, Warsaw, Poland. The samples were normalized to the reference PGK1 gene. Relative mRNA expression was presented as fold‑change using the ΔΔCt method. All reactions were performed in triplicate.
Statistical analysis
Statistical analysis was performed with the STATISTICA 12.5 software (Statsoft, Kraków, Poland). Values of continuous variables are presented as arithmetic mean (SD) or geometric mean (geometric SD factor) for variables without normal distribution (gene expression). The variables that did not follow normal distribution were log‑transformed prior to the analyses to achieve normal distribution. Differences between the groups were estimated with the unpaired t test. Differences in the variables before and after each clamp test were assessed with the paired t test (entire group) and with repeated‑measures analysis of variance and the post hoc Tukey test (subgroups of normal‑weight and overweight / obese individuals). Differences in the estimated parameters before and after the weight loss program were assessed with the paired t test. The relationships between variables were studied with the Pearson product moment correlation. The Benjamini–Hochberg correction for multiple comparison was used for all differences and correlations. Multiple regression analysis was performed with insulin sensitivity as a dependent variable and with BMI and SAT HSD11B1 and GRα expression as independent variables. The level of significance was assumed at a P value below 0.05.
Results
Baseline characteristics (study group 1)
Overweight / obese individuals had lower mean (SD) insulin sensitivity in comparison with normal‑weight individuals (5.93 [2.55] vs 7.69 [2.73] mg/kg fat‑free mass [FFM]/min; P = 0.001), whereas morning serum cortisol did not differ between the groups (overweight / obese, 13.78 [3.42] µg/dl vs normal‑weight, 13.41 [3.86] µg/dl).
Baseline subcutaneous adipose tissue HSD11B1, HSD11B2, and GRα expression in normal‑weight and overweight / obese individuals (study group 1)
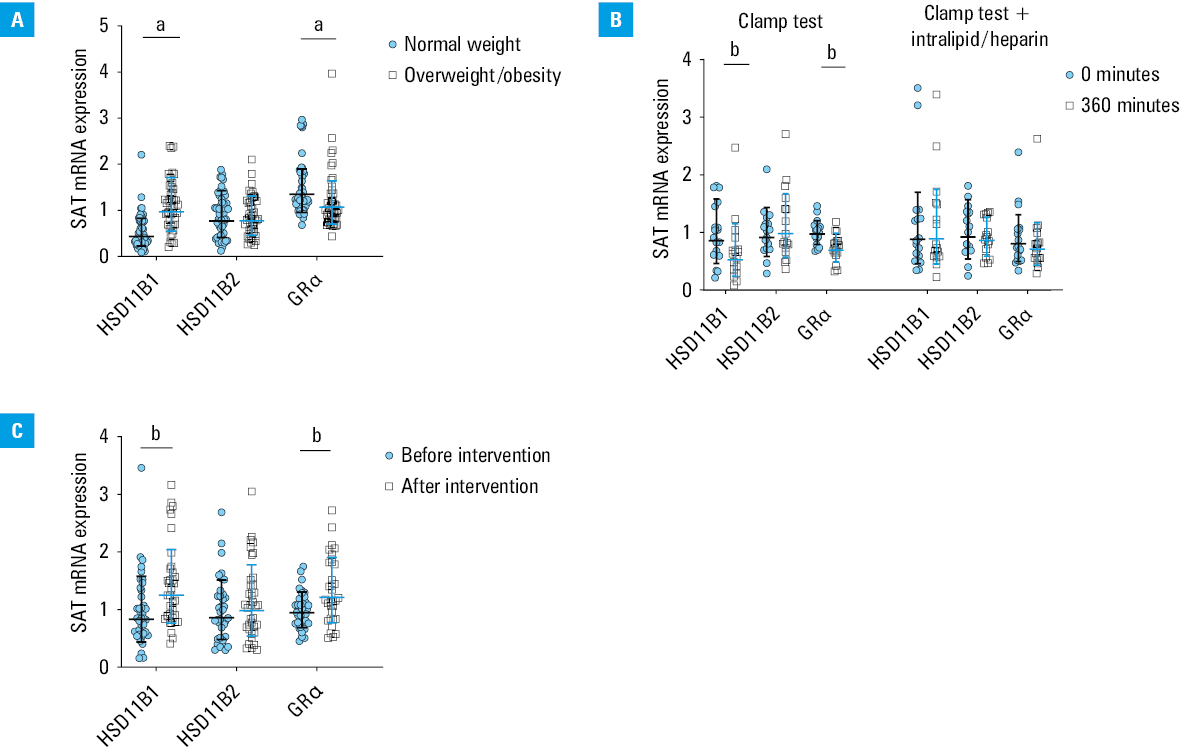
Baseline SAT HSD11B1 expression was higher in the overweight / obese individuals than in the normal‑weight people (P <0.001), whereas HSD11B2 expression did not differ between the groups (Figure 1A). SAT GRα expression was lower in the overweight / obese individuals than in the normal‑weight individuals (P = 0.003) (Figure 1A).
SAT HSD11B1 expression correlated negatively (r = –0.37; P <0.001), and GRα expression correlated positively (r = 0.37; P <0.001) with insulin sensitivity. Both correlations were independent of BMI and of each other (HSD11B1, standardized β = –0.23, P = 0.02; GRα, standardized β = 0.26, P = 0.006). SAT expression levels of HSD11B1 and GRα were not related to each other (r = –0.15; P = 0.14).
The effect of insulin and free fatty acids on subcutaneous adipose tissue HSD11B1, HSD11B2, and GRα expression (study group 1)
Insulin decreased SAT HSD11B1 (P = 0.003) and GRα expression (P <0.001), and did not affect HSD11B2 expression (Figure 1B). The effect of insulin on HSD11B1 expression seemed to be present both in normal‑weight individuals and in overweight / obese people, although it did not reach the level of significance in the former case (post hoc Tukey test, normal‑weight, P = 0.08; overweight / obese, P = 0.01). The effect of insulin on GRα expression was significant in both groups (post hoc Tukey test, normal‑weight, P = 0.003; overweight / obese, P = 0.01). Intralipid / heparin infusion abolished insulin effect on SAT HSD11B1 and GRα expression and did not affect HSD11B2 expression (Figure 1B).
The effect of weight‑reducing dietary intervention on subcutaneous adipose tissue HSD11B1, HSD11B2, and GRα expression in overweight / obese individuals (study group 2)
The dietary intervention resulted in a decrease in mean (SD) body weight (–11.3 [3.91] kg; P <0.001) and an increase in mean insulin sensitivity (1.76 [3.05] mg/kg FFM/min; P = 0.001). Mean morning serum cortisol level did not change after the intervention (9.08 [2.4] µg/dl vs 9.2 [2.35] µg/dl; P = 0.75).
SAT gene expression in the overweight / obese people from the study group 2 was similar to gene expression in the overweight / obese individuals from the study group 1. For the purpose of data presentation, initial (before the dietary intervention) mean gene expression values in the overweight / obese individuals in the study group 2 were normalized as 1.
The dietary intervention resulted in an increase in SAT HSD11B1 expression by 41% (P <0.001) and GRα expression by 34% (P = 0.001), but did not affect HSD11B2 expression (Figure 1C).
Discussion
In our study, we observed an increase in abdominal SAT HSD11B1 expression and a decrease in GRα expression in the participants with obesity. The expression of these genes was differentially related to insulin sensitivity. We also demonstrated that insulin decreased abdominal SAT expression of HSD11B1 and GRα, whereas FFA‑induced insulin resistance abolished this effect. Furthermore, we found an increase in SAT HSD11B1 and GRα expression following the weight‑reducing dietary intervention.
Our data on the increased abdominal SAT HSD11B1 expression and on lowered SAT GRα expression in the participants with obesity are in agreement with the previously published findings.7,8 In a study of young adult monozygotic twins discordant for BMI, intrapair differences in SAT HSD11B1 expression were positively related, whereas those in SAT GRα expression were inversely related to intrapair differences in BMI.17 Our data indicate that although local abdominal SAT cortisol production may be enhanced in obesity, glucocorticoid action may be decreased, as suggested by decreased GRα expression. We observed a positive correlation between SAT GRα expression and insulin sensitivity, independently of BMI. It may reflect potential insulin‑sensitizing glucocorticoid action in SAT.3-5 In the study by Goedecke et al,18 lower SAT GRα expression was associated with an increased proinflammatory profile and decreased insulin sensitivity in black women. However, in our study, SAT HSD11B1 expression was inversely related to insulin sensitivity. SAT HSD11B1 expression may increase whole‑body cortisol regeneration, as significant cortisol release from SAT was observed in humans,19 potentially contributing to liver and muscle insulin resistance. Our results do not indicate any role of SAT HSD11B2 expression in obesity and insulin resistance. It should be noted that we examined young people with uncomplicated obesity, without potential confounding factors. Differential relationships of SAT HSD11B1 and GRα expression with obesity and insulin sensitivity may be helpful in explaining the discrepancies in the results regarding the possible glucocorticoid role in SAT.
The expression of both HSD11B1 and GRα in SAT decreased similarly in response to insulin in normal‑weight and in overweight / obese individuals. Previously, it was demonstrated that insulin decreased SAT HSD11B1 activity in normal‑weight, but not in obese individuals.7 Our data are in line with the results of experimental studies, which reported an inhibitory effect of insulin on HSD11B1 expression in adipose cell cultures.20
FFA‑induced insulin resistance, obtained with intralipid / heparin infusion, abolished insulin effects on SAT HSD11B1 and GRα expression, both in normal‑weight and overweight / obese individuals. In the study by Wake et al,9 an intralipid infusion increased SAT HSD11B1 activity. Our study protocol was different, as we applied the intralipid infusion during hyperinsulinemic‑euglycemic clamp, and we used intralipid together with heparin. Apart from inducing insulin resistance, the intralipid / heparin infusion completely abolished insulin effect on SAT HSD11B1 and GRα expression. This result may reflect FFA‑induced insulin resistance.
Taking into account the above data, a short‑term insulin infusion negatively influences abdominal SAT glucocorticoid action, which indicates an acute insulin effect. In the context of an increased SAT HSD11B1 expression in obesity, this acute insulin effect on HSD11B1 expression does not correspond to the long‑term hyperinsulinemia observed in obesity and insulin resistance.
We noted an increase in SAT HSD11B1 expression after the weight‑reducing dietary intervention. It was accompanied by an increase in SAT GRα expression, however, in this case, the change in the gene expression may be perceived as a reverse of the change present in obesity. Similarly to our results, Tomlinson et al12 reported an increase in subcutaneous adipocyte HSD11B1 expression after 10 weeks of a very low‑calorie diet in obese patients, however, in that study, no baseline comparison with normal‑weight individuals was performed.
We measured only mRNA expression, which may be considered a limitation of our study. However, previous studies demonstrated that SAT HSD11B1 mRNA expression was closely related to the enzyme activity.6
Together, our data show that glucocorticoid action in SAT is probably not the main cause of insulin resistance, but rather an adaptation to different metabolic conditions. Our results may help explain why HSD11B1 inhibitors have not emerged as effective drugs for type 2 diabetes and metabolic syndrome.
SAT HSD11B1 and GRα are differentially associated with obesity and insulin resistance. In obesity, glucocorticoid action in abdominal SAT may be decreased and may increase after weight loss. During short‑term regulation, FFA‑induced insulin resistance abolishes inhibitory effect of insulin on SAT HSD11B1 and GRα expression.
- Schorr M, Lawson EA, Dichtel LE, et al. Cortisol measures across the weight spectrum. J Clin Endocrinol Metab. 2015; 100: 3313‑3321. | Crossref
- Gola H, Engler A, Morath J, et al. Reduced peripheral expression of the glucocorticoid receptor α isoform in individuals with posttraumatic stress disorder: a cumulative effect of trauma burden. PLoS One. 2014; 9: e86333. | Crossref
- Gathercole LL, Morgan SA, Bujalska IJ, et al. Regulation of lipogenesis by glucocorticoids and insulin in human adipose tissue. PloS One. 2011; 6: e26223. | Crossref
- Gathercole LL, Bujalska IJ, Stewart PM, Tomlinson JW. Glucocorticoid modulation of insulin signaling in human subcutaneous adipose tissue. J Clin Endocrinol Metab. 2007; 92: 4332‑4339. | Crossref
- Hazlehurst JM, Gathercole LL, Nasiri M, et al. Glucocorticoids fail to cause insulin resistance in human subcutaneous adipose tissue in vivo. J Clin Endocrinol Metab. 2013; 98: 1631‑1640. | Crossref
ARTICLE INFORMATION