Left atrial size and volume are associated with fibrin clot ultrastructure in patients with acute myocardial infarction


 CC BY-NC-SA 4.0
Left atrial size and volume are associated with fibrin clot ultrastructure in patients with acute myocardial infarction
Introduction
Consistent associations have been reported between impaired fibrin clot properties and cardiovascular (CV) diseases, including primarily atherosclerotic CV disease and its most severe complication, acute myocardial infarction (AMI).1,2 Patients with coronary artery disease (CAD) were shown to form more densely packed fibrin fibers with increased stiffness and, consequently, higher resistance to fibrinolysis, even when accounting for fibrinogen levels.1,3,4 In addition, it was reported that young AMI survivors were characterized by stiffer fibrin clots with shorter fibers and increased resistance to lysis.1,5 Despite antiplatelet treatment (acetylsalicylic acid, clopidogrel), patients with AMI still showed a prothrombotic fibrin clot phenotype, including hypofibrinolysis and increased clot density.1,6,7 Recently, we investigated ultrastructural characteristics of fibrin, including protofibril packing, in patients with AMI who demonstrated a significant prothrombotic burden.8 Similar associations were also found in other CV diseases9 and recurrent thromboembolic complications.10
CAD is associated with disturbances in echocardiographic measurements, such as impaired ejection fraction (EF), wall motion abnormalities, or dilation of heart chambers.11 Measurements of the heart chambers, such as the left atrium (LA), could be important to predict the CV outcome. Assessment of the LA volume (LAV) index was a strong predictor of major CV events, including all‑cause mortality, in stable ambulatory CAD patients.12 Moreover, there is a growing body of evidence suggesting that the LA diameter or volume can be predictive of thromboembolic complications, such as stroke, in patients with atrial fibrillation.13,14
Therefore, we hypothesized that LA measurements, including LAV and LA diameter, could be associated with fibrin clot properties. The aim of this study was to assess whether fibrin clot ultrastructure correlates with LA measurements and parameters of blood flow through the mitral valve in patients with AMI.
Patients and methods
Study population
The study population was previously described.8 Briefly, we enrolled 23 patients hospitalized within 12 hours from the onset of the first clinical symptoms of AMI. Two patients were excluded from the final analysis due to a lack of echocardiographic parameters (death in the early stage of AMI); therefore, the final sample comprised 21 patients. We included patients with ST‑segment and non–ST‑segment elevation MI diagnosed according to the Fourth Universal Definition of Myocardial Infarction.15 The exclusion criteria comprised atrial fibrillation, venous thromboembolic events within the previous 6 months or any other disease treated with anticoagulant drugs, known cancer, signs of acute infection, chronic inflammatory disorders, severe liver injury, estimated glomerular filtration rate lower than 30 ml/min/1.73 m2, and pregnancy. Blood was collected on admission to the hospital and prior to administration of any anticoagulants.
The study protocol complied with the Declaration of Helsinki and was approved by the Ethics Committee of the Jagiellonian University (KBET/122.6120.271.2015). Each study participant provided their written informed consent.
Laboratory investigations
Clot ultrastructure analysis was performed as previously described.8 In brief, the clot formation was assessed using standard turbidity measurements. The clot structure was determined using laser scanning confocal microscopy, scanning electron microscopy, and permeation experiments, while individual fiber size and internal structure was compared using a turbidimetric analysis. The clot breakdown was determined using standard turbidity experiments.16 Fibrinogen level was measured using the Clauss method.
Laser scanning confocal microscopy
Fibrin clot density was analyzed using laser scanning confocal microscopy (Figure 1A and 1B), as described previously.8 In brief, plasma was spiked with a final concentration of 50 μg/ml Alexa Fluor 488–labeled fibrinogen (Thermo Fisher Scientific, Waltham, Massachusetts, United States) and diluted 1:4 in Tris‑buffered saline. Clotting was initiated with the addition of 0.1 U/ml of human α-thrombin and 10 mmol/l of CaCl2. The clots were imaged with a Zeiss LSM880 inverted microscope with a 40 × oil immersion objective (Carl Zeiss, Ltd., Cambridge, United Kingdom), after 2 to 4 hours in the humidity chamber at room temperature. Three micrographs were taken for each clot, and Z‑stacks were combined and flattened at a maximum intensity (ImageJ, NIH, Bethesda, Maryland, United States).
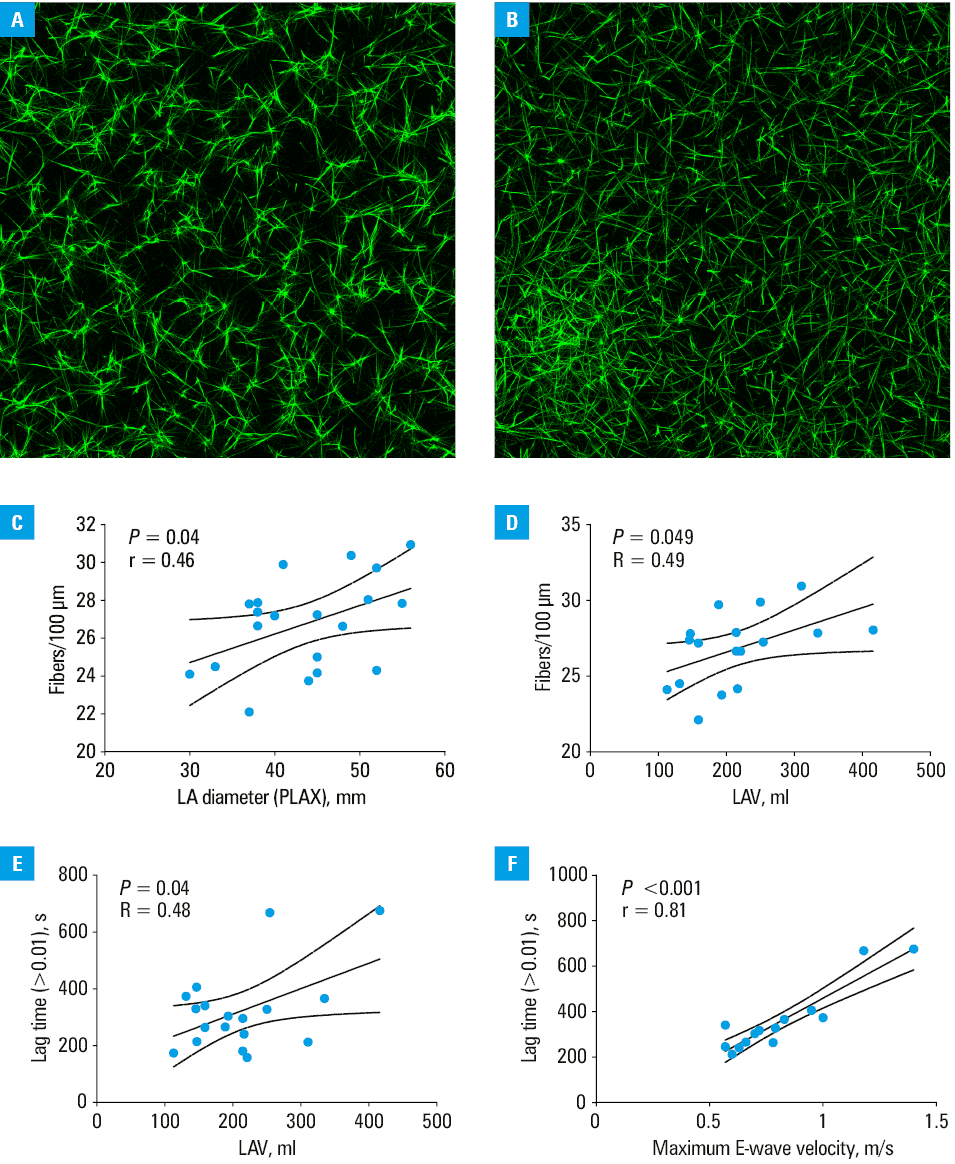
Abbreviations: LA, left atrium; LAV, left atrial volume; PLAX, parasternal long‑axis view
Echocardiographic parameters
Transthoracic echocardiography was performed using a Philips Affinity 70G device (Philips Medical Instruments, Bothell, Washington, United States) and a sector array (2.5–3.5 MHz) transducer. All echocardiographic measurements were recorded as recommended in the current guidelines10 using typical projections, namely, parasternal long‑axis, parasternal short‑axis, apical 4‑chamber (Ap4Ch), apical 5‑chamber, apical 2‑chamber (Ap2Ch), and apical 3‑chamber views. Doppler echocardiography was used to determine the mitral inflow spectrum and mitral gradient. The E wave represents the hemodynamic inflow through the mitral valve to the left ventricle (LV). The peak blood velocity of E wave has been systematically examined. Mitral gradient was defined as the peak gradient measured by continuous wave Doppler echocardiography to determine the maximum difference of pressures between the LA and LV. LVEF was calculated with the biplane Simpson method using the Ap2Ch and Ap4Ch views. Reduced LVEF was defined as LVEF lower than 50%.10
Statistical analysis
Data were presented as mean (SD) or median and interquartile range. Normality of distribution was assessed using the Kolmogorov–Smirnov test. Bivariate correlations were analyzed with the Pearson or Spearman correlation for normally and non‑normally distributed variables, respectively. All tests were 2‑tailed. Statistical significance was defined as P values below 0.05. Calculations were performed using GraphPad Prism version 9.2.0 (La Jolla, California, United States) or SPSS IBM software (Armonk, New York, United States).
Results and discussion
A total of 21 patients completed both the fibrin clot structure and echocardiographic evaluation. Baseline characteristics, along with the clot formation and breakdown results, are shown in Supplementary material, Tables S1–S3. In the correlation analysis we found that LA diameter (Figure 1C) and LVEF correlated positively with the fibrin clot density (P = 0.01). Moreover, LAV positively correlated with the fibrin clot density, but also with the lag time to initiation of blood clot formation (Figure 1D and 1E). It was previously reported that patients with heart failure (HF) with reduced EF, mostly of ischemic etiology, were characterized by faster formation of compact plasma clots, which could serve as an additional risk factor for thromboembolic complications.17 Furthermore, it could potentially contribute to an elevated prothrombotic risk in patients with other HF phenotypes, for example, those with HF with preserved EF (HFpEF)—a cohort frequently characterized by atrial enlargement.18 Interestingly, those patients were also characterized by a significantly greater LA diameter, as compared with controls.17
Furthermore, higher E‑wave velocity, representing the maximum inflow velocity through the mitral valve, was associated with a longer lag time to initiation of blood clot formation (Figure 1F). This finding suggests that a greater maximum blood velocity through the mitral valve, which can result in an increased pressure difference between the LA and LV, may be related to a less prothrombotic fibrin clot phenotype.
Finally, we also demonstrated an association between the clot density and severity of the AMI course, defined by a maximum concentration of high‑sensitivity troponin T (R = 0.48; P = 0.03). There is a large body of evidence that the LA size is significantly associated with CV outcomes, such as ischemic stroke, or diagnosis of HFpEF.19,20 Interestingly, the function of LA, namely LA strain, could also be a predictor of CV outcomes in patients undergoing transcatheter mitral valve repair.21
Our study indicates that the LA size and volume could serve as important clinical factors associated with a denser fibrin clot ultrastructure; however, faster blood flow through the mitral valve (higher E‑wave velocity) and greater LAV were associated with a longer lag time to thrombin generation initiation. Further studies in larger cohorts of patients with vascular diseases are needed to evaluate multivariable models and predict the prognosis of CV outcomes in such populations.
- Bridge KI, Philippou H, Ariëns RAS. Clot properties and cardiovascular disease. Thromb Haemost. 2014; 112: 901‑908. | Crossref
- Zalewski J, Bogaert J, Sadowski M, et al. Plasma fibrin clot phenotype independently affects intracoronary thrombus ultrastructure in patients with acute myocardial infarction. Thromb Haemost. 2015; 113: 1258‑1269. | Crossref
- Ząbczyk M, Natorska J, Undas A. Fibrin clot properties in atherosclerotic vascular disease: from pathophysiology to clinical outcomes. J Clin Med. 2021; 10: 2999. | Crossref
- Larsen JB, Hvas AM. Fibrin clot properties in coronary artery disease: new determinants and prognostic markers. Pol Arch Intern Med. 2021; 131: 16113. | Crossref
- Collet JP, Allali Y, Lesty C, et al. Altered fibrin architecture is associated with hypofibrinolysis and premature coronary atherothrombosis. Arterioscler Thromb Vasc Biol. 2006; 26: 2567‑2573. | Crossref
SUPPLEMENTARY MATERIAL
ARTICLE INFORMATION