Elevated growth differentiation factor 15 is associated with echocardiographic markers of right heart overload in atrial fibrillation


 CC BY-NC-SA 4.0
Elevated growth differentiation factor 15 is associated with echocardiographic markers of right heart overload in atrial fibrillation
Introduction
Growth differentiation factor 15 (GDF‑15) is a stress response protein, synthesized by macrophages, adipocytes, vascular smooth muscle cells, and endothelium, that is increased in inflammation, oxidative stress, and tissue injury.1 Under normal conditions, cardiomyocytes do not produce GDF‑15, while it is highly expressed in these cells in response to ischemia, reperfusion injury, and pressure overload; there is evidence that GDF‑15 exerts cardioprotective effects.2 Recombinant GDF‑15 has been demonstrated to have similar effects in vitro, limiting apoptosis induced by simulated ischemia and reperfusion injury in cardiomyocyte cultures.3 There is evidence that serum GDF‑15 levels are increased in atrial fibrillation (AF).4-7 Serum GDF‑15 has been postulated as a useful prognostic marker in AF patients in terms of mortality, stroke, heart failure (HF), and AF recurrence following catheter ablation.4-7 Previously, it has been shown that GDF‑15 positively correlated with prolonged clot lysis time (CLT) in AF patients, assessed off anticoagulation, whereas there was no such association with thrombin generation or fibrin clot density.5 Since the role of GDF‑15 in development and progression of AF is poorly understood, we investigated whether circulating GDF‑15 levels are associated with cardiac remodeling in relation to prothrombotic state markers in AF.
Patients and methods
Between June 2020 and December 2021, a cohort comprising 241 consecutive adult AF patients was enrolled at the St. John Paul II Hospital and the University Hospital in Kraków, Poland. The study population has been described previously.8 Exclusion criteria included recent acute myocardial infarction, stroke, or venous thromboembolism within the past 3 months, severe HF (New York Heart Association class III or IV), stage 5 chronic kidney disease, liver injury, known cancer, autoimmune disease, signs of acute infection, elevated C‑reactive protein (CRP) (>10 mg/l, reference value <5 mg/l), or the use of vitamin K antagonists. AF classification was based on the 2020 European Society of Cardiology guidelines,9 considering clinical presentation, duration, and spontaneous termination.
Echocardiography was performed using the General Electric Vivid E6 device and a sector array M6S (2.5–3.5 MHz) transducer (General Electric, Boston, Massachusetts, United States). The right atrium (RA) size was determined in the 4‑chamber view at end‑systole, measuring the circumference from the lateral to the septal border of the tricuspid annulus. The reported result represents the RA area. Similarly, the left atrium volume index (LAVI) was assessed in the 4‑chamber view at end‑systole by tracing the inner border of the LA, and this volume was subsequently normalized by body surface area (BSA). Right ventricle (RV) was measured as basal diameter in the apical, focused 4‑chamber (AP4Ch) view in mid‑systole. Tricuspid regurgitation maximum velocity (TRVmax) was assessed in the AP4Ch view using continuous‑wave Doppler. Tricuspid annular plane systolic excursion (TAPSE) was measured in the AP4Ch view using M‑mode imaging. Pulmonary artery trunk diameter was measured by linear internal measurement in the short‑axis view. Pulmonary acceleration time (ACT) was measured as the interval between the onset of the flow and the peak flow of the pulse wave Doppler signal of the systolic flow in the RV outflow tract. The diameter of the inferior vena cava (IVC) was measured at 1 to 2 cm from the junction with the RA, using the long‑axis view in the subcostal view.
The left ventricular ejection fraction (LVEF) was calculated with the biplane Simpson method using the apical 2‑chamber and AP4Ch views. Left ventricle (LV) cavity parameters were measured by linear internal measurements of the LV and its walls in the parasternal long‑axis view, obtained from 2‑dimensional echocardiographic images. LV cavity measurements included assessment of LV end‑diastolic dimension (LVEDD), interventricular septum (IVS), and posterior wall (PW) thickness. LV mass (LVM) was calculated from the Cube formula: 0.8{1.04[([LVEDD + IVSd +PWd]3 – LVEDD3)]} + 0.6, where d stands for diastole. LVM index (LVMI) was calculated using the following equation: LVMI = LVM / BSA. Relative wall thickness was calculated with the formula: (2 × PW)/(LVEDD). LVEF was measured using the modified Simpson rule.10
Hypercholesterolemia was diagnosed based on a cholesterol‑lowering therapy, or low‑density lipoprotein cholesterol levels (>3 mmol/l). Arterial hypertension was determined by a history of hypertension (blood pressure ≥140/90 mm Hg) or preadmission antihypertensive treatment. Type 2 diabetes (T2D) diagnosis was established through fasting serum glucose levels equal to or above 7 mmol/l on 2 separate occasions, glycated hemoglobin level equal to or above 48 mmol/mol (6.5%), or postload plasma glucose levels equal to or above 11.1 mmol/l. Prior ischemic stroke diagnosis was based on symptoms and positive findings on computed tomography or magnetic resonance imaging, adhering to the World Health Organization criteria.
The Jagiellonian University ethics committee approved the study (1072.6120.186.2020), and all participants provided their written informed consent in accordance with the Declaration of Helsinki.
Fasting venous blood was drawn during anticoagulant therapy with direct oral anticoagulants (DOACs), and the time since the last dose of DOACs was noted. Plasma samples from the patients in whom plasma DOAC levels were above 30 ng/ml were treated with DOAC‑Stop (Haematex Research, Sydney, Australia) prior to coagulation assessment, to eliminate potential residual anticoagulant effects.8 Blood was drawn into citrated tubes and centrifuged at 2500 g, at 20 °C, for 20 minutes or into serum or ethylenediaminetetraacetic acid tubes and centrifuged at 1600 g, at 4 °C, for 10 minutes. Aliquots were stored at –80 °C.
Standard laboratory techniques were employed for routine laboratory investigations. Fibrinogen levels were determined using the von Clauss method. Serum GDF‑15 level was assayed by an enzyme‑linked immunosorbent assay (R&D Systems, Minneapolis, Minnesota, United States). Endogenous thrombin potential (ETP) was assessed using calibrated automated thrombography (Thrombinoscope BV, Maastricht, the Netherlands), as described before.11 Fibrin clot properties were examined in citrated plasma as described earlier.12,13 Fibrin clot permeability (Ks), a measure of fibrin network density, was determined using the pressure‑driven system. Briefly, CaCl2 (20 mM) and human thrombin (1 U/ml; Merck, Darmstadt, Germany) were mixed with citrated plasma. CLT, indicating clot susceptibility to recombinant tissue plasminogen activator (rtPA)-driven lysis, was determined turbidimetrically. Briefly, citrated plasma was mixed with 20 mM CaCl2, 0.5 U/ml thrombin (Merck), 15 µM phospholipid vesicles (Rossix, Mölndal, Sweden), and 18 ng/ml rtPA (Actilyse 20 mg, Boehringer Ingelheim, Ingelheim, Germany). All assays were conducted by blinded technicians, and intra‑assay and interassay coefficients of variation ranged from 5% to 7%.
Statistical analysis
Variables were presented as numbers and percentages, mean (SD), or median and interquartile range (IQR), as appropriate. Normality of the data distribution was assessed by the Shapiro–Wilk test. Differences between 2 groups were compared using the t test or the Wilcoxon test, depending on the normality of distribution. Categorical variables were compared using the χ2 test or the Fisher exact test. Correlation analyses were performed using the Spearman or Pearson correlation coefficients for non‑normally and normally distributed variables, respectively. A P value below 0.05 was considered significant. Statistical analyses were performed with the R software version 4.3.1 (R Core Team, R Foundation for Statistical Computing, Vienna, Austria) and the Statistica software, version 13.3 (TIBCO Software, Palo Alto, California, United States).
Results
We studied 241 AF patients (median [IQR] age, 68 [62–75.2] years; median CHA2DS2-VASc score, 3 [2–4]; 58.5% men; Supplementary material, Table S1). The predominant comorbidities were hypertension (75.5%) and hyperlipidemia (59.7%) (Supplementary material, Table S1). Approximately 23.2% of the patients were diagnosed with T2D (Supplementary material, Table S1). The patients were treated with standard doses of DOACs (Supplementary material, Table S1). Median (IQR) EF was 55% (44%–60%), RA was 20 (16–25) cm2, and TAPSE was 22 (19.4–26) mm.
The median (IQR) concentration of GDF‑15 was 1455 (1010–1895) pg/ml, with no difference between men and women (P = 0.46). In the whole cohort, GDF‑15 correlated positively with CHA2DS2-VASc score (R = 0.30; P <0.001), RA (Figure 1A), TRVmax (R = 0.23; P = 0.03), vena cava diameter (R = 0.2; P = 0.02), and inversely with TAPSE (R = –0.23; P = 0.003). Moreover, GDF‑15 correlated positively with CRP (R = 0.23; P = 0.001) and inversely with Ks (Figure 1B) but not with ETP and CLT.
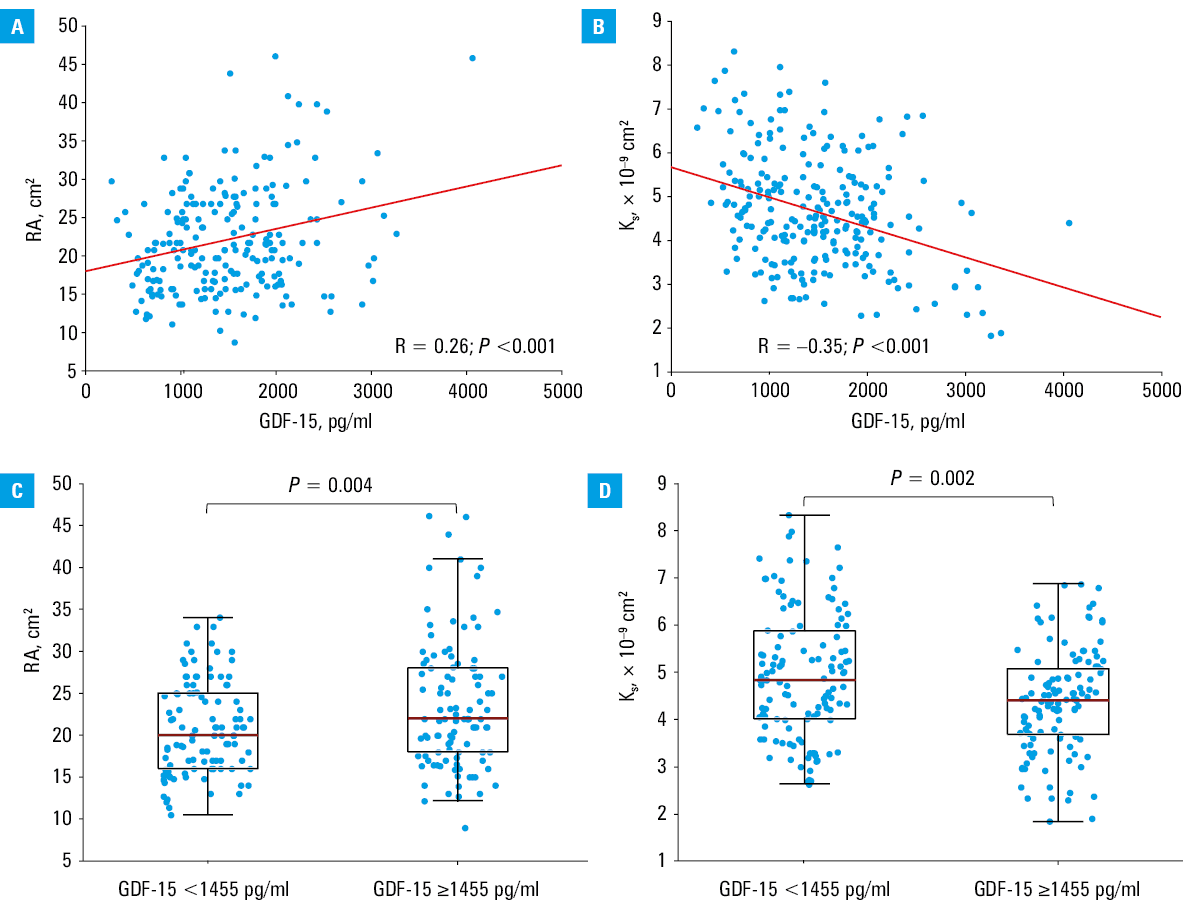
Individuals with GDF‑15 levels equal to or above 1455 pg/ml (n = 116 [48.1%]) were older, had higher body mass index (BMI), more often suffered from T2D, and used statins more commonly, as compared with the other patients (Supplementary material, Table S1). GDF‑15 level above 1455 pg/ml was associated with higher glucose and creatinine levels (Supplementary material, Table S1). Individuals with GDF‑15 levels equal to or above 1455 pg/ml had 10% larger RA (Figure 1C), 10% lower TAPSE, 17% higher TRVmax, 12% higher pulmonary valve maximum blood velocity (Supplementary material, Table S1), and 22% shorter ACT, but no differences were observed for LAVI or RV diameter, as compared with the remaining patients (Supplementary material, Table S1). An analysis of the fibrin clot properties showed that the patients with elevated GDF‑15 had also by 9% reduced Ks (Figure 1D), even after adjustment for age and BMI (P = 0.005), while CLT was not affected. However, we found a positive association between CLT and GDF‑15 levels equal to or above 1455 pg/ml (R = 0.25; P = 0.007). GDF‑15 was not related to ETP (Supplementary material, Table S1).
Discussion
To our knowledge, this study is the first to show that increased GDF‑15 level is associated with right heart overload in AF. This observation might be important given the absence of established biomarkers that reflect the long‑term cardiac remodeling observed primarily in nonischemic HF patients, and seems to be in line with the reports regarding HF, in which elevated GDF‑15 levels corresponded to the increased cardiac filling pressures, increased LVM, and decreased LV systolic function.2,14-16
Regarding prothrombotic markers, we have supported a previous study by Matusik et al5 by showing a similar association between prolonged CLT and GDF‑15 levels equal to or above 1455 pg/ml in AF patients. However, we failed to show such an association in the whole group, which is probably related to differences in patient characteristics, as our cohort had lower CHA2DS2-VASc score and GDF‑15 levels. A novel finding is that in AF elevated GDF‑15 level correlates with reduced Ks, which is a key measure of a so‑called prothrombotic fibrin clot phenotype that reflects the size of an average pore. Reduced Ks, typically associated with prolonged CLT, has been shown in cardiovascular diseases including AF.17 We did not observe any association of GDF‑15 with ETP, a marker of thrombin generation, while a weak association was previously observed in a smaller cohort of AF patients, which was abolished after adjustment for demographic, clinical, and laboratory parameters.5 Most likely, ETP as a measure of thrombin generation potential is not affected by GDF‑15, which does not exclude any associations with other thrombin generation markers in circulating blood.
Our observation may suggest that GDF‑15 is a promising biomarker not only in assessing the overall AF progression but also in predicting thromboembolic risk in this group of patients, as reflected by the association of GDF‑15 with the thromboembolic and bleeding risk stratification scales.18,19 Pulmonary hypertension (PH) is related to right‑sided HF and overload.20 Several studies have shown a high prevalence of vascular thrombotic lesions found postmortem in patients with idiopathic pulmonary artery hypertension,21 which might be related to abnormalities in blood coagulation, endothelial cells, and platelets. Previously PH was shown to be associated with hypofibrinolysis,21 and elevated plasma levels of fibrinopeptide A and D‑dimer.20 Main echocardiographic signs that facilitate grading of PH probability include higher pulmonary trunk diameter, IVC diameter, RA area, TRVmax and shorter ACT.22 These parameters reflect right heart overload and analyzed separately not necessarily confirm PH, but rather suggest lung disorders. In our study, elevated GDF‑15 level was associated with larger RA size, higher TRmax, shorter ACT, and more dilated IVC. Interestingly, it was also associated with worse RV systolic function, reflected by lower TAPSE. GDF‑15 is a noncardiospecific marker, thus its increased level may indicate both myocardial stress and related systemic abnormalities. However, excessive production of GDF‑15 by cardiomyocytes was reported as a result of pressure and volume overload of the right heart in patients with RA remodeling and RV systolic dysfunction.23 Therefore, it seems that GDF‑15, together with soluble suppression of tumorigenicity 2 and galectin‑3,24 may be a useful biomarker of right heart overload.
Our study has several limitations. First, the group size was limited, but represented typical real‑life AF patients.18,25 Second, we assessed indirect characteristics of right heart overload on echocardiography, instead of cardiac catheterization, which is an invasive diagnostic procedure. Third, any associations do not necessarily mean the cause and effect relationship. Complex mechanisms linking elevated GDF‑15 levels with right heart overload in AF were beyond the scope of our study and are worth investigating. Finally, long‑term follow‑up is required to assess the role of elevated GDF‑15 concentrations in predicting clinical outcomes in right heart overload and cardiac remodeling in AF patients during anticoagulant therapy; we did not assess follow‑up data.
In conclusion, in our preliminary, hypothesis‑generating study, we observed that the GDF‑15 level is associated with right heart overload and formation of denser fibrin clot networks. However, larger, long‑term studies are needed to clarify the potential role of GDF‑15 as a marker of AF progression and heart remodeling.
- Wollert KC, Kempf T, Wallentin L. Growth differentiation factor 15 as a biomarker in cardiovascular disease. Clin Chem. 2017; 63: 140‑151. | Crossref
- Sawalha K, Norgard NB, Drees BM, et al. Growth differentiation factor 15 (GDF‑15), a new biomarker in heart failure management. Curr Heart Fail Rep. 2023; 20: 287‑299. | Crossref
- Kempf T, Eden M, Strelau J, et al. The transforming growth factor‑beta superfamily member growth‑differentiation factor‑15 protects the heart from ischemia / reperfusion injury. Circ Res. 2006; 98: 351‑360. | Crossref
- Santema BT, Chan MMY, Tromp J, et al. The influence of atrial fibrillation on the levels of NT‑proBNP versus GDF‑15 in patients with heart failure. Circ Res. 2006; 98: 351‑360.
- Matusik PT, Małecka B, Lelakowski J, et al. Association of NT‑proBNP and GDF‑15 with markers of a prothrombotic state in patients with atrial fibrillation off anticoagulation. Clin Res Cardiol. 2020; 109: 426‑434. | Crossref
SUPPLEMENTARY MATERIAL
ARTICLE INFORMATION