Lower air ozone concentration is associated with clinical remission in type 1 diabetes diagnosed in adulthood: a prospective, observational study in Wielkopolska region, Poland
1* ,
Key words: air pollution, clinical remission, public health, type 1 diabetes
,
Key words: air pollution, clinical remission, public health, type 1 diabetes


 CC BY-NC-SA 4.0
Lower air ozone concentration is associated with clinical remission in type 1 diabetes diagnosed in adulthood: a prospective, observational study in Wielkopolska region, Poland
Introduction: Clinical remission in type 1 diabetes (T1D) results from metabolic compensation after insulin implementation and is caused by various factors.
Objectives: Our aim was to investigate an association between air pollution defined based on ozone concentration in the month of T1D diagnosis and the early course of the disease, that is, glucose metabolism and the occurrence of remission.
Patients and methods: This prospective, observational analysis included 96 adult patients with newly diagnosed T1D. The study group was divided according to the occurrence of remission at 12 months after the diagnosis. The levels of ambient ozone measured within the month of T1D diagnosis were calculated using the official data of Poland’s Chief Inspectorate of Environmental Protection. Remission was defined according to the following formula: actual glycated hemoglobin (HbA1c)(%) level + [4 × insulin dose (units/kg per 24 h)] – value defining partial remission ≤9.
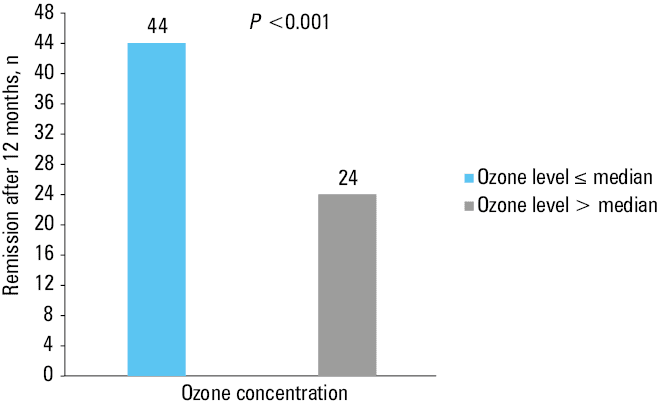
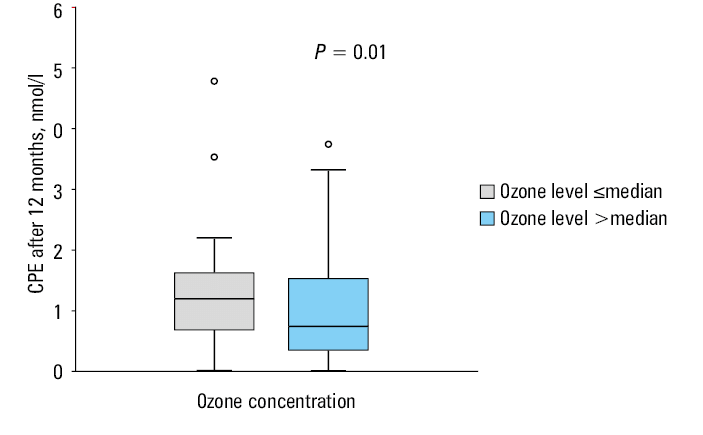
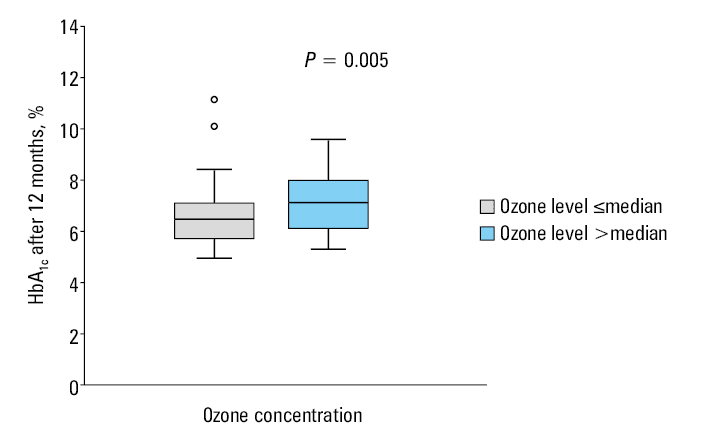
Results: The remission rate after 12 months was higher in the group where ozone concentration was below or equal to the median for the study population (P <0.001). Moreover, the patients in the group where ozone levels were above the median, presented lower C‑peptide levels (P = 0.01), higher HbA1c concentration (P = 0.005), and higher daily insulin requirements (P = 0.02) after 12 months from the diagnosis. Also, in the group of participants achieving remission, the ambient ozone level was lower (P <0.001). In a multivariable logistic regression analysis, the increased ozone concentration in the month of diagnosis was the variable that influenced the lack of remission after 12 months, independently of sex and smoking (P <0.001).
Conclusions: Increased ozone level may exacerbate metabolic outcomes and reduce remission in T1D.
What's new?
In this study, we have proved that increased ozone concentration may contribute to a lack of remission after 12 months in people with newly diagnosed type 1 diabetes (T1D). Moreover, ozone may impact glycemic control, pancreatic cell function, and daily insulin dose, as it activates the stress hormone pathway, resulting in metabolic decompensation. To our knowledge, no study has addressed the relationship between air pollution and remission in T1D in adults. Our results indicated a new area to focus on to enhance the chances of remission and improve quality of life in patients with diabetes. In addition, air pollution is a global health threat, and our paper further confirms the need to improve air quality worldwide.
Introduction
Type 1 diabetes (T1D) is a chronic disease affecting children and adults, characterized by destruction of pancreatic β cells. Pathogenesis of T1D is complex, including autoimmunity, genetic, and environmental factors.1,2 In T1D, absolute insulin deficiency occurs due to B‑cell damage by autoimmune processes. However, soon after diagnosis and implementing insulin treatment and a healthy lifestyle, some patients restart to produce endogenous insulin in residual β islet cells. Then, their requirement for exogenous insulin might be decreased or even eliminated. This phenomenon is called remission or “honeymoon period,” and has many advantages for T1D patients, such as fewer microvascular complications3 and better insulin sensitivity.4 The remission phase occurs due to temporary metabolic compensation after initiating insulin treatment.5-7 Additionally, β-cell recovery or regeneration8 and modulation of the islet autoimmunity9 occur during the remission. Nevertheless, the mechanism of remission is still not fully understood; its occurrence is highly individual and depends on many factors.10-12
Ambient air pollution is one of the leading global health risks.13 The most investigated type of air pollution in the context of diabetes is traffic‑related air pollution, which includes a variety of contaminants, for example, particulate matter (PM) below 10 µm and below 2.5 µm in diameter (PM10, PM2.5), sulfate and nitrogen compounds, polycyclic aromatic hydrocarbons, and ground‑level ozone (O3). Ground‑level ozone is a major component of smog formed during an interaction of various air pollutants with sunlight. Zhang et al14 called it a major health hazard worldwide.
Poor‑quality air promotes development of autoimmune diseases, including T1D.15 Zhao et al16 pointed out that air pollution triggers abnormal immune responses in the body, which contribute to the pathogenesis of T1D. Besides, air pollution may influence genetics by affecting epigenetic mechanisms.17 Pancreatic β cells are prone to oxidative stress, which leads to their dysfunction and death in T1D.18 Furthermore, air pollution can promote oxidative effects, that is, generation of free oxygen radicals resulting from exposure to ozone, which are capable of damaging β cells.19 Animal studies showed that ozone impairs β-cell function and induces oxidative stress, adipose tissue inflammation, and glucose intolerance.20,21
To our knowledge, no study has addressed the relationship between air pollution and T1D remission in adults.
Therefore, our work aimed to investigate the relationship between air pollution in the month of T1D diagnosis and early course of the disease, as characterized by glucose metabolism, and the occurrence of remission.
Patients and methods
Study population
The analysis included 96 patients (34 women and 62 men), at a median (interquartile range [IQR]) age of 28 (20–33) years, inhabitants of Wielkopolska region in Poland, who participated in the prospective, observational Insulin Therapy and Lipoproteins Profile in Type 1 Diabetes Study (InLipoDiab1). The adults with newly diagnosed T1D were consecutively recruited between June 2015 and September 2018. The participants did not have any comorbidities. Their demographic characteristics, that is, weight, body mass index, smoking status, medical history, and laboratory data, including the levels of glycated hemoglobin (HbA1c), were collected at baseline (during hospitalization due to hyperglycemia and ketosis) and after 12 months of observation. At 12 months from the diagnosis, pancreatic β-cell function was assessed by measuring serum C‑peptide (CPE) levels. Positive specific autoantibodies: islet cell antibodies, glutamic acid decarboxylase antibodies, and tyrosine phosphatase antibodies, confirmed the autoimmune etiology. The patients were treated with intensive insulin therapy administered with insulin pens. The study was registered at ClinicalTrials.gov (NCT02306005). It was conducted according to the guidelines of the Declaration of Helsinki and approved by the Ethics Committee of the Poznan University of Medical Sciences (NCT02306005). All participants gave their written, informed consent.
Calculation of air pollution concentration
Air concentrations of ozone were collected from the official data of the Chief Inspectorate for Environmental Protection in Poland.22 The monitoring stations were deployed around the Wielkopolska region. The O3 levels were measured at 5 different sites. The measurements were obtained every hour using automatic methods. The average air pollutant concentrations in the month of the diagnosis were obtained by calculating daily measurements collected during each month. The date of the T1D diagnosis was used to assign the patient to relevant monthly air pollution concentrations. The levels of contaminants were calculated using the data from the monitoring station the closest to the patient’s permanent residence address. The study group was divided according to the median ozone concentration for the study population, and for further statistical analysis the patients were classified into 2 groups depending on the date of T1D diagnosis. The cold season group included diagnoses established in autumn and winter, and the warm season group those established in spring and summer, as per the Dfb climate classification by Köppen.23
Diabetes metabolic control and remission criteria
The HbA1c concentration was measured in the whole blood and assessed by a turbidimetric inhibition immunoassay (Cobas 6000, Roche Diagnostics, Basel, Switzerland). Fasting plasma glucose (FPG) and postprandial glucose (PPG) were measured using capillary plasma with a glucometer. PPG was calculated as mean glycemia measured thrice, 2 hours after the main meals throughout the day. Mean fasting glucose and mean postprandial glucose were calculated as a mean from measurements during the participant hospitalization at diagnosis and a few days before visiting the outpatient clinic 12 months after the diagnosis. Clinical remission was defined as actual HbA1c(%) level + [4 × insulin dose (units/kg per 24 h)] – value defining partial remission ≤9.24
Statistical analysis
Statistical analysis was performed using Statistica v. 13.0 software (StatSoft, Tulsa, California, United States). The Kolmogorov–Smirnov test with the Lilliefors correction was used to check if the quantitative variables were normally distributed. Nonparametric tests were used for further analyses, if the analyzed parameters did not follow a normal distribution. The results were presented as numbers, percentages, medians, and IQRs. The Mann–Whitney test was used for the continuous variables, and the χ2 test for categorical variables to assess the differences between the groups. We applied a multivariable logistic regression model to assess the influence of selected parameters (sex, age at T1D diagnosis, smoking status, and ozone concentration) on the lack of remission. The Spearman correlation coefficient was calculated to determine the relationship between air ozone concentration and HbA1c levels. A P value below 0.05 was considered significant.
Results
After 12 months of observation, clinical remission was present in 68 participants (71%). As shown in Table 1, the patients in remission were slightly older at the time of diagnosis (P = 0.03), and they presented lower HbA1c (P <0.001) and higher CPE (P <0.001) levels, both measured after 12 months of observation. FPG levels measured at baseline (P <0.001) and after 12 months of intensive insulin therapy (P = 0.007) were higher in the group without remission. PPG levels after 12 months were also higher among the nonremitters (P = 0.003).
Parameter | With remission
(n = 68) | Without remission
(n = 28) | P value |
Values are presented as median (interquartile range) unless indicated otherwise.
Abbreviations: BMI, body mass index; CPE, C‑peptide; FPG, fasting plasma glucose; HbA1c, glycated hemoglobin; PPG, 2‑hour postprandial glycemia | |||
Men, n (%) | 44 (65) | 18 (64) | 0.97 |
Smoking, n (%) | 14 (20.6) | 9 (32) | 0.23 |
Age at diagnosis, y | 29 (25.5–34) | 27.5 (23–30.5) | 0.03 |
Weight, kg | |||
Baseline | 68.3 (57–78.2) | 67.5 (56.6–77) | 0.61 |
After 12 months | 72.1 (62.1–80.9) | 68.9 (59.4–76.8) | 0.28 |
BMI, kg/m2 | |||
Baseline | 22.3 (19.9–23.6) | 22.3 (18.6–24.1) | 0.84 |
After 12 months | 23.2 (20.6–25.3) | 22.2 (20.1–25) | 0.49 |
HbA1c, % | |||
Baseline | 11.3 (9.8–12.6) | 11.6 (10.2–12.3) | 0.99 |
After 12 months | 6.3 (5.8–6.8) | 8.1 (7.4–9.5) | <0.001 |
FPG, mmol/l | |||
Baseline | 7.5 (6.9–8.7) | 9.3 (7.9–9.9) | <0.001 |
After 12 months | 6.7 (6.1–7.8) | 8.3 (7.4–9) | 0.007 |
PPG, mmol/l | |||
Baseline | 9.4 (8.4–10.6) | 10.1 (9.3–11.1) | 0.12 |
After 12 months | 6.7 (6.1–7.8) | 8.5 (7–9.8) | 0.003 |
CPE after 12 months, nmol/l | 1.2 (0.7–1.7) | 0.6 (0.2–1) | <0.001 |
Median (IQR) ozone concentration in the month of T1D diagnosis was significantly higher among the nonremitters than among those in remission (61.5 [50–70.4] µg/m3 vs 38.5 [28.1–57.1] µg/m3; P <0.001).
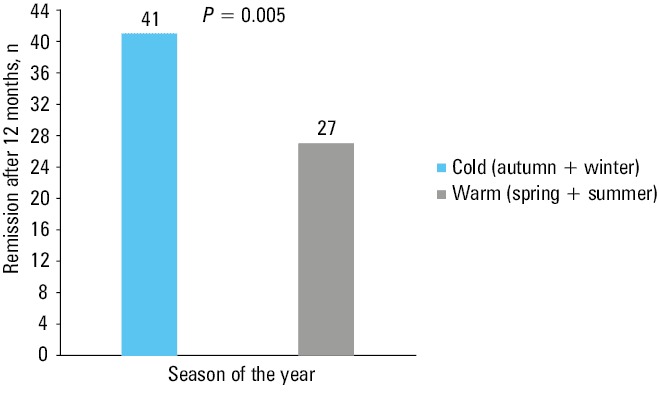
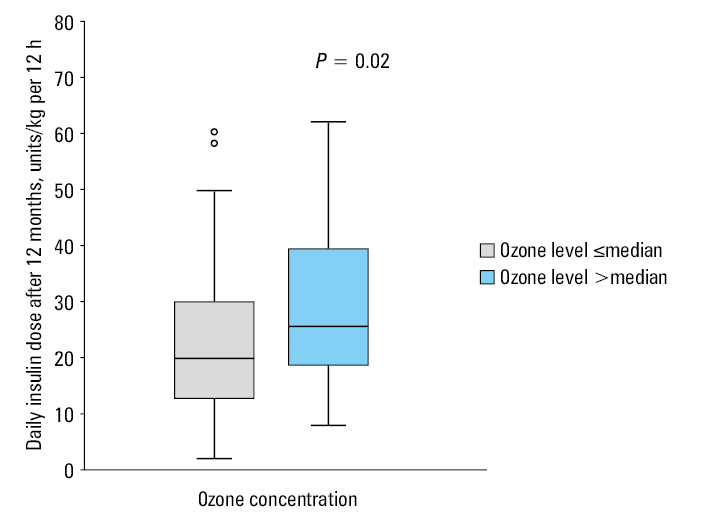
We observed the remission more often in the group of patients where the ambient ozone level was below or equal to the median (median O3, 45.2 µg/m3; IQR, 29.9–63; 65% vs 35%; P <0.001) (Figure 1). The remission was also more frequent when T1D was diagnosed in the cold season (60% vs 40%; P = 0.005) (Figure 2). Moreover, in the group with ambient ozone concentrations above the median, CPE levels were lower (P = 0.01), daily insulin requirement was higher (P = 0.02), and HbA1c levels measured after 12 months were higher (P = 0.005) in comparison with the group with O3 concentration below the median (Figures 3, 4, 5). The multivariable logistic regression model revealed that ozone concentration, independently of sex and smoking status, impacted remission after 12 months from the diagnosis (Table 2). The higher the ozone level in the month of diagnosis and the older the patient, the lower the odds for remission (odds ratio [OR], 1.06; 95% CI, 1.03–1.09; P <0.001 and OR, 0.88; 95% CI, 0.79–0.98; P = 0.02, respectively). Also, we found a weak positive correlation between ozone concentrations within the month of T1D diagnosis and the levels of HbA1c measured at 12 months from the diagnosis (R = 0.34; P <0.001).
Parameter | OR | 95% CI | P value |
Abbreviations: OR, odds ratio | |||
Ozone, above median | 1.06 | 1.03–1.09 | <0.001 |
Age at diagnosis, y | 0.88 | 0.79–0.98 | 0.02 |
Male sex | 0.76 | 0.25–2.29 | 0.61 |
Smoking | 0.37 | 0.12–1.17 | 0.09 |
Discussion
This study supports the hypothesis that air pollution resulting in higher ozone air concentration may have an unfavorable impact on the course of disease in adult patients diagnosed de novo with T1D. Previous studies on air pollution affecting T1D were primarily performed in children, and focused on the correlation between poor‑quality air and the incidence of T1D. Hathout et al25 found that children diagnosed with T1D had higher exposure to O3 and SO4 than healthy children (P <0.001, P = 0.006, respectively). Furthermore, Di Ciaula26 proved that PM10 concentrations in Apulia (Italy) played a crucial role in the number of new T1D diagnoses in children, mainly above the age of 5. A study from Sweden27 indicated that living in an area with elevated levels of air pollution (O3, NOx) during pregnancy is associated with an increased risk of T1D in offspring. The authors found that mothers of children who developed T1D, more often lived in the areas with higher NOx levels during the third trimester or with higher ozone levels in the second trimester of their pregnancy. All mentioned studies showed a relationship between air quality and T1D. Additionally, our finding that the remission rate was higher in the cold season of the year is in line with our main conclusion that ozone concentration may contribute to the remission 12 months after the T1D diagnosis. The ozone levels in colder seasons are usually lower than in the summer, when solar radiation is stronger, and more ground ozone is formed.14
The metabolic alterations caused by ozone are similar to fight‑or‑flight responses involving adrenal‑derived hormones.28 Miller et al29 showed that ozone exposure in humans was related to increased levels of fatty acids in the circulation and increased concentrations of cortisol and corticosterone, suggesting activation of the neurohormonal stress response pathway. Elevated levels of circulating stress hormones result in diminished pancreatic insulin secretion, and regulate a wide array of processes associated with glucose metabolism characterized by fasting hyperglycemia, glucose intolerance, and increased hepatic gluconeogenesis.20,28-32
The ozone impact on insulin resistance is, however, controversial. Some studies claimed that ozone does not affect impaired insulin sensitivity.20,28 In contrast, Vella et al33 demonstrated that exposure of rats to ozone induced whole‑body insulin resistance and oxidative stress through muscle c‑Jun N‑terminal kinase activation, which might be associated with high ozone concentration and long‑time exposure.
Furthermore, Zhong et al21 found that ozone triggers a specific immune response in the exposed mice, that is, an increase in the levels of tumor necrosis factor α, interferon γ, and a marker for natural killer cells. Decreased levels of those biomarkers were reported by Tang et al34 at the beginning of the remission phase in T1D.
Smoking was another critical issue while discussing air pollution as a risk factor for lack of remission. Nicotine intake is associated with poorer glycemic control, decreased insulin sensitivity, and it impacts the length of the remission phase.35,36 In this study, we demonstrated the smoking‑independent effect of ozone on remission, which gave a new insight into the determinants of the early course of T1D.
Our study shows the consequences of ozone‑induced metabolic effects. The patients from the group with ozone concentrations above the median had lower levels of CPE, higher daily insulin requirements, and higher levels of HbA1c. These findings support the thesis that increased ozone concentration may contribute to worse metabolic outcomes and reduced remission in T1D. Although the exact mechanisms have not been fully explored, higher ozone level in the month of T1D diagnosis may escalate β-cell dysfunction, evoke immune changes, and disturb temporary metabolic compensation. In addition, activation of the neuroendocrine pathway and the role of corticosteroids are crucial in mediating the glucose metabolic effect.37 Thus, ozone exposure treated as a stress factor exacerbates metabolic impairment.28
The ozone concentration values in the official 5‑year air quality assessment in the Wielkopolska region in the years 2014–2018, provided by the regional department of the Chief Inspectorate for Environmental Protection in Poland38 exceeded the acceptable level or fell between the acceptable level and the upper assessment threshold. In that report, the ozone influence on people’s health was taken into consideration. Therefore, public health policies and governments should pay more attention to air quality, as the air pollution‑related burden of disease is significant.39-41 Moreover, people living in more polluted regions should be aware of their poorer prognosis. They may try to act more actively in other areas, such as diet, physical activity, and smoking cessation, all of which have proven to improve remission chances.10,12,36,42 Finally, it should be a part of a health care professional’s job to outline to newly‑diagnosed patients the key areas to focus on to increase the chance of remission and a better course of the disease.43
The main limitation of our study is that the contaminant concentration was only measured outdoors at the monitoring station closest to patients’ permanent residence, and there are only a few stations in Wielkopolska. In this study, we did not account for patient travels and indoor pollution levels. This is a pitfall of many epidemiologic air pollution studies based on measurements from the open‑air monitoring stations. Another limitation regarding the assessment of air pollution is the occurrence of weather‑dependent variables, such as humidity, wind, or solar radiation, that may impact the level of air pollution concentration. In the present study, we investigated the air pollution levels in the calendar month of diagnosis, as we suspected a possible relationship between poor air quality and metabolic decompensation in adults developing T1D. Therefore, we studied the association of ozone levels and early course of T1D by checking the presence of significant remission at 12 months after the diagnosis. Further studies concerning more time‑specified and prolonged air pollution measurements, with more advanced and personalized air pollution level calculations are required to provide more insights into the relationship between poor air quality and early course of T1D in adults.
Conclusions
Increased ozone concentration within the month of T1D diagnosis may contribute to a lack of remission after 12 months. In addition, higher ozone level might be associated with metabolic decompensation in this population. Metabolic decompensation is more likely in the group of patients experiencing higher ozone levels in the month of T1D diagnosis. Since the remission phase is highly beneficial for T1D patients, identifying its modifiable risk factors might be crucial to improve the disease trajectory.
- Atkinson MA, Eisenbarth GS. Type 1 diabetes: new perspectives on disease pathogenesis and treatment. Lancet Lond Engl. 2001; 358: 221‑229. | Crossref
- Aasbjerg K, Nørgaard CH, Vestergaard N, et al. Risk of diabetes among related and unrelated family members. Diabetes Res Clin Pract. 2020; 160: 107997. | Crossref
- Niedzwiecki P, Pilacinski S, Uruska A, et al. Influence of remission and its duration on development of early microvascular complications in young adults with type 1 diabetes. J Diabetes Complications. 2015; 29: 1105‑1111. | Crossref
- Niedzwiecki P, Pilacinski S, Uruska A, Zozulinska‑Ziolkiewicz D. Clinical remission of type 1 diabetes predicts higher insulin sensitivity at 7 years from diagnosis of the disease. Diabetes Technol Ther. 2020; 22: 577‑583. | Crossref
- Kara Ö, Esen İ, Tepe D. Factors influencing frequency and duration of remission in children and adolescents newly diagnosed with type 1 diabetes. Med Sci Monit. 2018; 24: 5996‑6001. | Crossref
ARTICLE INFORMATION