Serum expression levels of selected microRNAs and their association with glucose metabolism in young women with polycystic ovary syndrome
Key words: glucose metabolism, insulin sensitivity, miR-27a, miR-320, polycystic ovary syndrome


 CC BY-NC-SA 4.0
Serum expression levels of selected microRNAs and their association with glucose metabolism in young women with polycystic ovary syndrome
Introduction: Polycystic ovary syndrome (PCOS) is associated with metabolic disturbances, such as insulin resistance and prediabetes, and the risk for their occurrence is especially increased in hyperandrogenic (HA) phenotypes of PCOS. Circulating microRNAs (miRNAs) may be involved in PCOS pathogenesis and regulation of metabolic processes.
Objectives: The aim of the study was to assess expression levels of selected circulating miRNAs in women with PCOS and to investigate the relationship of these miRNAs with glucose metabolism.
Patients and methods: The study included 95 patients with HA‑PCOS and 76 healthy women similar to the study group in age and body mass index. Measurements of sex hormone concentrations, oral glucose tolerance test (OGTT), and transvaginal ultrasonography were performed. Serum levels of selected miRNAs (miR‑27a, miR‑34a, miR‑106b, miR‑193b, miR‑181a, miR‑181b, and miR‑320) were assessed with real‑time polymerase chain reaction, and their association with PCOS and glucose metabolism parameters was studied.
Results: Serum levels of all studied miRNAs, except for miR‑34a, differed between the patients with HA‑PCOS and healthy women (all P <0.05). In HA‑PCOS, miR‑27a and miR‑320 levels correlated with fasting glucose (R = 0.33; P = 0.001 and R = –0.35; P <0.001, respectively) and insulin concentrations (R = 0.26; P = 0.01 and R = –0.23; P = 0.03, respectively). Additionally, the level of miR‑27a correlated with mean glucose concentration during OGTT (R = 0.26; P = 0.01). No such correlations were observed in the healthy women. In linear regression analyses, both miR‑27a and miR‑320 were associated with fasting glucose concentrations after adjustment for potentially confounding factors in the HA‑PCOS group only.
Conclusions: The expression profile of circulating miRNAs is altered in patients with HA‑PCOS. Circulating miR‑27a and miR‑320 could serve as potential biomarkers of glucose metabolism disturbances in PCOS.
What's new?
Polycystic ovary syndrome (PCOS) is associated with an increased risk of insulin resistance and prediabetes, especially in hyperandrogenic (HA) phenotypes, although their pathogenesis is not fully explained. To date, a limited number of studies focused on microRNAs (miRNAs) as regulators of glucose metabolism in PCOS, and the possible use of circulating miRNAs as biomarkers of metabolic disturbances. The present study demonstrated altered serum expression levels of miRNAs regulating glucose metabolism in PCOS women with HA (HA‑PCOS). In the HA‑PCOS patients, but not in the controls, the levels of circulating miR‑27a and miR‑320 were significantly associated with glucose concentrations and markers of insulin resistance, independently of age, body mass index, and androgen concentrations. The obtained results provide evidence that miR‑27a and miR‑320 are involved in regulation of glucose metabolism in women with HA‑PCOS, and that serum levels of these miRNAs might possibly be used as biomarkers of glucose metabolism disturbances.
Introduction
Polycystic ovary syndrome (PCOS) is the most common endocrine disorder in reproductive‑age women, with prevalence ranging between 5% and 18%.1 The Rotterdam criteria, which are currently most commonly used to diagnose PCOS, include oligo- / amenorrhea (OA), clinical and / or biochemical hyperandrogenism (HA), and polycystic ovarian morphology (PCOM) on transvaginal ultrasound.2 To diagnose PCOS, at least 2 of these features must be present. Consequently, PCOS patients constitute a heterogeneous group, varying in clinical presentation.
The etiology of PCOS has not been fully explained to date. It has been suggested that many genetic, epigenetic, and environmental factors may be involved in its development.1 HA, insulin resistance, and hyperinsulinemia are believed to be constitutional features of PCOS, and intrinsic abnormalities in insulin signaling have been observed in the adipose tissue and skeletal muscles of PCOS patients.3 As a result, women with PCOS are at an increased risk of metabolic disorders, and insulin resistance and abdominal obesity are frequently observed even in normal‑weight PCOS patients.4,5 It has been demonstrated that androgens play an important role in development of metabolic disturbances, and that the highest metabolic risk is associated with HA phenotypes of PCOS, while the normoandrogenic phenotype is considered “milder,” with lower prevalence of obesity, prediabetes, and dyslipidemia.5,6 In addition, a study published recently by our group7 showed an association between adrenal androgen levels and parameters of insulin sensitivity in women with PCOS.
However, HA is only one of the factors responsible for increased metabolic risk in PCOS. In recent years, extensive research focused on microRNAs (miRNAs) has been conducted.8 miRNAs are short, noncoding RNA molecules downregulating post‑transcriptional gene expression in a variety of manners: translational repression, mRNA cleavage, or deadenylation.8 miRNAs have been shown to play an important role in the pathogenesis of cardiovascular and metabolic diseases, diabetes, and various endocrinopathies.9-11 Serum miRNAs, due to their stability in biological fluids, might serve as potential biomarkers, for example, of metabolic diseases.12
A number of miRNAs were found to regulate ovarian function and steroidogenesis.13 In PCOS, the miRNA profile in ovarian granulosa cells and follicular fluid was found to differ from that observed in healthy women.11 Moreover, several studies investigated circulating miRNAs in PCOS patients to identify possible biomarkers of the syndrome, with varying results.13 Differences in miRNA expression between women with different PCOS phenotypes have also been shown.14,15
It has been demonstrated that miRNAs control glucose metabolism and development of obesity through a range of different mechanisms: they influence insulin signaling, glucose transporter type 4 (GLUT4) expression, adipocyte development and differentiation, adipokine secretion, hepatic glucose metabolism, and β-cell function.10,16-18 A number of studies conducted to date have reported differences in the expression of miRNAs in the serum of patients with diabetes and metabolic disorders.19
The aim of the present study was to assess serum expression levels of selected miRNAs, known to be involved in regulation of glucose metabolism and insulin sensitivity, in patients with HA‑PCOS. In addition, we aimed to evaluate the association between the investigated miRNAs and glucose metabolism parameters in the analyzed groups.
Patients and methods
Study participants
Between September 2015 and January 2019, a total of 104 patients with PCOS, diagnosed according to the Rotterdam criteria, were consecutively recruited to the study. Among them, 95 patients were found to present HA‑PCOS phenotypes, while 9 women had a normoandrogenic phenotype (OA+PCOM). As it has been shown that HA and normoandrogenic PCOS phenotypes differ with respect to metabolic risk and miRNA expression, only the patients with HA‑PCOS (n = 95) were included in the study. Seventy‑six women with no history of reproductive disorders, similar to the study group in age and body mass index (BMI), constituted the control group. The women with PCOS were recruited from among the patients of the Department of Internal Medicine and Metabolic Diseases, Department of Endocrinology, Diabetology and Internal Medicine, and Endocrinology Outpatient Clinic at the Medical University of Bialystok, Poland. The women from the control group were volunteers recruited from among the staff and students at the Medical University of Bialystok. The exclusion criteria for both groups comprised age below 18 or over 35 years; other disorders associated with ovulatory dysfunction or androgen excess, that is, Cushing syndrome, hyperprolactinemia, and late‑onset congenital adrenal hyperplasia; use of hormonal contraception or other medications affecting sex hormone levels within the previous 3 months; use of medications affecting glucose metabolism; pregnancy and / or breastfeeding within the previous 12 months; and infection within the previous 30 days.
Clinical assessment
All participants underwent a physical examination with anthropometric measurements. BMI was calculated as body weight in kilograms divided by height in meters squared. Waist circumference was measured at the narrowest circumference between the rib cage and iliac crest, while hip circumference was measured at the maximum circumference at the level of femoral trochanters, and the waist‑to‑hip ratio was calculated accordingly. Hirsutism was evaluated with the modified Ferriman–Gallwey score, with 8 points or more reflecting clinically relevant hirsutism. Clinical hyperandrogenism was defined as the presence of hirsutism, acne, or alopecia.
All participants underwent transvaginal ultrasonography with a 5–9 MHz transvaginal transducer (Voluson 730 Expert, GE Healthcare, Chicago, Illinois, United States), performed by a single gynecologist. The examination was carried out in the early follicular phase in the spontaneously menstruating women, and independently of the cycle phase, at least 3 months after the last menses, in the amenorrheic patients. PCOM was defined as the volume of at least 1 ovary exceeding 10 cm3 and / or the presence of 12 or more follicles in at least 1 ovary.
Biochemical analyses
Blood samples were collected in the morning after an overnight fast, in the early follicular phase in the spontaneously menstruating women, and independently of the cycle phase, at least 3 months after the last spontaneous menses, in the amenorrheic patients. Blood samples were left at room temperature for 30 minutes to allow for complete coagulation. Next, the coagulated samples were centrifuged at 1500 g for 15 minutes at 4 °C to separate serum. The serum was transferred to a new tube with care not to disturb the buffy coat. Then, one part was taken for immunoassays, and the other part was immediately frozen at –80 °C until RNA extraction.
Concentrations of total testosterone were measured with the radioimmunoassay (RIA) (DIASource ImmunoAssays, Louvain‑la‑Neuve, Belgium; minimum detectable concentration, 0.05 ng/ml; intra‑assay coefficient of variation [CV], 3.3%; interassay CV, 4.8%). Biochemical hyperandrogenism was defined as total testosterone concentration greater than 0.7 ng/ml. Concentrations of sex hormone–binding globulin (SHBG) were measured with the immunoradiometric assay (ZenTech, Liège, Belgium). Free androgen index (FAI) was calculated as testosterone [nmol/l] × 100/SHBG [nmol/l]. Concentrations of androstenedione and dehydroepiandrosterone sulfate (DHEA‑S) were measured with RIA (DIASource ImmunoAssays). Serum concentrations of anti‑Müllerian hormone (AMH) were assessed using the enzyme‑linked immunosorbent assay (Beckmann Coulter, Brea, California, United States).
In all participants, the oral glucose tolerance test (OGTT) with the assessment of glucose and insulin concentrations at 0, 30, 60, and 120 minutes was performed. Serum glucose concentrations were assessed using the hexokinase method (Cobas c111, Roche Diagnostic Ltd., Rotkreuz, Switzerland), while insulin concentrations were measured using the immunoradiometric method (DIASource ImmunoAssays). Homeostasis model assessment‑insulin resistance (HOMA‑IR) and the Matsuda index were calculated using the published formulas. Insulin resistance was defined as HOMA‑IR greater than or equal to 2.29, according to Radikova et al.20 Serum concentrations of total cholesterol, high‑density lipoprotein cholesterol, and triglycerides were measured using the enzymatic colorimetric method (Cobas c111, Roche Diagnostic Ltd.). Serum low‑density lipoprotein cholesterol concentration was calculated with the Friedewald formula.21
RNA isolation
Total RNA from serum was extracted using the miRNeasy Serum / Plasma Kit (Qiagen, Venlo, the Netherlands), according to the manufacturers’ protocol. Briefly, 200 ml of serum were mixed with the appropriate volume of a lysis buffer. Synthetic nonhuman Caenorhabditis elegans cel‑miR‑39 was reconstituted in nuclease‑free water (Ambion, Austin, Texas, United States), resulting in a 2 × 10¹⁰ copies/ml stock. The working solution was prepared to provide a 1.6 × 10⁸ copies/ml solution. To achieve technical normalization, all samples were spiked with 3.5 ml of the cel‑miR‑39 working solution. From this point, the manufacturers’ protocols were followed for RNA extraction. Isolated RNA was eluted in nuclease‑free water (Ambion) and stored at –80 °C.
microRNA analysis
cDNA synthesis was performed using the TaqMan MicroRNA Reverse Transcription Kit (Applied Biosystems, Foster City, California, United States). The reaction was performed with 5 ng of total RNA in a total volume of 15 ml. The mixture was incubated at 16 °C for 30 minutes, 42 °C for 30 minutes, and 85 °C for 5 minutes, as recommended by the manufacturer. TaqMan miRNA probes (cel‑miR‑39, catalog no. #000200; miR‑27a‑3p, #000408; miR‑34a‑5p, #000426; miR‑106b‑5p, #000442; miR‑181a‑5p, #000480; miR‑181b‑3p; #462578_mat; miR‑193b‑3p, #002367; miR‑320a‑3p, #002277; Applied Biosystems) were used to assess the selected miRNA expression profiles. Real‑time polymerase chain reaction (PCR) assays were performed in a total of 20 ml reaction volume with TaqMan Universal PCR Master Mix, no AmpErase UNG (Applied Biosystems). Each sample was processed in doublets with initial denaturation at 95 °C for 10 minutes, followed by 40 amplification cycles at 95 °C for 15 seconds and at 60 °C for 60 seconds, using the 7500 Real‑Time PCR System (Applied Biosystems). The miRNA Ct‑values were normalized using exogenous cel‑miR‑39.
Statistical analysis
Statistical analyses were conducted using Statistica 13.0 (Statsoft, Kraków, Poland), Stata 17.0 (StataCorp, College Station, Texas, United States), and GraphPad Prism 9 (GraphPad Software, Boston, Massachusetts, United States) packages. Due to non‑normal distribution of the data, nonparametric tests were applied. The Mann–Whitney test was used to compare continuous variables between the HA‑PCOS patients and controls, while the χ2 test was used to compare the prevalence of prediabetes and insulin resistance between the analyzed groups. Continuous variables were described as medians (interquartile ranges), while categorical variables were presented as numbers and percentages. Correlations between the analyzed variables were assessed with the Spearman correlation coefficient. Univariable linear regression was applied to evaluate the association of the studied miRNAs with glucose metabolism parameters. In the next step, regression models were adjusted for age, BMI, and the concentrations of SHBG and testosterone. The models were described using variable coefficients (B), P values derived from the Wald test, and coefficients of determination for the model (R2). Statistical significance was assumed at P values below 0.05.
Ethics
The study was conducted in accordance with the Declaration of Helsinki and approved by the Ethics Committee at the Medical University of Bialystok (R‑I‑002/221/2016 and APK.002.9.2020). All women participated in the study voluntarily. Written informed consent was obtained from the participants after full explanation of the purpose and nature of all the applied procedures.
Results
No differences in age and anthropometric parameters were observed between the women with HA‑PCOS and controls. As expected, higher concentrations of testosterone, androstenedione, DHEA‑S, and AMH, as well as greater FAI, ovarian volumes, and ovarian follicle numbers were found in the women with HA‑PCOS in comparison with the control group (all P <0.05). Additionally, concentrations of SHBG were lower in the HA‑PCOS group. Clinical and hormonal characteristics of the study population are presented in Table 1.
Parameter | PCOS group (n = 95) | Control group (n = 76) | P value |
Data are presented as median (interquartile range).
P values were derived from the Mann–Whitney test; P values below 0.05 were considered significant.
SI conversion factors: to convert total testosterone to nmol/l, multiply by 3.467; androstenedione to nmol/l, by 3.4916; DHEA‑S to mmol/l, by 0.0271; AMH to pmol/l, by 7.1429.
Abbreviations: AMH, anti‑Müllerian hormone; BMI, body mass index; DHEA‑S, dehydroepiandrosterone sulfate; FAI, free androgen index; OFN, ovarian follicle number; OV, ovarian volume; SHBG, sex hormone–binding globulin; WHR, waist‑to‑hip ratio | |||
Age, y | 23 (21–27) | 25 (23–27) | 0.06 |
BMI, kg/m2 | 23.32 (21.64–28.55) | 22.33 (21–24.93) | 0.08 |
Waist circumference, cm | 79.5 (73–90.5) | 79 (74–85) | 0.63 |
WHR | 0.81 (0.77–0.86) | 0.8 (0.77–0.85) | 0.41 |
Ferriman–Gallwey score, points | 8 (5–11) | 3 (1–5) | <0.001 |
Testosterone, ng/ml | 0.78 (0.63–0.9) | 0.57 (0.45–0.69) | <0.001 |
SHBG, nmol/l | 49.2 (30.7–71.5) | 62.2 (44.0–90.5) | 0.004 |
FAI | 5.76 (3.48–8.44) | 3.09 (2.04–4.61) | <0.001 |
Androstenedione, ng/ml | 4.12 (3.2–4.96) | 3.26 (2.64–4.08) | <0.001 |
DHEA‑S, μg/dl | 319.1 (242.2–406.2) | 255.1 (189.3–340.3) | 0.001 |
AMH, ng/ml | 8.32 (5.53–12.82) | 5.90 (2.89–8.8) | <0.001 |
OV (left + right), cm3 | 14.7 (11.1–18.3) | 11 (7.7–13.8) | <0.001 |
OFN (left + right) | 20 (16–25) | 13 (11–16) | <0.001 |
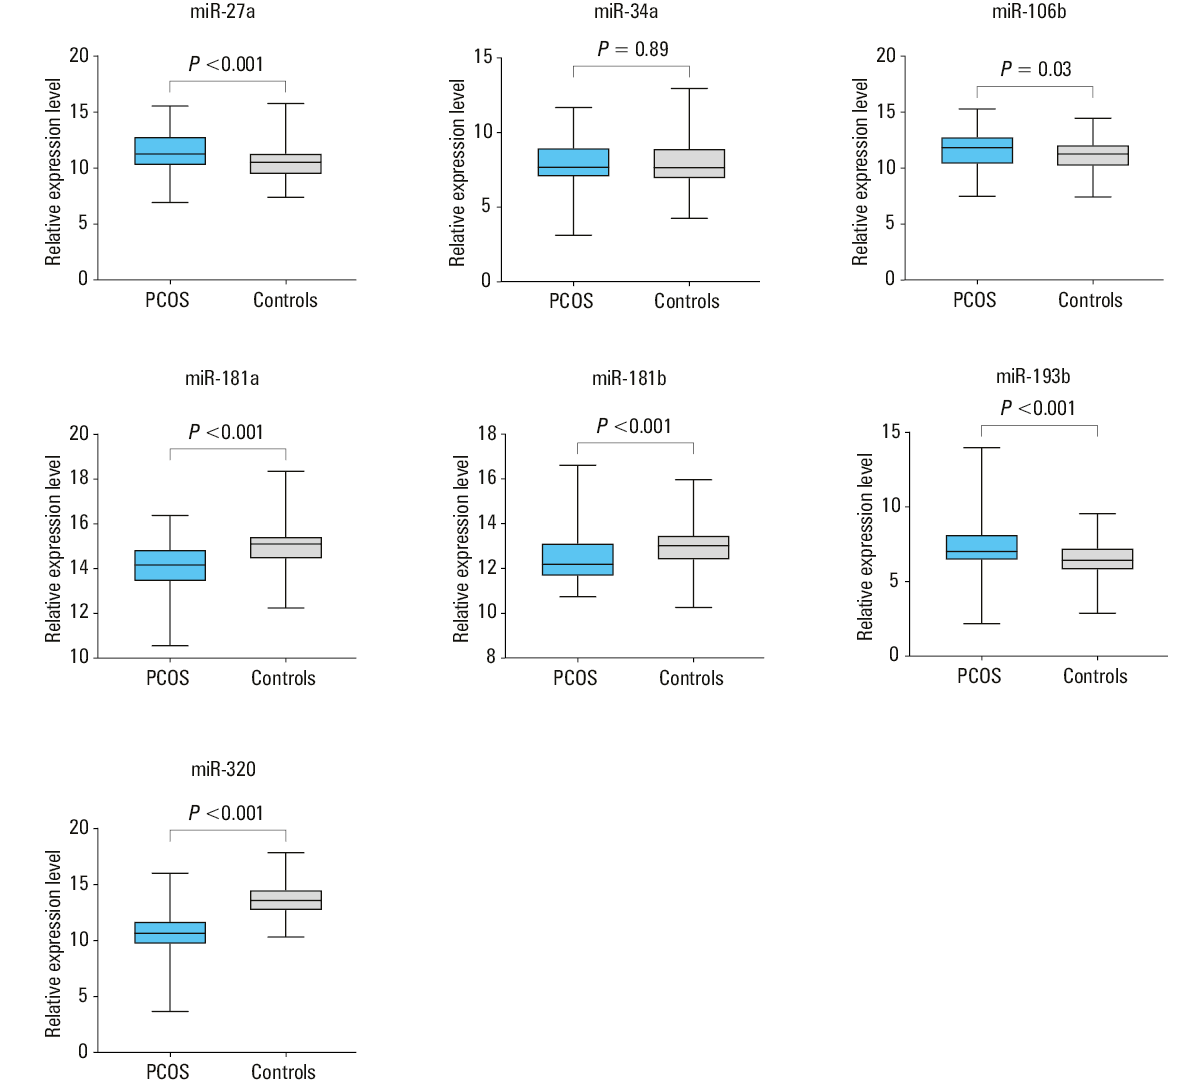
The concentrations of glucose and insulin during OGTT, but not fasting concentrations, were higher in the HA‑PCOS patients than in the controls (Table 2). Mean insulin concentrations and the Matsuda index also differed significantly between the groups, with less favorable values observed in the HA‑PCOS women. The prevalence of prediabetes and insulin resistance was comparable between the groups (P = 0.97 and P = 0.18, respectively). The concentrations of triglycerides were higher in the HA‑PCOS group (P = 0.009). Additionally, we observed higher serum levels of miR‑27a, miR‑106b, and miR‑193b, and lower levels of miR‑181a, miR‑181b, and miR‑320 in the HA‑PCOS patients, as compared with the healthy women (Figure 1). In the women with PCOS and insulin resistance, we observed higher expression levels of miR‑27a and lower expression levels of miR‑320 than in the PCOS patients without insulin resistance (P = 0.003 and P = 0.02, respectively). No such differences were found in the control group.
Parameter | PCOS group (n = 95) | Control group (n = 76) | P value |
Data are presented as median (interquartile range) or number (percentage).
P values were derived from the Mann–Whitney test for continuous variables or the χ2 test for categorical variables. P values below 0.05 were considered significant.
SI conversion factors: to convert glucose to mmol/l, multiply by 0.0555; TC, LDL‑C, and HDL‑C to mmol/l, by 0.0259; triglycerides to mmol/l, by 0.0114.
Abbreviations: HDL‑C, high‑density lipoprotein cholesterol; HOMA‑IR, homeostatic model assessment–insulin resistance; LDL‑C, low‑density lipoprotein cholesterol; OGTT, oral glucose tolerance test; TC, total cholesterol | |||
Glucose at 0 min of OGTT, mg/dl | 92 (89–98) | 93 (88–97) | 0.64 |
Glucose at 30 min of OGTT, mg/dl | 141 (121–153) | 132 (117–141) | 0.02 |
Glucose at 60 min of OGTT, mg/dl | 115 (89–133) | 101 (83–120) | 0.005 |
Glucose at 120 min of OGTT, mg/dl | 93 (81–107) | 92 (78–105) | 0.54 |
Insulin at 0 min of OGTT, mIU/ml | 9.23 (7.28–13.55) | 7.83 (6.89–11.63) | 0.13 |
Insulin at 30 min of OGTT, mIU/ml | 71.47 (47.02–106.85) | 67.50 (50.34–84.7) | 0.41 |
Insulin at 60 min of OGTT, mIU/ml | 67.05 (38.52–109.87) | 47.43 (34.35–70.04) | 0.003 |
Insulin at 120 min of OGTT, mIU/ml | 34.41 (18.27–59.14) | 29.92 (21.02–44.57) | 0.36 |
Mean glucose during OGTT, mg/dl | 111 (94–123.3) | 100.9 (93.5–114.4) | 0.05 |
Mean insulin during OGTT, mIU/ml | 47.33 (32.97–69.84) | 37.85 (29.65–55.33) | 0.03 |
HOMA‑IR | 2.15 (1.62–3.16) | 1.82 (1.56–2.79) | 0.14 |
Matsuda index | 4.76 (3.4–6.65) | 5.76 (4.19–7.31) | 0.02 |
Prediabetes | 19 (20) | 15 (19.7) | 0.97 |
Insulin resistance | 42 (44.2) | 26 (34.2) | 0.18 |
TC, mg/dl | 170 (157–192) | 170 (149–193) | 0.86 |
LDL‑C, mg/dl | 91.3 (76.8–108.6) | 90.2 (74.0–105.2) | 0.46 |
HDL‑C, mg/dl | 65 (55–74) | 64 (58–81) | 0.24 |
Triglycerides, mg/dl | 64 (49–91) | 57 (40–74) | 0.009 |
In the HA‑PCOS patients, the levels of miR‑27a and miR‑320 correlated with fasting glucose (R = 0.33; P = 0.001 and R = –0.35; P <0.001, respectively) and insulin concentrations (R = 0.26; P = 0.01 and R = –0.23; P = 0.03, respectively), as well as with HOMA‑IR (R = 0.27; P = 0.007 and R = –0.27; P = 0.008, respectively). In addition, the level of miR‑27a correlated positively with glucose concentration at 60 and 120 minutes of OGTT (R = 0.26; P = 0.01 and R = 0.21; P = 0.04, respectively) and with mean glucose concentration (R = 0.26; P = 0.01). No such correlations were observed in the control group, although miR‑34a was found to correlate with glucose concentration at 60 minutes of OGTT in the healthy women (R = –0.25; P = 0.03).
To investigate the influence of miRNAs on glucose metabolism in the HA‑PCOS patients, we performed linear regression analyses with each miRNA as an independent variable and parameters derived from OGTT as dependent variables. In the HA‑PCOS group, miR‑27a and miR‑320 levels were individually associated with fasting glucose concentration in the univariable linear regression analysis (Table 3); such correlations were not observed in the control group. These associations remained significant after adjustment for age, BMI, and SHBG and testosterone concentrations (Table 3). In the stepwise backward regression analysis (Table 4), the factors affecting fasting glucose concentrations were the expression levels of miR‑27a and miR‑320 and BMI. Additionally, only the expression level of miR‑27a, after adjustment for age, BMI, and SHBG and testosterone concentrations, showed an association with mean glucose concentration during OGTT (for miR‑27a: B = 1.959; P = 0.048; adjusted R2 of the model = 0.246). It was also associated with glucose concentration at 120 minutes of OGTT and HOMA‑IR in the univariable regression analysis, although the level of significance was not achieved after adjustment for the aforementioned factors. None of the studied miRNAs was associated with insulin concentrations at any point of OGTT.
Independent variables | Univariable models | Adjusted models | ||||
B | P value | Adjusted R2 | B | P value | Adjusted R2 | |
Associations between fasting glucose concentration (dependent variable) and each studied microRNA (independent variables) were first assessed with a univariable linear regression analysis. In the next step, age, body mass index, and the concentrations of sex hormone binding–globulin and testosterone were added to each model.
The results were described as variable coefficients (B), P values, and coefficients of determination (R2). P values below 0.05 were considered significant. | ||||||
miR‑27a | 1.124 | 0.008 | 0.063 | 0.86 | 0.04 | 0.12 |
miR‑34a | 0.228 | 0.65 | –0.009 | –0.019 | 0.97 | 0.077 |
miR‑106b | –0.429 | 0.39 | –0.003 | –0.522 | 0.28 | 0.089 |
miR‑181a | –1.115 | 0.11 | 0.018 | –1.022 | 0.13 | 0.102 |
miR‑181b | –0.097 | 0.91 | –0.011 | –0.276 | 0.72 | 0.082 |
miR‑193b | 0.098 | 0.84 | –0.01 | 0.002 | >0.99 | 0.088 |
miR‑320 | –1.032 | 0.002 | 0.092 | –0.809 | 0.014 | 0.145 |
Independent variables | Full model | Final model | ||||
B | P value | Adjusted R2 | B | P value | Adjusted R2 | |
Variables entered into the model: serum expression level of miR‑27a, serum expression level of miR‑320, age, body mass index (BMI), sex hormone–binding globulin (SHBG) concentration, testosterone concentration. Fasting glucose concentration was used as a dependent variable. | ||||||
miR‑27a | 0.823 | 0.04 | 0.174 | 0.94 | 0.02 | 0.171 |
miR‑320 | –0.786 | 0.02 | –0.878 | 0.006 | ||
Age | 0.234 | 0.27 | – | – | ||
BMI | 0.208 | 0.223 | 0.306 | 0.04 | ||
SHBG | –0.029 | 0.3 | – | – | ||
Testosterone | 4.926 | 0.15 | – | – | ||
Discussion
The aim of the present study was to assess the levels of circulating miRNAs known to be involved in glucose metabolism in young women with HA phenotypes of PCOS, and to explore the utility of these miRNAs as potential biomarkers of dysglycemia in this group. The study demonstrated altered serum expression levels of all studied miRNAs (except for miR‑34a) in the women with HA‑PCOS. In the PCOS patients, but not in the control women, the levels of circulating miR‑27a and miR‑320 were significantly associated with glucose concentrations and markers of insulin resistance, independently of age, BMI, and androgen concentrations, suggesting involvement of these miRNAs in glucose metabolism regulation in this group of patients.
The selection of miRNAs for the present study was based on their role in glucose metabolism and insulin sensitivity, and we included miRNAs that have not been extensively studied in this context in women with PCOS. On the basis of the available literature, 7 miRNAs regulating glucose metabolism in different organs and tissues were chosen. In the skeletal muscle, miR‑27a, miR‑106b, and miR‑320 target GLUT4 via a number of different pathways, while miR‑106b also regulates mitochondrial function by targeting mitofusin‑2.17 In the adipose tissue, they regulate adipocyte differentiation, adipose tissue inflammation, and adipokine secretion (miR‑27a, miR‑34a, miR‑181a, miR‑193b).16,22 In the liver, miR‑34a, miR‑181a, and miR‑181b regulate the sirtuin‑1 expression, while miR‑27a and miR‑181b are involved in gluconeogenesis and glycogen synthesis.17,23,24 In addition, miR‑34a impairs β-cell function and promotes apoptosis by targeting molecules involved in first‑phase insulin secretion and antiapoptotic factors.16
Circulating miRNAs have gained attention in recent years as potential biomarkers of PCOS. To date, a substantial number of differentially expressed miRNAs have been identified. In a recent study, Insenser et al25 investigated the diagnostic potential of miR‑142 and miR‑598, and concluded that, in addition to other clinical and laboratory parameters, they might be useful in PCOS diagnosis. Romero‑Ruiz et al26 proposed a model based on 10 miRNAs to discriminate between women with and without PCOS in subgroups of obese and nonobese individuals; however, none of the miRNAs studied in the present report were investigated. Similarly to our results, altered levels of serum miR‑27a, miR‑193b, and miR‑320 were demonstrated in PCOS.27-29 In contrast, Soyman et al30 found comparable values of miR‑320 serum expression levels, while Long et al31 observed altered levels of miR‑106b and miR‑320 in women with PCOS, although the differences were not significant. Diaz et al32 demonstrated decreased levels of miR‑106b, miR‑451a, miR‑652, and miR‑206 in adolescent girls with PCOS, as well as significant correlations of these miRNAs with hormonal and metabolic parameters. A recent meta‑analysis identified miR‑320 as one of the possible markers of PCOS.33 However, it is difficult to directly compare the published studies, as the analyzed populations included women of variable age, BMI, ethnicity, and insulin resistance status, which could all influence the results.34,35
It has been demonstrated that women with PCOS are at an increased risk of developing prediabetes and type 2 diabetes (T2D), and that PCOS is frequently accompanied with insulin resistance.36,37 Our previous report, including a subset of the women analyzed in the present study, showed an association between androgen concentrations, including adrenal‑derived 17‑hydroxprogesterone, and the parameters reflecting insulin sensitivity.7 In the present study, 2 miRNAs showing the closest association with glucose metabolism in PCOS patients were miR‑27a and miR‑320; both were associated with fasting glucose concentrations, while miR‑27a additionally correlated with mean glucose concentrations during OGTT. It has been shown that miR‑27a and miR‑320 are involved in insulin sensitivity regulation, and their serum levels were altered in patients with T2DM, prediabetes, and metabolic syndrome.38,39 Adipocyte‑derived miR‑27a targets peroxisome proliferator‑activated receptor γ (PPAR-γ), which results in a decreased expression of GLUT4 and impaired insulin‑mediated glucose uptake via the PPAR-γ-phosphatidylinositol 3‑kinase (PI3K)/protein kinase B (AKT)-GLUT4 signaling axis. It also downregulates mitogen‑activated protein kinase 14.18,40 In addition, miR‑27a was shown to promote adipocyte hypertrophy and macrophage infiltration and activation in the adipose tissue.40,41 In insulin‑resistant adipocytes, miR‑320 was upregulated and targeted phosphoinositide 3‑kinase, which led to a decrease in GLUT4 levels, confirming its contribution to insulin resistance development.42 miR‑320 also regulates the expression of insulin‑like growth factor‑1 and its receptor.43 Cirillo et al44 observed downregulation of miR‑320 in granulosa cells of women with PCOS and its significant association with insulin concentrations, which might suggest its role in regulating insulin sensitivity in the ovary. It has been demonstrated that the levels of circulating miR‑27a are increased, while the levels of miR‑320 are decreased, in PCOS patients with insulin resistance, in comparison with non–insulin‑resistant PCOS women, and that miR‑27a levels are reduced after metformin treatment.29,45 As both miRNAs are known regulators of insulin action, their alterations in PCOS patients found in the present study might suggest a higher risk of glucose metabolism disturbances in this group of patients, although functional studies are warranted to help explain the underlying mechanisms.
The regression analyses in the present study were adjusted for factors that are known to influence glucose metabolism and insulin sensitivity, that is, age, BMI, and the concentrations of SHBG and testosterone. After inclusion of these variables in the models, the correlations between miR‑27a and miR‑320 and glucose concentrations remained significant. We can therefore hypothesize that serum miR‑27a and miR‑320 might be proposed as potential biomarkers of glucose metabolism disturbances in women with PCOS, although this hypothesis requires further research.
Interestingly, no associations between miR‑27a or miR‑320 and glucose metabolism were observed in the control group. In contrast, only miR‑34a showed a moderate correlation with glucose concentrations in the healthy women. It was also the only studied miRNA that did not differ between the PCOS patients and the control group. Similar to miR‑27a and miR‑320, miR‑34a regulates metabolic processes in visceral adipose tissue, but also pancreatic β-cell proliferation and function, as well as hepatic glucose and lipid metabolism.16,24 In the liver, miR‑34a decreases the levels of sirtuin‑1, leading to increased hepatic gluconeogenesis.24 Although elevated serum levels of miR‑34a were found in T2D,10 few studies described it in patients with PCOS: Butler et al46 showed that serum miR‑34a level did not differ from that found in healthy women, while Tian‑Min et al47 observed that it was upregulated in the follicular fluid of the PCOS women. However, both studies included a limited number of patients, and therefore further research is necessary to investigate whether miR‑34a contributes to development of PCOS and associated complications.
Several limitations of the present study must be addressed. First, the group of PCOS patients included only women with HA phenotypes, which allowed for greater homogeneity of the group, but at the same time made it impossible to extend the obtained results onto patients with a normoandrogenic PCOS phenotype. Additionally, testosterone concentrations were assessed using RIA, and not liquid chromatography‑mass spectrometry, which is the gold‑standard method for steroid hormone assessment. Moreover, the miRNAs that were included in the study were selected a priori based on the literature. Finally, circulating miRNAs do not directly reflect their expression and function in different tissues.
Conclusions
The results of the present study suggest that the profile of circulating miRNAs is altered in HA‑PCOS patients in comparison with healthy women. miR‑27a and miR‑320 seem to be associated with glucose metabolism in women with HA‑PCOS, although further functional studies are necessary to investigate the underlying mechanisms. Both miRNAs might possibly be considered as potential biomarkers of glucose metabolism disturbances in this group of patients, although their diagnostic value needs to be verified in future research.
- Joham AE, Norman RJ, Stener‑Victorin E, et al. Polycystic ovary syndrome. Lancet Diabetes Endocrinol. 2022; 10: 668‑680. | Crossref
- Rotterdam ESHRE/ASRM‑Sponsored PCOS Consensus Workshop Group. Revised 2003 consensus on diagnostic criteria and long‑term health risks related to polycystic ovary syndrome. Fertil Steril. 2004; 81: 19‑25. | Crossref
- Diamanti‑Kandarakis E, Dunaif A. Insulin resistance and the polycystic ovary syndrome revisited: an update on mechanisms and implications. Endocr Rev. 2012; 33: 981‑1030. | Crossref
- Conway G, Dewailly D, Diamanti‑Kandarakis E, et al. The polycystic ovary syndrome: a position statement from the European Society of Endocrinology. Eur J Endocrinol. 2014; 171: P1‑P29. | Crossref
- Condorelli RA, Calogero AE, Di Mauro M, et al. Androgen excess and metabolic disorders in women with PCOS: beyond the body mass index. J Endocrinol Invest. 2018; 41: 383‑388. | Crossref
ARTICLE INFORMATION