Echocardiographic predictors of positive left ventricular remodeling in patients with a history of active myocarditis
Key words: active myocarditis, global longitudinal strain, mechanical dispersion, remodeling


 CC BY-NC-SA 4.0
Echocardiographic predictors of positive left ventricular remodeling in patients with a history of active myocarditis
Introduction: Myocarditis may be difficult to diagnose because of the variety of its clinical manifestations, and the clinical course of the disease can be unpredictable. Nevertheless, some patients may exhibit partial or full contractile recovery following myocarditis. Standard and speckle‑tracking echocardiography may serve as tools to follow this recovery.
Objectives: We aimed to evaluate predictors of positive left ventricular (LV) remodeling after active myocarditis (AM).
Patients and methods: A database of a high‑volume, tertiary cardiology center was searched for patients with AM hospitalized between 2016 and 2019. They were included in the analysis based on clinical manifestations and presence of at least 1 of the following diagnostic criteria: positive findings on electrocardiography / Holter monitoring, echocardiography, elevated troponin T/I levels, functional or structural abnormalities on cardiac imaging, or tissue characterization by cardiac magnetic resonance. LV global longitudinal strain and mechanical dispersion (MD; defined as SD of the time to peak longitudinal strain derived from all LV segments in 3 apical views) were determined. Echocardiographic response (positive LV remodeling measured by transthoracic echocardiography) was defined as end‑systolic volume (ESV) reduction by 15% or greater or end‑diastolic volume (EDV) reduction by 15% or greater from the baseline values.
Results: A total of 61 consecutive patients were recruited. The median follow‑up was 1.4 years (range, 0.3–4). The mortality rate was 1.6%. Echocardiographic response was noted in 24 patients (39.4%). A multivariable Cox regression model including significant baseline differences as covariates showed that QRS duration (hazard ratio [HR], 1.31; 95% CI, 1.17–1.57; P = 0.049), MD (HR, 1.03; 95% CI, 1.01–1.07; P = 0.04), and mineralocorticoid receptor antagonist [MRA] use (HR, 8.60; 95% CI, 1.50–46.49; P = 0.01) were independently associated with positive LV remodeling with ESV reduction. MD (HR, 1.04; 95% CI, 1.02–1.06; P = 0.04) was also independently associated with positive LV remodeling with EDV reduction.
Conclusions: Mechanical dispersion, QRS duration, and MRA use are independent predictors of positive LV remodeling in individuals with a history of AM.
What's new?
The occurrence of ventricular remodeling in myocarditis and the clinical course of the condition are difficult to predict. We aimed to assess predictors of left ventricular (LV) remodeling in patients with a history of active myocarditis (AM). Mechanical dispersion, QRS duration, and the use of mineralocorticoid receptor antagonists were identified as independent predictors of positive LV remodeling in our study population. These findings may be useful for determining the prognosis of individuals with AM. Our study provides novel data on real‑world practice in the context of knowledge gaps that need to be addressed.
Introduction
Active myocarditis (AM) may be difficult to diagnose due to the variety of its clinical manifestations. In most cases the disease resolves spontaneously; however, in some patients, inflammation may lead to extensive scarring that promotes left ventricular (LV) remodeling. This process may result in development of dilated cardiomyopathy or, alternatively, hypokinetic nondilated cardiomyopathy.1
In a retrospective registry of AM cases, 26.6% of patients presented LV systolic dysfunction, cardiogenic shock, or ventricular arrhythmias.2 Echocardiography is an essential tool for the assessment of patients with suspected AM, and may provide helpful findings suggestive of the condition, such as regional dysfunction detected by tissue Doppler imaging, increased wall thickness, mild segmental hypokinesia, mild right ventricular dysfunction, LV diastolic dysfunction, abnormal myocardial echogenicity, or pericardial effusion.3 Moreover, the cardiac function may change promptly during AM, either spontaneously or after treatment.4 Echocardiography may add valuable information on the prognosis of patients with AM. Global longitudinal strain (GLS) and mechanical dispersion (MD) are promising markers of cardiac arrhythmias and sudden cardiac death in individuals with both nonischemic and ischemic cardiomyopathy.5
Despite substantial progress in understanding the course of the disease, there are still knowledge gaps regarding diagnosis, prognostication, and treatment of AM. Factors allowing for identification of low- and high‑risk individuals could broaden our knowledge of this entity, potentially improving patient outcomes.
The aim of this study was to evaluate predictors of positive LV remodeling in patients with a history of AM.
Patients and methods
The study population included 61 consecutive patients with AM confirmed by magnetic resonance imaging (MRI), hospitalized in the Department of Cardiology, Congenital Heart Diseases and Electrotherapy of the Silesian Center of Heart Diseases in Zabrze between 2016 and 2019. The participants were recruited based on clinical presentation and presence of at least 1 diagnostic criterion from individual categories, such as positive findings on electrocardiography / Holter monitoring, echocardiography, increased troponin T/I levels, functional or structural abnormalities on cardiac imaging, or tissue characterization by cardiac MRI. All participants underwent cardiac MRI. AM was confirmed based on the Lake Louise Criteria.6 Invasive coronary arteriography was performed to exclude acute coronary syndrome. Patients younger than 18 years or those without confirmed AM were excluded from the analysis. The study was performed in accordance with international standards outlined in the Declaration of Helsinki. Due to its observational and retrospective design, the study did not require approval of an ethics committee. Informed consent was obtained from all participants.
Echocardiography
Transthoracic echocardiography (TTE) was performed on admission to the hospital and at the follow‑up visit, using commercially available equipment (Vivid 9, E95, S70, GE Healthcare, Milwaukee, Wisconsin, United States). Digitally stored echocardiography data were assessed retrospectively using the ECHOPAC software (GE Healthcare). Global LV function parameters, end‑diastolic volume (EDV) and end‑systolic volume (ESV), were measured. LV ejection fraction (LVEF) was evaluated according to the Simpson biplane method. The LV longitudinal strain was calculated based on the speckle tracking algorithm for 2‑dimensional data recorded in 2‑chamber, 3‑chamber, and 4‑chamber apical views (Figure 1). Subsequently, longitudinal strain was measured for each myocardial segment and globally for the entire LV. MD was calculated as SD of the time to peak longitudinal strain obtained from all LV segments in 3 apical views. Positive LV remodeling (positive response) was measured by TTE, and was defined as ESV or EDV reduction by 15% from the baseline values.
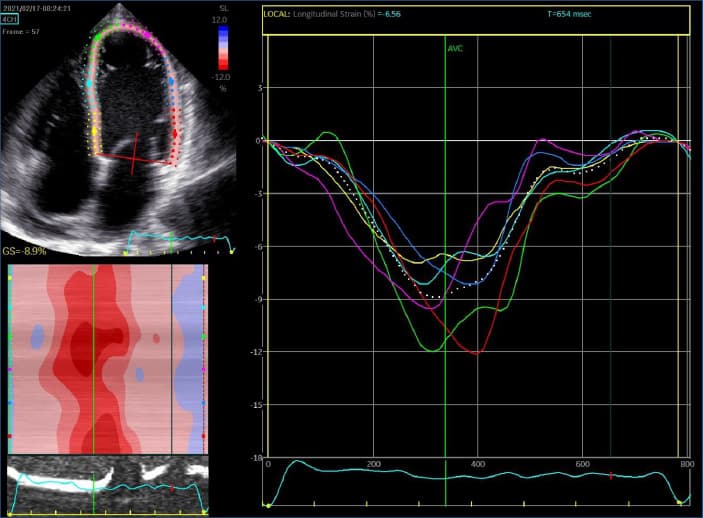
Abbreviations: AVC, aortic valve closure; GS, global strain; SL, longitudinal strain
Follow‑up assessment was performed at least 3 months after discharge. All patients were examined during scheduled visits. The participants were followed from the baseline hospitalization until February 2020.
Statistical analysis
Categorical variables were shown as absolute numbers and percentages. Quantitative variables that did not follow normal distribution were expressed as medians and interquartile ranges. Normally distributed quantitative variables were presented as means with SDs. Comparisons between the groups were performed with the t test or the Mann–Whitney test. The Fisher exact test was used to compare qualitative data between the groups. The descriptive analysis included baseline characteristics of the patients. A 2‑sided P value of less than 0.05 was assumed significant. Independent predictors of positive LV remodeling were analyzed using the proportional hazards method (Cox regression). Results were presented as hazard ratios (HRs) with 95% CIs. The analyses were performed using SAS software, version 9.4 (SAS Institute, Inc., Cary, North Carolina, United States).
Results
A total of 61 consecutive patients were enrolled. The median follow‑up was 1.4 years (range, 0.3–4 years). During the entire follow‑up period, the mortality rate in the study population was 1.6%. No specific evidence‑based treatments were used. One patient received a right ventricular assist device, and 1 individual was an orthotopic heart transplant recipient. Positive response on TTE was observed in 24 patients (39.3%). The patients with echocardiographic response were more likely to have a higher number of premature ventricular contractions on Holter monitoring at baseline than those without echocardiographic response (P <0.05) (Table 1). They also had higher baseline GLS values (P = 0.04) (Table 2) and were more likely to be asymptomatic at the follow‑up visit than those without echocardiographic response (P = 0.002) (Table 3).
Variable | Patients with echocardiographic response (n = 24) | Patients without echocardiographic response (n = 37) | P value |
Data are presented as number (percentage) of patients or median (interquartile range) unless indicated otherwise.
SI conversion factors: to convert hemoglobin to g/l, multiply by 10; troponin T to μg/l, by 1; CK‑MB to μkat/l, by 0.0167; CRP to nmol/l, by 9.524; NT‑proBNP to ng/l, by 1.
Abbreviations: AF, atrial fibrillation; CK‑MB, creatinine kinase–myoglobin binding fraction; CRP, C‑reactive protein; CRT‑D, cardiac resynchronization therapy defibrillator; HR, heart rate; ICD, implantable cardioverter‑defibrillator; NT‑proBNP, N‑terminal pro–B‑type natriuretic peptide; PVC, premature ventricular contraction; WBC, white blood cell count | |||
Female sex | 3 (12.5) | 8 (21.6) | 0.50 |
Age, y | 38 (34–54) | 38 (31–55) | 0.51 |
Fever | 7 (29.2) | 13 (35.1) | 0.78 |
Chest pain | 16 (66.7) | 17 (45.9) | 0.12 |
Dyspnea | 8 (33.3) | 15 (40.5) | 0.58 |
Symptoms of heart failure | 6 (25) | 13 (35.1) | 0.57 |
Shock | 1 (4.2) | 1 (2.7) | 0.76 |
Arterial hypertension | 9 (37.5) | 8 (21.6) | 0.78 |
Paroxysmal AF | 1 (4.2) | 1 (2.7) | 0.15 |
Permanent AF | 3 (12.5) | 2 (5.4) | 0.37 |
Diabetes mellitus | 3 (12.5) | 2 (5.4) | 0.37 |
ICD | 3 (12.5) | 2 (5.4) | 0.37 |
CRT‑D | 0 | 0 | – |
WBC, × 109/l | 8.6 (7.4–11) | 8.6 (6.8–12.1) | 0.1 |
Hemoglobin, g/dl, mean (SD) | 8.8 (0.9) | 9 (1) | 0.96 |
Creatinine, μmol/l | 84 (74–104) | 79 (72–91) | 0.69 |
Troponin T, ng/ml | 0.15 (0.02–0.64) | 0.17 (0.02–0.54) | 0.04 |
CK‑MB, U/l | 4.1 (1.7–13.6) | 5.8 (1.7–32.6) | 0.54 |
CRP, mg/l | 19.6 (4.7–67.3) | 14.6 (5.4–62.2) | 0.1 |
NT‑proBNP, pg/ml | 2263.5 (401.5–4916.5) | 2279 (522.9–7232.5) | 0.21 |
QRS, ms | 99.5 (90.5–107.5) | 100 (91–113.5) | 0.19 |
Average HR (Holter), bpm | 67 (58–74) | 71 (62.5–86) | 0.9 |
Minimum HR (Holter), bpm | 52 (46–63) | 56 (49–62) | 0.92 |
Maximum HR (Holter), bpm, mean (SD) | 101.4 (13.6) | 110 (17.5) | 0.22 |
Number of PVCs (Holter) | 77 (27–346) | 27 (7–391) | 0.004 |
β-Blocker | 20 (83.3) | 33 (89.2) | 0.7 |
Angiotensin‑converting enzyme inhibitors | 18 (75) | 26 (70.2) | 0.78 |
Mineralocorticoid receptor antagonists | 16 (66.7) | 15 (40.5) | 0.12 |
Variable | Patients with echocardiographic response (n = 24) | Patients without echocardiographic response (n = 37) | P value |
Data are presented as median (interquartile range) unless indicated otherwise.
Abbreviations: 2CH, 2‑chamber view; 3CH, 3‑chamber view; 4CH, 4‑chamber view; EDV, end‑diastolic volume; ESV, end‑systolic volume; GLS, global longitudinal strain; LVEF, left ventricular ejection fraction; MD, mechanical dispersion | |||
LVEF, % | 47 (23.5–55) | 50 (26–57) | 0.07 |
EDV, ml | 146 (107.5–183.5) | 115 (92–168.5) | 0.38 |
ESV, ml | 79 (55.5–123.5) | 52 (44–117.5) | 0.44 |
GLS 4CH, % | –18.4 (–20.2 to –7.7) | –12.2 (–17.7 to –8.3) | 0.02 |
GLS 2CH, % | –18.1 (–22.5 to –6.3) | –13.7 (–19.2 to –9) | 0.001 |
GLS 3CH, %, mean (SD) | –12.7 (4.4) | –16.3 (6) | 0.91 |
GLS, % | –18.5 (–21 to –7.3) | –12.7 (–19.1 to –9.8) | 0.04 |
MD, ms | 45.9 (28.6–62.6) | 47.6 (34–60.2) | 0.92 |
Variable | Patients with echocardiographic response (n = 24) | Patients without echocardiographic response (n = 36) | P value |
Data are presented as number (percentage) of patients or median (interquartile range) unless indicated otherwise.
Abbreviations: see Table 2 | |||
Asymptomatic | 23 (95.8) | 31 (86.1) | 0.002 |
Exertional dyspnea | 1 (4.2) | 5 (13.9) | 0.03 |
LVEF, % | 56 (49.3–60) | 55.5 (48–60) | 0.81 |
EDV, ml | 129 (100.5–168.8) | 148.5 (121.8–176.3) | 0.15 |
ESV, ml | 53 (41.8–66) | 64.5 (49.5–81.8) | 0.22 |
GLS 4CH, %, mean (SD) | –15.4 (5.3) | –15.2 (5) | 0.9 |
GLS 2CH, %, mean (SD) | –14.9 (5.9) | –16.2 (5.2) | 0.9 |
GLS 3CH, %, mean (SD) | –14.6 (4.7) | –14.3 (5.9) | 0.9 |
GLS, %, mean (SD) | –14.9 (5.2) | –15.3 (4.9) | 0.79 |
MD, ms | 44.5 (33.8–53.2) | 43.4 (25.8–59.4) | 0.29 |
Predictors of echocardiographic remodeling were calculated based on the data from the last follow‑up visit. The multivariable Cox regression model showed that QRS duration (HR, 1.31; 95% CI, 1.17–1.57; P = 0.049), MD (HR, 1.03; 95% CI, 1.01–1.07; P = 0.04), and the use of mineralocorticoid receptor antagonists (MRAs; HR, 8.6; 95% CI, 1.5–46.49; P = 0.01) were independently associated with positive LV remodeling with ESV reduction (Table 4). Additionally, MD (HR, 1.04; 95% CI, 1.02–1.06; P = 0.04) was found to be independently associated with positive LV remodeling with EDV reduction (Table 5).
Variable | HR | 95% CI | P value |
Fever | 0.42 | 0.09–2.11 | 0.29 |
Chest pain | 0.35 | 0.07–1.72 | 0.19 |
Dyspnea | 1.44 | 0.1–19.98 | 0.79 |
Symptoms of heart failure | 0.89 | 0.08–9.52 | 0.92 |
Age, y | 1.03 | 0.95–1.07 | 0.59 |
WBC, × 109/l | 0.94 | 0.81–1.1 | 0.44 |
Hemoglobin, g/dl | 0.64 | 0.34–1.18 | 0.15 |
Creatinine, μmol/l | 1.04 | 0.98–1.05 | 0.74 |
Troponin T, ng/ml | 0.74 | 0.36–1.55 | 0.43 |
CRP, mg/l | 0.99 | 0.98–1.1 | 0.83 |
NT‑proBNP, pg/ml | 0.97 | 0.93–1.06 | 0.08 |
QRS, ms | 1.31 | 1.17–1.57 | 0.049 |
LVEF, % | 1.45 | 0.97–2.03 | 0.06 |
EDV, ml | 1.09 | 0.93–1.27 | 0.11 |
GLS, % | 1.04 | 0.95–1.14 | 0.37 |
MD, ms | 1.03 | 1.01–1.07 | 0.04 |
β-Blocker | 0.36 | 0.11–1.16 | 0.09 |
Angiotensin‑converting enzyme inhibitors | 1.44 | 0.25–8.31 | 0.68 |
Mineralocorticoid receptor antagonists | 8.6 | 1.5–46.49 | 0.01 |
Variable | HR | 95% CI | P value |
Fever | 0.35 | 0.04–2.9 | 0.33 |
Chest pain | 0.24 | 0.05–1.24 | 0.09 |
Dyspnea | 1.74 | 0.08–18.53 | 0.94 |
Symptoms of heart failure | 1.59 | 0.04–19.71 | 0.95 |
Age, y | 1.04 | 0.98–1.09 | 0.13 |
WBC, × 109/l | 0.98 | 0.81–1.2 | 0.88 |
Hemoglobin, g/dl | 0.7 | 0.31–1.59 | 0.39 |
Creatinine, μmol/l | 0.98 | 0.96–1.04 | 0.91 |
Troponin T, ng/ml | 0.84 | 0.34–2.1 | 0.72 |
CRP, mg/l | 1.03 | 0.98–1.06 | 0.35 |
NT‑proBNP, pg/ml | 0.97 | 0.78–1.13 | 0.22 |
QRS, ms | 0.96 | 0.92–1.03 | 0.34 |
LVEF, % | 0.97 | 0.93–1.12 | 0.21 |
ESV, ml | 1.01 | 0.98–1.08 | 0.09 |
GLS, % | 1.05 | 0.93–1.18 | 0.48 |
MD, ms | 1.04 | 1.02–10.6 | 0.04 |
β-Blocker | 0.19 | 0.02–2.3 | 0.19 |
Angiotensin‑converting enzyme inhibitors | 0.7 | 0.11–4.43 | 0.71 |
Mineralocorticoid receptor antagonists | 4.33 | 0.74–25.34 | 0.1 |
Discussion
Our research provides recent, real‑world clinical practice data concerning the areas with knowledge gaps that need to be addressed. The heterogeneous natural history of myocarditis underlines the importance of determining predictors of short- and long‑term prognosis. The available evidence on the predictors of LV remodeling in AM is scarce. The main findings of the present analysis are as follows: 1) QRS duration, MD, and MRA use are predictors of positive LV remodeling with ESV reduction; 2) MD is independently associated with positive LV remodeling with EDV reduction. These predictors may improve prognostication of patients with AM.
GLS tends to be more precise than LVEF in quantifying the LV function, and additionally has been shown to have a prognostic value.7,8 The higher precision of GLS, as compared with LVEF, may be partly related to the involvement of additional myocardial segments in its assessment. Moreover, strain imaging reflects the intrinsic myocardial deformation better than LVEF. There is evidence that GLS may be useful in indicating early LV systolic dysfunction in many conditions, even when LVEF is still within the normal range.9-11 In our study, GLS was not associated with positive LV remodeling; however, it was initially reduced in the patients without positive remodeling. In a study by Awadalla et al,12 decreased GLS was closely associated with major adverse cardiac events (MACEs) in individuals with immune checkpoint inhibitors–associated myocarditis with both reduced and preserved LVEF. The authors showed that a reduction of GLS by 1% was associated with a 1.5‑fold increase in MACEs in the patients with reduced LVEF, and a 4.4‑fold increase in those with preserved LVEF.
There is evidence that an increase in the dispersion of conduction velocity is associated with greater susceptibility to arrhythmias.13 Electrical abnormalities, as well as local fibrosis, may lead to regional changes in myocardial mechanics, as shown in a series of publications by Haugaa et al.14-16 In our study, MD predicted positive LV remodeling with both EDV and ESV reduction. In the cohort of patients with nonischemic cardiomyopathy, MD greater than 50 ms was associated with a higher incidence of ventricular arrhythmias.17 Hence, MD tends to be an acceptable noninvasive parameter reflecting myocardial diversity and propensity for malignant ventricular arrhythmias.17
In this analysis, QRS duration was found to predict positive LV remodeling with ESV reduction. Ukena et al18 showed that QRS duration was an independent predictor of cardiac death or heart transplantation in patients with myocarditis.
Large prospective interventional trials or registries involving patients with AM are needed. They could help identify low- and high‑risk patients at the time of hospitalization, and assess the risk for evolution to dilated cardiomyopathy at discharge and during follow‑up. The association between MD and ventricular arrhythmias as well as sudden cardiac death requires confirmation based on long‑term observational data.
Limitations
Our study has several limitations that should be reported. Firstly, this was an observational, single‑center study performed at a tertiary care university hospital. Secondly, the study sample was relatively small. Thirdly, from a statistical point of view, a greater volumetric improvement in the group with echocardiographic response (n = 24) was expected due to the more severe baseline clinical condition of these patients. This could have influenced the results, as it was less likely for the individuals with more favorable baseline echocardiographic characteristics to show significant improvement, as compared with those with worse parameters at baseline. Moreover, the end points of our analysis were limited to volumetric parameters, and did not include main clinical end points (eg, all‑cause death, cardiovascular death, or hospitalizations for heart failure).
Conclusions
Mechanical dispersion, QRS duration, and MRA use are independent predictors of positive LV remodeling in patients after AM, and may be useful in assessing the prognosis in this group of patients.
- Towbin JA, Lowe AM, Colan SD, et al. Incidence, causes, and outcomes of dilated cardiomyopathy in children. JAMA. 2006; 296: 1867‑1876. | Crossref
- Ammirati E, Cipriani M, Moro C, et al. Clinical presentation and outcome in a contemporary cohort of patients with acute myocarditis: multicenter Lombardy registry. Circulation. 2018; 138: 1088‑1099.
- Ammirati E, Frigerio M, Adler ED, et al. Management of acute myocarditis and chronic inflammatory cardiomyopathy: an expert consensus document. Circ Heart Fail. 2020; 13: e007405. | Crossref
- Younis A, Matetzky S, Mulla W, et al. Epidemiology characteristics and outcome of patients with clinically diagnosed acute myocarditis. Am J Med. 2020; 133: 492‑499. | Crossref
- van der Bijl P, Bax JJ. Imaging for risk stratification of sudden cardiac death. Herzschrittmacherther Elektrophysiol. 2022; 33: 261‑267. | Crossref
ARTICLE INFORMATION