Recent advances in noninvasive assessment of liver steatosis
Key words: attenuation coefficient, fat quantification, liver steatosis, metabolic dysfunction–associated steatotic liver disease, quantitative ultrasound


 CC BY-NC-SA 4.0
Recent advances in noninvasive assessment of liver steatosis
Due to the steatosis epidemic, methods for noninvasive quantification of the liver fat content are of great interest. Magnetic resonance (MR)-based techniques, including proton MR spectroscopy and MR chemical shift imaging can quantify liver fat by measuring, directly or indirectly (the latter method), the proton density fat fraction, with excellent diagnostic accuracy. These techniques are currently the reference standard for noninvasive assessment of liver steatosis and are used in clinical trials for evaluation of changes in the liver fat content over time. Using ultrasonography (US), 3 different quantitative parameters can be obtained to estimate the liver fat content: attenuation coefficient, backscatter coefficient, and speed of sound. Controlled attenuation parameter (CAP), which estimates attenuation of the US beam, was the first available method for measuring fat content in the liver, and is performed with a nonimaging US system. Currently, several other algorithms are available on B‑mode imaging US systems, and their accuracy is similar to or higher than that of CAP. This review summarizes the current knowledge about the application of these methods in patients with metabolic dysfunction–associated steatotic liver disease.
Introduction
Metabolic dysfunction–associated steatotic liver disease (MASLD), previously referred to as nonalcoholic fatty liver disease (NAFLD), is currently the leading cause of chronic liver disease worldwide. Its prevalence has increased over the last few years, from 25.5% reported before 2005 to 37.8% in 2016 or later.1 MASLD is often a silent disease, even at the late stage of severe fibrosis, and the diagnosis is frequently made incidentally.2
In patients with MASLD, the risk of cardiovascular disease, liver‑related events, and all‑cause mortality is higher than in the general population.3,4 Moreover, it has been shown that the steatosis grade predicts mortality and the risk of type 2 diabetes mellitus (T2DM) development in patients with MASLD.5 Conversely, the risk of developing diabetes diminishes along with the decrease in the amount of liver fat. In a study of 1051 patients, in whom the prevalence of fatty liver was 18% at baseline, greater baseline liver fat levels were associated with a higher risk of incident hypertension and T2DM.6
Liver biopsy has been considered the gold standard for detecting and grading liver steatosis. However, it is an invasive procedure with considerable rate of interobserver variability in evaluating the specimens.7 El‑Badry et al8 reported poor agreement among pathologists with respect to the assessment of steatosis (intraclass correlation coefficient, 0.57), and the assessment of histologic features of steatohepatitis was inconsistent.
On the other hand, in light of the steatotic liver disease epidemic, biopsy is not the optimal approach for screening purposes in patients with MASLD, a majority of whom have simple steatosis. Furthermore, liver steatosis is a dynamic process, and its severity may change over a short period of time (months); therefore, a possibility of a noninvasive assessment is crucial.
B‑mode ultrasonography (US) allows for a subjective estimation of the degree of liver steatosis, which is usually based on a series of US findings, including liver echogenicity, hepatorenal echo contrast, as well as visualization of intrahepatic vessels and the diaphragm.9 However, in addition to a substantial interobserver variability in scoring steatosis, the performance for its detection (fat content ≥5%) is low, with reported sensitivity of 53.3% to 63.6%.10
This review describes recent advances in noninvasive quantitative assessment of the liver fat content using imaging techniques.
Magnetic resonance–based techniques
Quantification of the amount of fat in the liver can be achieved using magnetic resonance (MR)-based techniques, including proton MR spectroscopy (MRS) and MR chemical shift imaging (Figure 1). With MRS, the signal intensities from fat and water are directly measured and the proton density fat fraction (PDFF) is obtained by calculating the ratio of fat proton signal intensities to the total proton signal intensities from fat and water.11 MR chemical shift imaging consists in assessing the difference in resonance frequency between water and fat protons: during the opposed‑phase, water protons and fat protons are placed in opposite direction, whereas during the in‑phase they are placed in the same direction. MR‑PDFF is derived from calculating the difference between in‑phase and opposed‑phase signal intensities.11
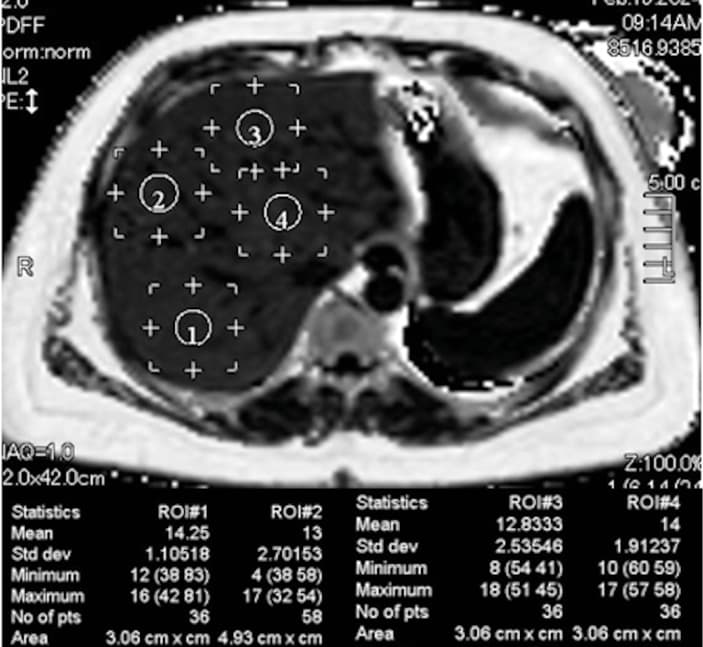
MRS‑PDFF and MR‑PDFF are highly correlated, and they have shown excellent diagnostic accuracy for detecting and grading liver steatosis.12-16 MR‑PDFF was demonstrated to be equivalent to MRS‑PDFF in quantifying changes in the liver fat content, both cross‑sectionally and longitudinally, over a period of 6 months.16 An excellent correlation between MRS‑PDFF and MR‑PDFF and histopathology‑determined liver fat content has been reported, and the 2 techniques showed a comparably high diagnostic accuracy.17
In a meta‑analysis including 1100 patients with biopsy‑proven liver steatosis, the area under the curve (AUC) for grading liver steatosis using MR‑PDFF ranged from 0.91 to 0.98.18
It must be underscored that MRS‑derived PDFF measurements are limited to a small region of interest (ROI); therefore, the quantification may be inadequate in patients with uneven fat infiltration. MR‑PDFF enables fat mapping of the entire liver, and can be implemented on any platform. Moreover, the MR‑PDFF variability is low across readers, reading centers, platforms, and scanner manufacturers.19,20
It is worth mentioning that the PDFF percentage does not correspond to the percentage of fat visually assessed on a histologic specimen. It has been reported that the measurements of triglyceride by biochemical extraction include some materials that are not visible on MR and thus do not contribute to PDFF estimation.15 Therefore, even though PDFF and histology correlate strongly, the 2 metrics are different and not interchangeable.21
According to literature reports, both MR‑based techniques are more accurate in detecting the true fat content than the histopathologic examination, which has been considered the gold standard for several decades.16,22-24 In particular, it has been shown that MR‑PDFF could detect small changes in the liver fat content that were not appreciated with histology but were of clinical or biochemical significance.16,24 Moreover, in contrast with histology,8 the MR‑based techniques are highly reproducible.19-21 Currently, both of them are widely accepted as alternative means to liver biopsy for diagnosing and quantifying liver steatosis and for monitoring changes over time in clinical trials.25 In this regard, a systematic review and meta‑analysis26 reported that a decline in MR‑PDFF by 30% or greater was associated with higher odds of histologic response, defined as a 2‑point improvement in the NAFLD activity score, with at least 1‑point improvement in lobular inflammation or hepatocyte ballooning, and resolution of steatohepatitis in MASLD patients. Moreover, it has been shown that a relative decline in MR‑PDFF by 30% or greater was associated with 1‑stage regression of fibrosis in MASLD, suggesting that this threshold of relative decline in MRI‑PDFF may be used as a therapeutic target in clinical trials.27
The Pulse‑Echo Quantitative Ultrasound Initiative Working Group of the American Institute of Ultrasound in Medicine and the Radiological Society of North America, Quantitative Imaging Biomarkers Alliance has recommended that MR‑PDFF be used as the reference standard in diagnostic studies aimed at evaluating the accuracy of the new US‑based techniques of fat quantification.28 A similar recommendation was included in a position paper endorsed by the World Federation for Ultrasound in Medicine and Biology.29
However, it must be noted that both MR‑based techniques are expensive and not widely available; therefore, they are not recommended for screening purposes.
Ultrasound‑based techniques
General information
Currently, 3 different quantitative parameters can be obtained to estimate the liver fat content using US: attenuation coefficient (AC), backscatter coefficient (BSC), and speed of sound (SoS). All of them are obtained by analyzing the US signals that return to the transducer, and before any postprocessing is applied, that is, the raw echo (radiofrequency) data are used. The metrics differ depending on the set of information analyzed. AC estimates the rate of the amplitude loss of the US beam traversing the tissue; it is directly related to the amount of fat in the liver. BSC is a measure of US energy scattered by reflectors that are smaller than or equal to the US wavelength, and that is returning to the transducer. As in the case of AC, the BSC value increases along with an increase in the liver fat content. In contrast, SoS is inversely related to the amount of liver fat. More details can be found elsewhere.29
The hepatorenal index (HRI) is a semiquantitative estimate of the liver fat content obtained by calculating the ratio of the US signals backscattered by the liver to those backscattered by the renal cortex. The kidney serves as the reference; therefore, its function must be normal for an accurate estimate. This requirement limits the applicability of HRI and may partly explain the differences in the cutoff value for detecting steatosis, ranging from 1.12 to 2.2 in published studies.30
Controlled attenuation parameter
Controlled attenuation parameter (CAP) is the algorithm available on the FibroScan system (Echosens, Paris, France) for quantification of the liver fat content. The system calculates the attenuation slope in decibels per meter (dB/m). CAP values range from 100 to 400 dB/m, and they are obtained together with the value of liver stiffness.
CAP has been available since 2010, and there are abundant literature reports on its performance and clinical value. Currently, it can be measured using 2 probe sizes, M and XL. The latter has been developed for the assessment of individuals with obesity. The FibroScan system automatically recommends the correct probe size depending on the thickness of the subcutaneous tissue. Choosing a correct probe is of utmost importance for reliable readings. It has been shown that the use of an M probe in patients with a skin‑to–liver capsule distance greater than or equal to 25 mm may overestimate the grade of liver steatosis.31
It is still unclear whether the 2 probes yield the same results. Chan et al32 demonstrated that the CAP values obtained with 2 probes were similar, whereas in another study, the CAP values obtained with the M probe were lower than those obtained using the XL probe, and this difference was not related to body mass index (BMI).33
The recent upgrade of the CAP algorithm uses the raw US data continuously acquired during the imaging phase of the examination with the FibroScan system for stiffness assessment (SmartExam), and unreliable measurements are automatically rejected.34 A preliminary study reported improved precision of the CAP measurement34; however, detailed data on the accuracy of the upgraded algorithm are still lacking.
Specific quality criteria for a reliable CAP measurement have not been defined yet, and there are conflicting results in the literature. It has been shown that the validity of CAP for the diagnosis of liver steatosis was higher when the interquartile range (IQR) of 10 acquisitions was lower than 40 dB/m.35 Another study proposed an IQR below 30 dB/m.36 A third, more recent study did not find any difference in CAP performance when these criteria were applied.37 The latter result was confirmed in a meta‑analysis that included individual data of 2346 patients assessed with an XL probe.38
One of the reasons why CAP has become a point‑of‑care technique for quantification of the liver fat content is because it does not require expertise in B‑mode imaging US. However, it must be highlighted that the threshold for detecting steatosis (grade S >0) is rather variable among published studies, ranging from 219 dB/m in a cohort of patients with chronic hepatitis C to 294 dB/m in a meta‑analysis including individuals with MASLD.38,39 It has been shown that BMI, diabetes, and etiology of liver disease may have a significant and relevant impact on CAP values.40 Therefore, it has been proposed to add 10 dB/m to the optimal cutoffs in the case of MASLD / metabolic dysfunction–associated steatohepatitis (MASH) or T2DM, and to adapt the values also to BMI. However, differences in the threshold for steatosis detection might be also partly due to a spectrum effect, that is, different pretest probability of having steatosis in the diverse study cohorts. A recent meta‑analysis has shown that CAP performs suboptimally for grading liver steatosis in patients with MASLD (AUC = 0.74 for S >1 and AUC = 0.71 for S >2).38
As observed in adults, the CAP threshold for detecting steatosis ranges from 225 dB/m in an unselected pediatric population41 to 277 dB/m in a series of children with severe obesity.42
The FibroScan–aspartate aminotransferase (FAST) score is an algorithm designed to identify patients with MASH, significant liver fibrosis, and elevated NAFLD activity score from among individuals with suspected MASLD. It has been developed in a derivation cohort of 350 patients and validated in 7 independent international biopsy‑proven cohorts.43 It combines measurements of liver stiffness, CAP, and aspartate aminotransferase levels. Thresholds for excluding and confirming the risk of progressive MASH were 0.35 and 0.67, respectively. The discriminatory value of the FAST score for fibrotic MASH has been verified in 2 independent studies with acceptable results.44,45
When CAP is used to evaluate changes in liver steatosis over time, it must be considered that the change should be greater than the mean difference observed in the studies performed to assess the intra- and interobserver variability in CAP measurements, that is, 20 dB/m.46 A recent small study involving a series of MASLD patients reported that a ΔCAP cutoff of −46 dB/m predicted a decline in the baseline MR‑PDFF value by 30% or greater with sensitivity of 53.8%, specificity of 90.3%, and an AUC of 0.81.47
In advanced fibrosis or cirrhosis, steatosis may disappear; this condition is known as burnt‑out MASH.48 Indeed, the leading cause of what was once defined as cryptogenic cirrhosis is MASLD.49 A study performed in a cohort of patients with histologically proven MASLD reported that the incidence of liver‑related events was greater in individuals with high liver stiffness value (≥8.7 kPa) and low CAP values (<295 dB/m) than in those with both high stiffness value and high CAP values (P <0.03).50
Quantification of liver fat with B‑mode imaging ultrasound systems
Tools for measuring liver fat using conventional B‑mode imaging US systems allow for visualizing the area to be sampled while avoiding artifacts. Moreover, the same US system can be used for a morphologic evaluation of the liver with B‑mode imaging, assessing the portal hemodynamics with Doppler flowmetry, assessing liver stiffness with shear wave elastography, and for characterizing focal liver lesions (if any) with contrast‑enhanced US.
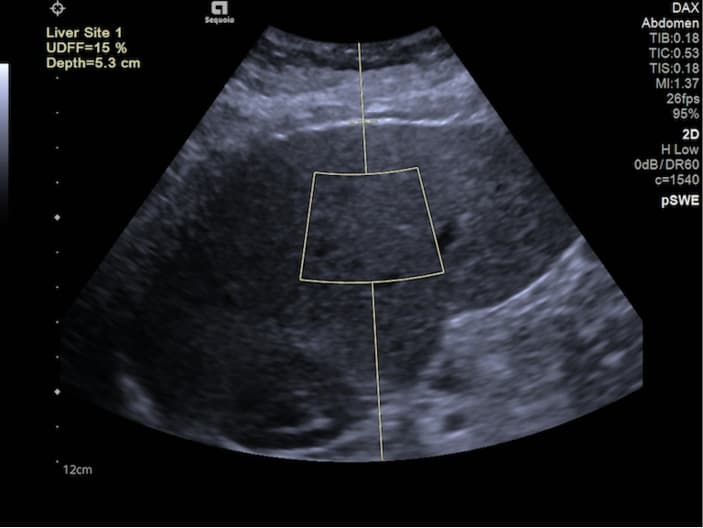
Most of the commercially available algorithms implemented on US imaging systems are based on AC estimation (Figure 2). AC is calculated within a ROI that is either fixed‑size or user‑adjustable. The field of view is color‑coded in most US systems, allowing an operator to visualize artifacts that should not be included in the ROI. They usually appear in the near field (due to reverberation) or in the far field (due to low signal‑to‑noise ratios). Most US systems automatically identify artifacts, such as blood vessels, and do not include them in the AC estimate. The software on the US system calculates the AC in decibel/centimeter/megahertz (dB/cm/MHz).
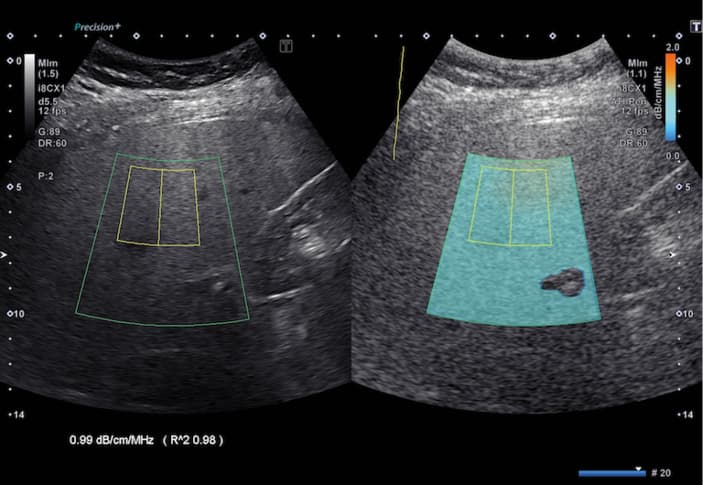
Through combining AC with BSC, one of US system manufacturers has obtained a parameter that yields the results in percentage (Figure 3). Of note, this percentage does not correspond to the percentage of liver fat derived from histology. Rather, it is a quantitative estimate that is highly correlated (in an almost linear manner) with MR‑PDFF.51 Recently, a different manufacturer has developed an algorithm that combines AC with a parameter related to BSC, also giving results in percentage.52 It is expected that other manufacturers will follow this approach. In fact, percentage is a more practical and intuitive expression of the liver fat content.
Performance of these new tools has been evaluated using either histology or MR‑based techniques as reference standards. A majority of the published studies used AC algorithms. It has been shown that these algorithms are accurate in detecting and grading liver steatosis, with an AUC above 0.8 for S >0 in most reports.53-63 Studies that have compared the AC algorithms with CAP, using liver biopsy or MR‑PDFF as the reference, demonstrated that the performance of AC is comparable with or better than that of CAP.53,55,56,60 In particular, a study including 114 consecutive adults potentially at a risk of steatosis and 15 healthy controls found that the correlation of AC (ATI, Canon Medical Systems, Otawara, Tochigi, Japan) with MR‑PDFF was higher (r = 0.81) than that of CAP (r = 0.65), and the AUCs of AC and CAP, respectively, were 0.91 and 0.85 for detecting S >0 (MRI‑PDFF ≥5%) and 0.95 and 0.88 for detecting S >1 (MRI‑PDFF ≥16.3%).56 A performance higher than that of CAP for grading steatosis was also reported for an AC algorithm developed by another manufacturer (UGAP, GE HealthCare, Chicago, Illinois, United States).60
A recent meta‑analysis,64 which included studies performed using AC algorithms developed by different manufacturers in 1509 patients, has reported that the pooled sensitivity and specificity of AC were 76% and 84%, respectively, for detecting S ≥1, and 87% and 79%, respectively, for detecting S ≥2.64
However, it must be noted that the AC cutoff values for detecting and grading liver steatosis vary between studies, even when an algorithm developed by the same manufacturer is used.28,29 These differences might be due to a lack of a standardized protocol for performing the AC measurement. Indeed, it has been shown that the AC value depends on the depth of measurement, with a progressive decrease in the AC values with depth.65 This effect has been observed for different AC algorithms, and may account for the differences in the AC cutoff values observed in the published studies. Moreover, the ROI size also affects the AC value, with higher AC values reported for a 1‑cm ROI, as compared with a 3‑cm ROI.65 On the other hand, the highest repeatability of AC measurement was observed when the upper edge of the ROI was positioned 2 cm below the liver capsule, avoiding reverberation artifacts, and using an ROI size of 3 cm.66
A few studies carried out in small cohorts assessed the performance of an algorithm that combines AC with BSC, known as US‑derived fat fraction (UDFF). In a study enrolling 56 overweight and obese adolescents and adults, UDFF was positively associated with MR‑PDFF (ρ = 0.82) and the mean bias between UDFF and MR‑PDFF was 4%.67 UDFF greater than 5% had sensitivity of 94.1% and specificity of 63.6% for diagnosing MR‑PDFF above 5.5%, with an AUC of 0.9. UDFF can also be measured using a deep abdominal transducer, which has been specifically designed for evaluation of patients with obesity.
A recent study performed in a large series of patients with chronic liver disease has shown that a combination of multiple parameters, namely integrated BSC, signal‑to‑noise ratio, and US‑guided attenuation parameter (UGAP), had an accuracy higher than that of UGAP alone (AUC = 0.96 vs AUC = 0.92) for assessing hepatic steatosis.62
Using histology as the reference standard, it has been reported that the AC values are not affected by liver fibrosis.68-70
Some studies have evaluated the performance of BSC, reporting good results71-73; however, this parameter is not commercially available alone.
The literature data regarding SoS estimate for fat quantification are scarce.74,75 Several factors may affect the accuracy and precision of SoS measurement; some of them are within the operator’s control, whereas others are patient‑related (eg, BMI and abdominal circumference).76 Moreover, all grades of liver steatosis are comprised within a narrow SoS range; therefore, high accuracy and precision of the technique are needed to detect changes in the liver fat content.
Conclusions
Early diagnosis of liver steatosis is critical, as patients with MASLD are at an increased risk of cardiovascular diseases, T2DM, and all‑cause mortality, as compared with the general population. Moreover, MASLD may progress to MASH, which can lead to severe fibrosis, liver‑related events, and an increased risk of hepatocellular carcinoma.
Currently, several noninvasive techniques are available for quantification of liver steatosis. MR‑based techniques are the most accurate, and are used as valid substitutes of liver biopsy for diagnosing and grading liver steatosis, and for monitoring changes over time in clinical trials. Indeed, they can appreciate even small changes in the liver fat content. The accepted therapeutic target in clinical trials is a decline in PDFF values by 30% or greater. It must be highlighted that the MR‑based techniques are highly expensive, and their availability is limited. Therefore, they are not indicated for an everyday diagnostic workup of patients with chronic liver disease.
CAP, which is a nonimaging US–based algorithm performed with a standalone system, has been available for more than a decade, and has become a point‑of‑care technique. CAP thresholds for detecting and grading the liver fat content are highly variable between studies, and depend on the etiology of liver disease. The highest thresholds have been obtained in cohorts of patients with MASLD.
The algorithms commercially available on B‑mode imaging US systems have been developed in the last few years. Their performance is similar to or better than that of CAP; however, fewer studies evaluating their accuracy have been published to date. A standardized protocol for acquiring the measurements is needed to mitigate the differences in liver fat content estimates observed across published studies.
Further research is warranted to assess for the presence of confounding factors in quantification of the liver fat content using US‑derived metrics.
- Riazi K, Azhari H, Charette JH, et al. The prevalence and incidence of NAFLD worldwide: a systematic review and meta‑analysis. Lancet Gastroenterol Hepatol. 2022; 7: 851‑861. | Crossref
- Rinella ME. Nonalcoholic fatty liver disease: a systematic review. JAMA. 2015; 313: 2263‑2273. | Crossref
- Rinella ME, Neuschwander‑Tetri BA, Siddiqui MS, et al. AASLD Practice Guidance on the clinical assessment and management of nonalcoholic fatty liver disease. Hepatology. 2023; 77: 1797‑1835. | Crossref
- Simon TG, Roelstraete B, Khalili H, et al. Mortality in biopsy‑confirmed nonalcoholic fatty liver disease: results from a nationwide cohort. Gut. 2021; 70: 1375‑1382. | Crossref
- Nasr P, Fredrikson M, Ekstedt M, Kechagias S. The amount of liver fat predicts mortality and development of type 2 diabetes in non‑alcoholic fatty liver disease. Liver Int. 2020; 40: 1069‑1078. | Crossref
ARTICLE INFORMATION