
Thrombin generation, fibrin clot permeation and lysis in patients with severe mitral regurgitation undergoing transcatheter edge-to-edge mitral valve repair: Mitral Fibrin Study
Key words: blood clot, fibrin, mitral valve, thrombin generation, transcatheter edge-to-edge repair

 CC BY 4.0
Thrombin generation, fibrin clot permeation and lysis in patients with severe mitral regurgitation undergoing transcatheter edge-to-edge mitral valve repair: Mitral Fibrin Study
CC BY 4.0
Introduction: Intricate management of heart failure (HF), especially in the context of reduced ejection fraction, is further complicated by an elevated risk of thromboembolic events. Studies published so far offer inconclusive insight into the interplay between mitral regurgitation (MR) and the coagulation system.
Objectives: This study aimed to investigate the impact of transcatheter edge‑to‑edge repair (TEER) on specific coagulation parameters in HF patients.
Patients and methods: A cohort of 31 HF patients with severe MR treated with TEER underwent a systematic evaluation at 3 visits (V1, V2, and V3). Coagulation parameters, including fibrinogen concentration, thrombin generation, fibrin clot permeability, and clot lysis time (CLT) were assessed (n = 27 at V2; n = 25 at V3).
Results: TEER induced changes in fibrinogen levels (P = 0.01; V3 vs V2) and improved fibrin clot properties over 50‑day follow‑up (P = 0.01; V3 vs V2). No significant differences were observed between time points in the analyzed blood clot parameters. Correlation analysis showed that baseline CLT was associated with ΔN‑terminal pro–B‑type natriuretic peptide (NT‑proBNP) level (P = 0.049; r = 0.4). Multivariable analysis identified baseline CLT as an independent predictor of early post‑TEER NT‑proBNP change (R2 = 0.55; P = 0.02).
Conclusions: We found decreased level of fibrinogen and increased permeation coefficient over a median 50 (interquartile range, 32.5–75.5)-day post‑TEER follow‑up, as compared with early postprocedural assessments. Other blood coagulation parameters remained unchanged from baseline at both follow‑up time points after TEER. Finally, CLT was an independent predictor of early NT‑proBNP increase, emphasizing its role as an indicator of hemodynamic response to TEER.
What's new?
This study represents the first investigation into thrombin generation and fibrin clot properties within the context of mitral transcatheter edge‑to‑edge repair (TEER) in patients with heart failure. Our results indicate a marked reduction in fibrinogen levels coupled with an improvement in clot permeability over a median follow‑up of 50 (interquartile range, 32.5–75.5) days post‑TEER. No substantial differences were observed in coagulation parameters before and after mitral TEER. Duration of clot lysis stands out as a significant independent predictor of early post‑TEER N‑terminal pro–B‑type natriuretic peptide levels, underlining its utility in predicting the hemodynamic outcome of mitral TEER.
Introduction
Managing heart failure (HF) patients is complicated by their heightened susceptibility to thromboembolic events. The interplay between mitral regurgitation (MR) and prothrombotic state in HF has become a focal point. Complex relationships between MR, altered blood flow patterns, and their impact on coagulation pathways necessitate comprehensive investigation. In HF with reduced ejection fraction (HFrEF) and secondary MR, ventricular dilatation and altered valve geometry are common.1-5 Structural changes in the mitral valve, marked by leaflet restriction and annular dilatation, result in secondary MR.1-5
Data regarding MR influence on thromboembolic risk are contradictory.6-10 Several studies have indicated that significant MR jets, likely attributed to extensive blood flow around the left atrium (LA) and its appendage, may contribute to a reduction in thromboembolic events, including stroke.6,11-13 The same effect was demonstrated for a decrease in D‑dimer concentration and clot formation, potentially reducing thrombus formation, especially cerebrovascular emboli.6,11
However, concerns arise regarding turbulent nature of the regurgitant flow, possibly contributing to coagulation activation.7,10 Shear forces from turbulent blood flow may activate the coagulation cascade, enhancing the prothrombotic clot phenotype.7,10 MR may, on the one hand, be associated with a protective effect due to blood mobilization from the LA via the regurgitant jet. On the other hand, increased turbulent flow from the regurgitant jet may generate shear stress and enhance prothrombotic properties of blood in the LA. This clinical scenario, regarding the assessment of fibrin clot properties and thrombin generation, has not been explored before.
Mitral valve transcatheter edge‑to‑edge repair (TEER) is an evolving intervention for severe MR, especially in the cases unresponsive to optimal HF therapy, meeting anatomical criteria. In light of positive outcomes of the COAPT trial (Cardiovascular Outcomes Assessment of the MitraClip Percutaneous Therapy for Heart Failure Patients with Functional Mitral Regurgitation), TEER is recommended in symptomatic severe MR patients.13-15 The procedure’s impact on the LA hemodynamics suggests its potential influence on the coagulation system and, consequently, systemic embolic risk.14,16 Interestingly, surgical intervention, that is, mitral valve replacement was shown to have high early thrombotic risk, but is also associated with vitamin K antagonist implementation shortly after surgery.17,18
This study sought to demonstrate that treating severe MR with TEER would lead to reduced thrombin generation, elevated fibrin clot permeation coefficient (Ks), and increased susceptibility to lysis in HF patients. Our primary aim was to assess if MR reduction following TEER influenced specific clot phenotype characteristics in patients with HF, which was not previously investigated.
Patients and methods
Study design
This prospective study adhered to the principles of the Declaration of Helsinki and was conducted at the Institute of Cardiology, Jagiellonian University Medical College, in the Department of Coronary Artery Disease and Heart Failure and the Department of Interventional Cardiology at St. John Paul II Hospital in Kraków, Poland. The Jagiellonian University Bioethical Committee approved the final protocol (1072.6120.10.2022). Written informed consent was obtained from all patients before enrollment.
The study aimed to assess the impact of the mitral valve TEER on blood coagulation parameters, specifically thrombin generation, Ks, and clot lysis time (CLT). Blood samples were analyzed at 3 time points: visit 1 (V1) 1–2 days before the TEER procedure, V2 1–2 days after the procedure, and V3 6–8 weeks after the procedure. Flowchart of the study is presented in Figure 1.
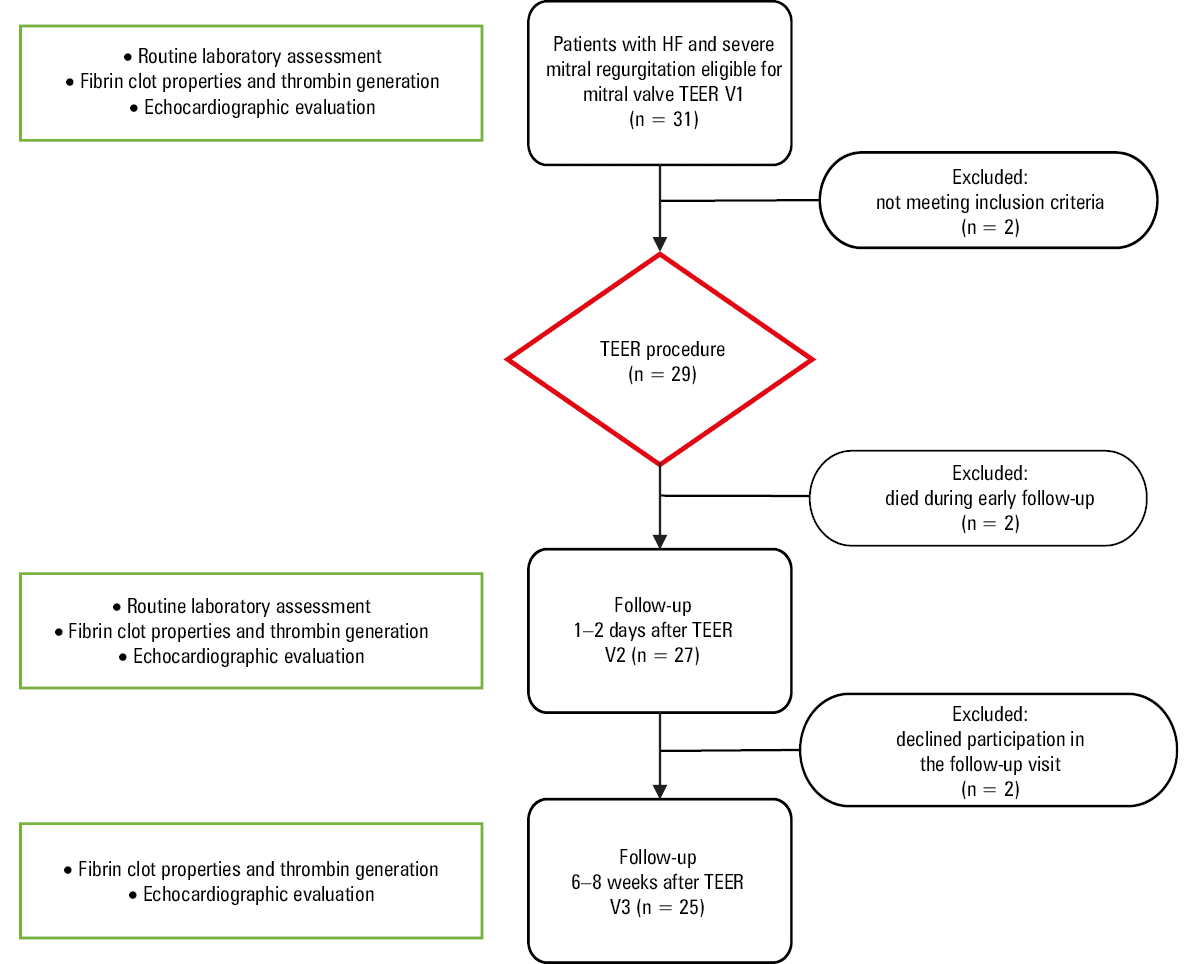
Abbreviations: HF, heart failure; TEER, transcatheter edge‑to‑edge repair; V, visit
Patients
A total of 31 patients were initially included in the study. The inclusion criteria comprised age of at least 18 years, symptomatic HF and established diagnosis of HF, severe MR, feasibility for TEER, and Heart Team qualification for the procedure. Exclusion criteria included the use of vitamin K antagonists, as well as heparin or bivalirudin administration less than 24 hours prior to blood sampling, active bleeding, known coagulation system pathologies, platelet count (PLT) below or equal to 100 × 109/l, diagnosed significant liver (1.5 times above upper reference limit of alanine or aspartate transaminase) or renal failure (estimated glomerular filtration rate [eGFR] <30 ml/min/1.72 m2), chronic treatment with nonsteroidal anti‑inflammatory drugs (excluding low‑dose aspirin), and systemic steroid therapy.
After obtaining informed consent, 2 patients were found to have contraindications (elevated inflammatory markers or signs of infection) for TEER. Subsequently, TEER was postponed for these individuals, leading to their exclusion from the study. For these patients, only blood samples collected before the scheduled procedure were preserved. Moreover, 2 patients died shortly after admission to the Intensive Cardiac Unit, and other 2 did not present at the follow‑up visit. Finally, out of the initially enrolled 31 patients, 27 completed V2 after the procedure, and 25 patients were evaluated over entire follow‑up (V3).
Type 2 diabetes was diagnosed according to the European Society of Cardiology guidelines on management of cardiovascular disease in patients with diabetes.19 Obesity was characterized in accordance with the criteria set forth by the World Health Organization (body mass index ≥30 kg/m2). Hypertension was delineated as systolic blood pressure equal to or above 140 mm Hg or diastolic blood pressure equal to or above 90 mm Hg, or the use of any antihypertensive medications.
Sample collection and routine laboratory tests
A fasting blood sample of 25 ml was collected from the antecubital vein and promptly preserved in tubes containing 3.2% trisodium citrate. Sample processing occurred within a 60‑minute window following blood collection. Serum levels of total cholesterol, low‑density lipoprotein cholesterol, high‑density lipoprotein cholesterol, triglycerides, glucose, and glycated hemoglobin were quantified using the Cobas 6000 biochemical analyzer (Roche, Mannheim, Germany). High‑sensitivity C‑reactive protein (hs‑CRP) was measured using latex nephelometry (Dade Behring, Marburg, Germany). N‑terminal pro–B‑type natriuretic peptide (NT‑proBNP) levels were assessed with an electrochemiluminescence immunoassay (Roche Diagnostics, Mannheim, Germany). Creatinine levels were determined using a routine laboratory technique, and eGFR was calculated based on the chronic kidney disease epidemiology collaboration formula. Complete blood count, encompassing red blood cell count (RBC), white blood cell count, hemoglobin (Hb), hematocrit, red blood cell and platelet distribution width, and PLT, was performed with a hematology analyzer (Sysmex XT2000i, Sysmex, Japan).
Laboratory investigation of coagulation parameters
Venous blood was collected from the antecubital vein between 7:00 AM and 9:00 AM using citrated tubes (9:1 ratio of 0.106 M sodium citrate; Monovette, Sarstedt, Nümbrecht, Germany). The collected blood was centrifuged at 2500 g and 20 °C for 20 minutes, yielding platelet‑poor plasma. The plasma was promptly snap‑frozen within 30 minutes of collection and stored in aliquots at –80 °C until further analysis. For individuals receiving direct oral anticoagulants (DOACs) from whom blood was collected within the preceding 24 hours, citrated plasma was treated with DOAC‑Stop (Haematex Research, Sydney, Australia) prior to assessment.20
Fibrin permeation analysis
Fibrin clot permeation was determined using a pressure‑driven system as described previously.20 Briefly, 20 mM calcium chloride and 1 U/ml human thrombin (Merck KGaA, Darmstadt, Germany) were added to 120 µl of citrated plasma. After 2 hours of incubation in a wet chamber, the tubes containing the clots were connected via plastic tubing to a buffer reservoir (0.01 M Tris, 0.1 M NaCl, pH 7.5), and its volume flowing through the gels was measured within 60 minutes. Ks, which indicates the pore size, was calculated from the following equation: Ks = Q × L × η/t × A × Δp, where Q is the flow rate in time (t); L is the length of a fibrin gel; η represents the liquid viscosity; A is the cross‑sectional area, and Δp stands for differential pressure.
Plasma clot lysis assay
The fibrinolysis capacity was assessed utilizing a CLT assay recommended by the International Society on Thrombosis and Haemostasis subcommittee, as detailed previously.21 In brief, citrated plasma was combined with 15 mM calcium chloride, 0.5 U/ml human thrombin (Merck), 15 µM phospholipid vesicles (Rossix, Mölndal, Sweden), and 18 ng/ml recombinant tissue plasminogen activator (Boehringer Ingelheim, Ingelheim am Rhein, Germany). Then, the mixture was transferred to a microtiter plate, and its turbidity was measured at 405 nm at 37 °C. The CLT was defined as the duration from the midpoint of the clear‑to‑maximum‑turbid transition, denoting the clot formation, to the midpoint of the maximum‑turbid‑to‑clear transition, signifying the clot lysis.
Endogenous thrombin potential
Thrombin generation kinetics was assessed using the calibrated automated thrombogram (Thrombinoscope BV, Maastricht, the Netherlands) following the manufacturer’s instructions. The measurements were conducted in a 96‑well plate fluorometer (Ascent Reader, Thermolabsystems OY, Helsinki, Finland) equipped with a 390/460 nm filter set at 37 °C. In short, 80 µl of platelet‑poor plasma were diluted with 20 µl of a reagent containing 5 pM recombinant tissue factor, 4 µM phosphatidylserine / phosphatidylcholine / phosphatidylethanolamine vesicles, and 20 µl of FluCa solution (HEPES, pH 7.35, 100 nM CaCl2, 60 mg/ml bovine albumin, and 2.5 mM Z‑Gly‑Gly‑Arg‑7‑amino‑4‑methylcoumarin).
The peak thrombin represents the maximum concentration of thrombin formed during the recording time, while the area under the curve corresponds to the endogenous thrombin potential (ETP). Lag time delineates the initiation phase of coagulation, and time to peak signifies the propagation phase of thrombin generation. Each plasma sample underwent a duplicate analysis, and the intra‑assay variability was determined to be 8%.
Statistical analysis
Continuous variables were presented as mean and SD or median (interquartile range [IQR]) for normally and not normally distributed variables, respectively, while categorical variables were expressed as numbers and percentage. The normality of distributions was assessed using the Shapiro–Wilk test. All variables available at each timepoint (before TEER, 1–2 days after, and 50 days after TEER) were compared using the repeated measures analysis of variance (RM ANOVA) or the Friedman test with appropriate paired post hoc test, namely the Tukey honestly significant difference test or the Dunn test. For variables available at only 2 time points, the paired t test or the Wilcoxon signed‑rank test was used. The Greenhouse–Geisser correction was employed in the case of unequal variances in the RM ANOVA (for full records in the analyzed variables; n = 25).
Changes between the time points were calculated for each patient and presented in a plot. The Pearson or Spearman rank correlation coefficient was calculated for associations between continuous variables with normal or non‑normal distribution, respectively. Univariable linear regression analyses demonstrated relationships between clinical variables (eg, MR volume or hs‑CRP) and blood coagulation variables. Sample size was calculated for a 90% power of detecting 15% differences (increase in mean Ks from 3.5 × 10⁻⁹ cm2 to 4.025 × 10⁻⁹ cm2, with SD of 0.75 × 10⁻⁹ cm2) in fibrin clot properties between time points (V1 and V3), at a 2‑sided level of significance of 0.05, consistent with prior research.22-24 To achieve that level of statistical power, each group should have at least 23 patients. Statistical analysis was performed using GraphPad Prism software version 8.0.1 (San Diego, California, United States) and IBM SPSS package version 28.0 (Armonk, New York, United States).
Results
Group characteristics
Baseline demographic and clinical characteristics of the analyzed group are shown in Table 1. The study recruited 31 patients, including 19 men and 12 women (mean [SD] age, 71.8 [8.32] years) with established HF, optimally treated, on maximally tolerated dose of guideline‑directed medical therapy, with severe MR, who were eligible for mitral TEER procedure. As suspected, most of the patients (n = 20; 64.5%) presented HFrEF, and the other (n = 8; 25.8%) had HF with preserved EF (HFpEF). Finally, the least numerous group included patients (n = 3; 9.7%) with HF with mildly reduced EF (HFmrEF). Follow‑up (V3) took place at a median (IQR) time of 50 (32.5–75.5) days after TEER. Periprocedural details, including the number and type of clips implanted, severity of MR, New York Heart Association class, and complications after TEER are available in Supplementary material, Table S1.
Variable | Baseline clinical characteristics (n = 31) | ||||
Data are shown as number (percentage) or median and interquartile range unless stated otherwise.
a Tests were conducted solely upon hospital admission, as the anticipated time gap between measurements and the suggested frequency for assessing these parameters lacks clinical significance.
SI conversion factors: to convert hemoglobin and MCHC to g/l, multiply by 10, and NT‑proBNP to ng/l, by 1.
Abbreviations: ACEI, angiotensin‑converting enzyme inhibitor; ARB, angiotensin receptor blocker; ARNI, angiotensin receptor / neprilysin inhibitor; ASA, acetylsalicylic acid; DAPT, dual antiplatelet therapy; DOAC, direct oral anticoagulant; eGFR, estimated glomerular filtration rate; HbA1c, glycated hemoglobin; HCT, hematocrit; HDL‑C, high‑density lipoprotein cholesterol; hs‑CRP, high‑sensitivity C‑reactive protein; LDL‑C, low‑density lipoprotein cholesterol; MCH, mean corpuscular hemoglobin; MCHC, mean corpuscular hemoglobin concentration; MCV, mean corpuscular volume; MPV, mean platelet volume; MR, mitral regurgitation; MRA, mineralocorticoid receptor antagonist; NT‑proBNP, N‑terminal pro–B‑type natriuretic peptide; NYHA, New York Heart Association; PCT, plateletcrit; PDW, platelet distribution width; PLT, platelet count; RBC, red blood cell count; RDW, red cell distribution width; SGLT2i, sodium‑glucose cotransporter 2 inhibitor; TAT, triple antithrombotic therapy; TC, total cholesterol; TG, triglycerides; WBC, white blood count; others, see Figure 1 | |||||
MR etiology | Secondary | 26 (84) | |||
Primary | 5 (16) | ||||
Hypertension | 25 (81) | ||||
Hypercholesterolemia | 28 (90) | ||||
Type 2 diabetes | 16 (52) | ||||
Obesity | 7 (22.5) | ||||
Coronary artery disease | 16 (52) | ||||
Atrial fibrillation | 22 (71) | ||||
Chronic kidney disease | 18 (58) | ||||
NYHA class | I | 0 | |||
II | 8 (26) | ||||
III | 20 (64.5) | ||||
IV | 3 (9.5) | ||||
Laboratory evaluation (n = 27 pairs) | Baseline (n = 31) | 1–2 days after TEER (n = 27) | P value | ||
Creatinine, µmol/l | 106 (92.5–123) | 93 (78.5–114) | 0.003 | ||
eGFR, ml/min/1.73 m2 | 56 (39–73) | 61 (42.3–80.8) | 0.02 | ||
Glucose, mmol/l | 5.5 (4.85–6.2) | 5 (4.8–5.6) | 0.95 | ||
HbA1c, %a | 6.10 (5.8–6.8) | – | – | ||
LDL‑C, mmol/la | 1.64 (1.29–2.31) | – | – | ||
HDL‑C, mmol/la | 1.05 (0.92–1.25) | – | – | ||
TC, mmol/la | 3.32 (2.46–4.04) | – | – | ||
Non‑HDL, mmol/la | 1.97 (1.55–2.81) | – | – | ||
TG, mmol/la | 1.11 (0.88–1.39) | – | – | ||
Hs‑CRP, mg/l | 3.22 (1.53–6.45) | 15.6 (12.4–46.7) | <0.001 | ||
NT‑proBNP, pg/ml | 3535 (1191–6346) | 3635 (1518–6047) | 0.46 | ||
WBC, 103/µl | 6.67 (5.83–7.46) | 6.64 (5.83–8.42) | 0.79 | ||
RBC, 106/µl, mean (SD) | 4.36 (0.57) | 4.11 (0.47) | 0.002 | ||
Hb, g/dl, mean (SD) | 13.1 (1.92) | 12.3 (1.62) | 0.002 | ||
HCT, %, mean (SD) | 39 (5.33) | 36.9 (4.39) | 0.01 | ||
MCV, fl | 89.1 (86.2–91.8) | 89.4 (86.2–95.5) | 0.1 | ||
MCH, pg, mean (SD) | 30 (2.8) | 29.9 (2.63) | 0.34 | ||
MCHC, g/dl, mean (SD) | 33.4 (1.44) | 33.2 (1.24) | 0.1 | ||
RDW, % | 15 (13.3–16.6) | 15.2 (13.8–17) | 0.61 | ||
PLT, 103/µl, mean (SD) | 191 (75.1) | 170 (71) | <0.001 | ||
PDW, fl, mean (SD) | 14.7 (2.27) | 14.5 (2.73) | 0.63 | ||
MPV, fl, mean (SD) | 11.6 (0.95) | 11.6 (0.97) | 0.71 | ||
PCT, % | 0.21 (0.17–0.27) | 0.18 (0.13–0.24) | <0.001 | ||
Baseline pharmacotherapy (n = 31) | |||||
ASA | 7 (22.6) | ||||
Clopidogrel | 6 (19.4) | ||||
Ticagrelor | 0 | ||||
Prasugrel | 0 | ||||
DAPT | 2 (6.5) | ||||
TAT | 0 | ||||
DOAC | 23 (74.2) | ||||
Statins | 25 (80.6) | ||||
ACEI/ARB/ARNI | 24 (77.4) | ||||
MRA | 23 (74.2) | ||||
SGLT2i | 15 (48.4) | ||||
β-Blocker | 28 (90.3) | ||||
Laboratory evaluation
As shown in Table 1, patients shortly after TEER (1–2 days) had significantly decreased creatinine level (by 12.3%). As suspected for such procedures, most red blood cell morphologic parameters were reduced (RBC by 5.73%, Hb level by 6.1%, and hematocrit by 5.38%). Interestingly, we observed a significant drop in both analyzed platelet parameters, that is, PLT (11%) and plateletcrit (PCT) (14.29%). Moreover, hs‑CRP levels were substantially higher 1–2 days after TEER (4.8‑fold increase; Table 1). Group characteristics during follow‑up (n = 25) are available in Supplementary material, Table S2.
Echocardiographic assessment
A detailed description of baseline echocardiographic measurements can be found in Table 2. Briefly, we found that fibrinogen, ETP, CLT and Ks were significantly associated with baseline echocardiographic variables, such as left ventricular end‑diastolic diameter (LVEDd), left ventricular end‑systolic diameter (LVESd), left ventricular end‑diastolic volume (LVEDV) or EF (Supplementary material, Table S3).
Variable | Time point (n = 25 pairs) | P value | |
Baseline (n = 31) | 50 days after TEER (n = 25) | ||
Data are provided as mean (SD) or median (interquartile range).
a Due to limitations of the method itself including multiple small MR jets after TEER, it is not possible to perform an accurate (volumetric) MR assessment using transesophageal or transthoracic echocardiography. All patients had substantial reduction of MR volume from severe to mild or (rarely) moderate.
Abbreviations: EF, ejection fraction; LAd, left atrial diameter; LAVI, left atrial volume index; LVEDd, left ventricular end‑diastolic diameter; LVEDV, left ventricular end‑diastolic volume; LVESd, left ventricular end‑systolic diameter; LVEDV, left ventricular end‑diastolic volume; LVESV, left ventricular end‑systolic volume; others, see Figure 1 and Table 1 | |||
LVEDd, mm | 62.8 (10.6) | 65.6 (9.9) | 0.46 |
LVESd, mm | 49.6 (16) | 54 (13.4) | 0.08 |
LVEDV, ml | 209 (90.2) | 210 (71.4) | 0.24 |
LVEDSV, ml | 133 (72.2) | 140 (67.9) | 0.59 |
EF, % | 39.2 (15.9) | 35.4 (16.3) | 0.57 |
LAd (PLAX), mm | 55.5 (7.56) | 55.5 (8.06) | 0.37 |
LA area, cm2 | 36 (30–44) | 39 (29.9–46.8) | 0.92 |
LAVI, ml/m2 | 75 (70–102) | 97 (67.8–112) | 0.23 |
MR volume, ml | 46.2 (14.1) | a | a |
Blood coagulation parameters
The only coagulation parameters that differed between the 3 time points were fibrinogen concentration and Ks (Table 3). In post hoc comparison, we found that fibrinogen level declined significantly between V2 and V3 (1–2 days after TEER vs the median of 50 days after TEER) (Figure 2). Similarly, we observed that Ks rose significantly between these 2 visits. The analysis of the other coagulation variables between V1 and V3 has not demonstrated any significant differences (Table 3 and Figure 2).
Variable | Before TEER (n = 31) | 1–2 days after TEER (n = 27) | 50 days after TEER (n = 25) | P value |
Data are shown as mean (SD) or median and interquartile range. The P values show the statistical significance demonstrated by the repeated measures analysis of variance / the Friedman test between the 3 analyzed time points (for full records in 3 analyzed time points; n = 25).
| ||||
Fibrinogen, g/l | 3.3 (0.72) | 3.55 (0.55) | 3.2 (0.62) | 0.009 |
Lag time, min | 2.89 (2.08–3.75) | 3.22 (2.42–4.22) | 3 (2–3.84) | 0.38 |
ETP, nM/min | 1609 (409) | 1706 (500) | 1650 (372) | 0.46 |
Peak, nM | 286 (90.7) | 292 (127) | 311 (103) | 0.77 |
Time to peak, min | 5.92 (1.72) | 6.51 (2.32) | 5.8 (1.87) | 0.29 |
Ks, 10–9 cm2 | 3.58 (2.88–5.13) | 3.31 (2.44–4.44) | 4.35 (3.51–6.47) | 0.02 |
CLT, min | 128 (103–183) | 128 (102–143) | 133 (107–161) | 0.06 |
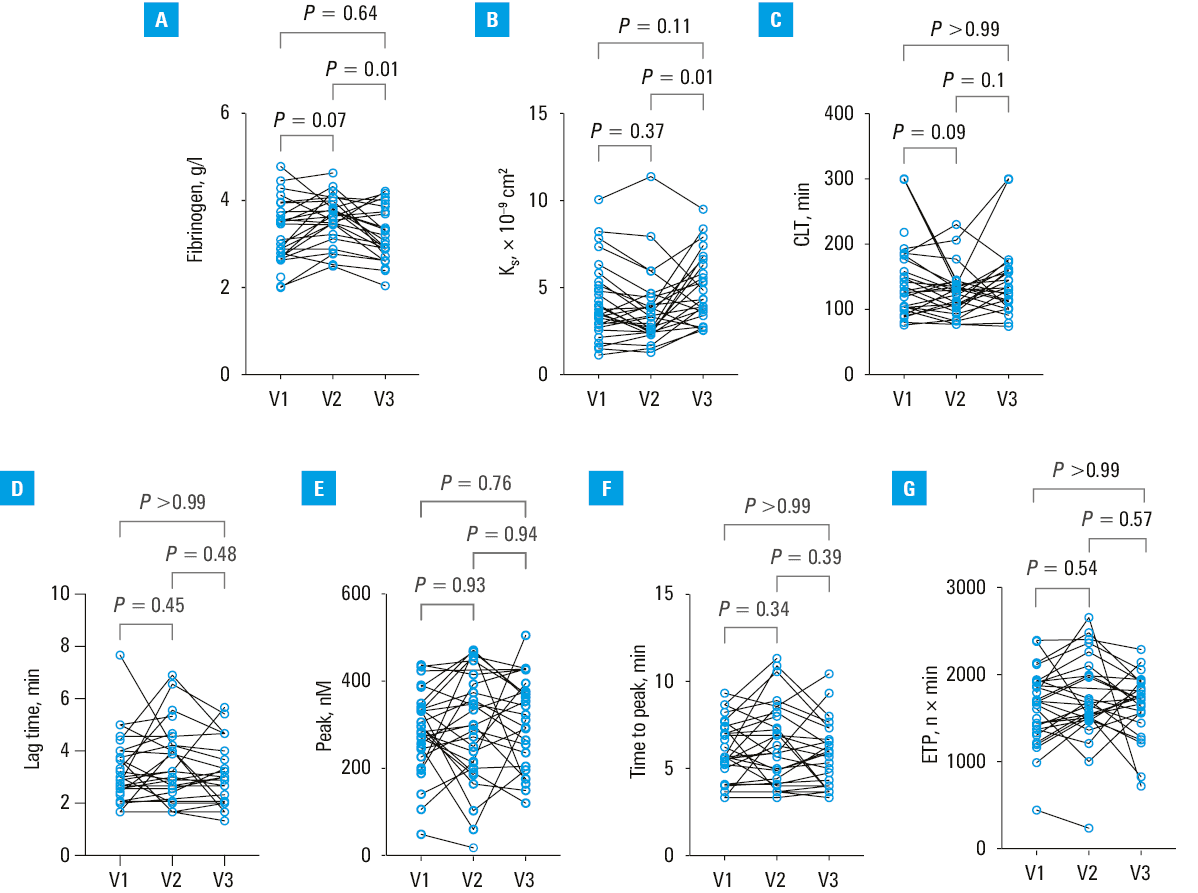
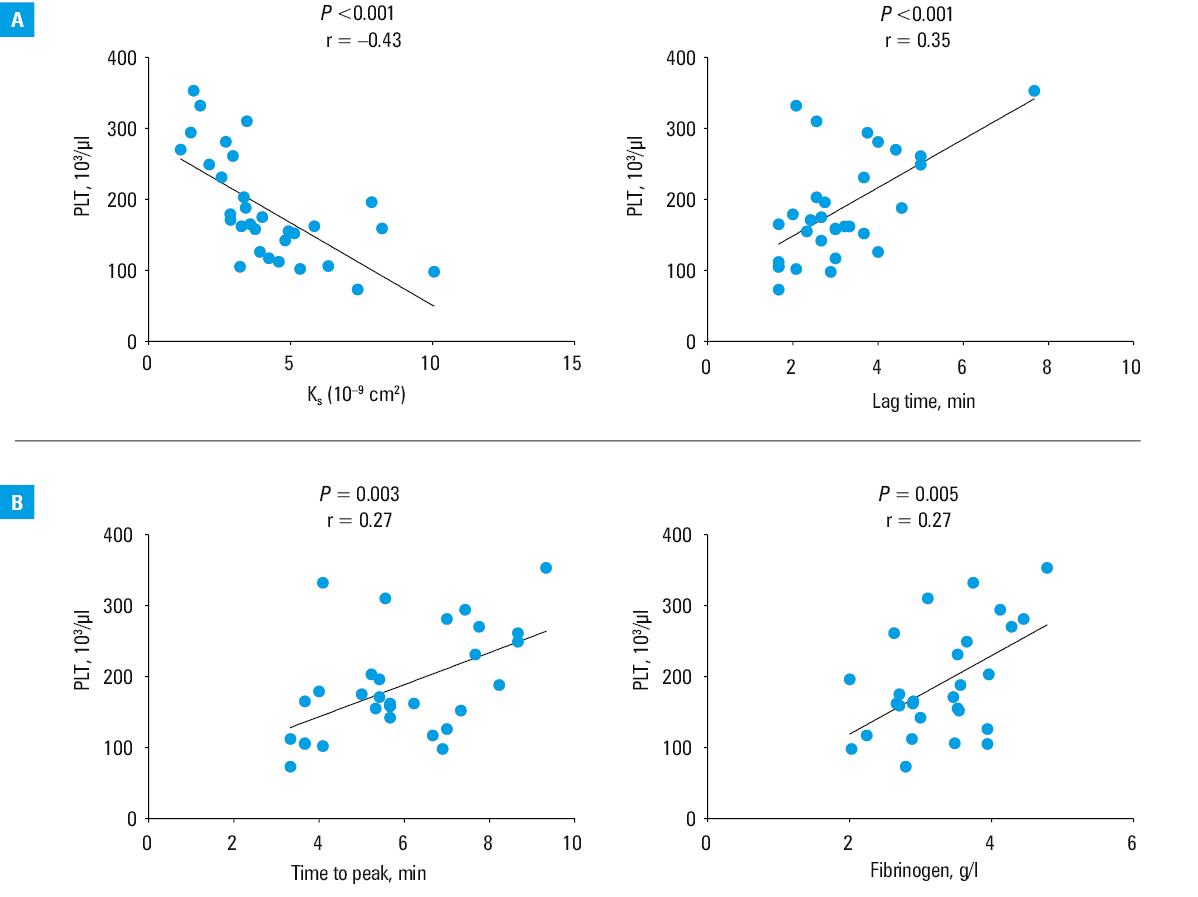
Moreover, associations emerged between baseline coagulation parameters and laboratory results, for example for hs‑CRP and fibrinogen (P = 0.01; r = 0.49), glucose and fibrinogen (P = 0.03; r = 0.42), NT‑proBNP and peak thrombin concentration (P = 0.04; r = –0.38), and ΔNT‑proBNP and CLT (P = 0.04; r = 0.33). Additionally, substantial associations were recognized between baseline platelet parameters, specifically PLT, PCT, and Ks, lag time, time to peak thrombin concentration, and fibrinogen (Figure 3). The intervariable correlation between PLT and PCT was very high (r = 0.95), leading us to present solely the results of a simple linear regression between PLT and the coagulation parameters. Other correlations between routine laboratory results and analyzed coagulation parameters are listed in Supplementary material, Table S4.
Changes in N‑terminal pro–B‑type natriuretic peptide
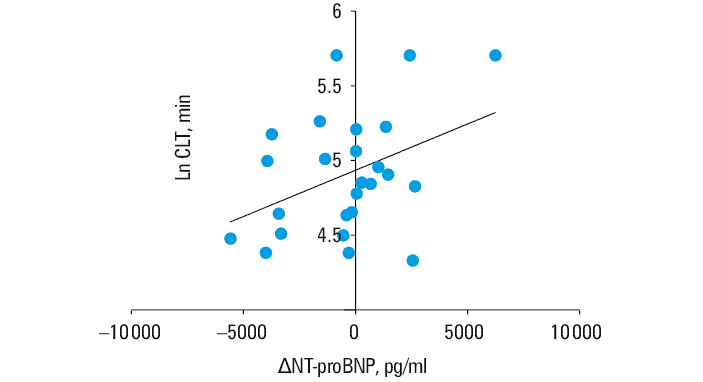
Given the impact of NT‑proBNP level on patient prognosis, we assessed its postprocedural changes with reference to the coagulation parameters. This allowed us to assess the impact of initial (V1) thrombin generation potential, fibrin clot permeability, and lysis on alterations in NT‑proBNP levels after TEER (V2 vs V1) and during follow‑up (V3 vs V1). We showed that only CLT correlated with the NT‑proBNP change between V2 and V1 (r = 0.4; P = 0.049; Figure 4). Finally, in the multivariable analysis, we demonstrated that baseline CLT increased the early post‑TEER NT‑proBNP levels (V2) adjusted for the initial NT‑proBNP level (R2 = 0.55; estimate, 15.65; 95% CI, 2.86–28.44; P = 0.02).
Discussion
This study is the first comprehensive assessment of fibrin clot characteristics and thrombin generation in patients with HF and severe MR undergoing TEER. Our results show that TEER induced changes in fibrinogen levels and favorable alterations in fibrin clot properties over a median of 50‑day follow‑up. Notably, these changes were not significant as compared with the preprocedural period. Nevertheless, we identified a significant association between baseline CLT and early reduction in NT‑proBNP levels, highlighting CLT as a key indicator of the hemodynamic response to MR reduction following TEER. Moreover, we demonstrated that baseline CLT level was significantly associated with the NT‑proBNP level change in the early post‑TEER period, regardless of baseline NT‑proBNP concentration.
Literature data comprise conflicting hypotheses regarding thromboembolism risk after TEER. Van Laer et al25 demonstrated that severe MR has a protective role in LA appendage thrombus formation.25 They claimed that severe MR attenuated the atrial thrombotic risk by more than 50%, and should be considered a novel predictor not yet included in the CHA2DS2-VASc score. This finding was confirmed by Cresti et al26 who reported lower incidence of LA thrombosis in severe MR than in mild‑to‑moderate MR patients (2.4% vs 8.9%; P <0.05), and similar LA thrombosis incidence in individuals without MR (2.4%).26 These results may be confusing in the context of TEER introduced as a method for reducing severe MR. Moreover, TEER as a method of treatment is dedicated to high‑risk HF patients with multimorbidity, and therefore particularly exposed to thromboembolic complications.26 However, this is not reflected in the currently available data. In the COAPT trial,15 the stroke and myocardial infarction risk was comparable in the TEER and control group. The incidence of venous thromboembolism events has not been analyzed.15 Similar conclusions emerge from the MITRA‑FR study (Multicentre Study of Percutaneous Mitral Valve Repair MitraClip Device in Patients with Severe Secondary Mitral Regurgitation).27 Furthermore, the periprocedural thromboembolic complications, such as LA thrombus formation and clip embolization, are rare and occur only in 9% and less than 0.05% of cases, respectively.28 However, our current data constitute the first comprehensive report on the impact of TEER on fibrin clot properties.
Preclinical studies provided evidence that prolonged exposure to or sudden increase in high shear stress may lead to platelet activation.10,29 In the case of abdominal aortic or coronary aneurysms, platelet activation modifies the fibrin clot features and architecture.30,31 The relationships we demonstrated between platelet parameters and the main features of fibrin clot formation and thrombin generation, already well‑known in the literature, suggest that these parameters may also play a significant role in post‑TEER patients.32 Nevertheless, Meindl et al33 did not observe significant changes in the von Willebrand factor activity and antigen after TEER. Noteworthy, postprocedural transmitral gradient equal to or above 4 mm Hg was a predictor of acquired von Willebrand syndrome.33 Moreover, increased shear stress after TEER may lead to hemolytic complications.8 This may explain, along with periprocedural blood loss, the decrease in red blood cell parameters we observed shortly after the procedure. However, it should be mentioned that in our study this decrease was not clinically significant in any patient, nor did it lead to clinically important decisions, for example, blood transfusion.
Fibrin formation is the final step in the coagulation cascade. The association between fibrin clot permeability, clot lysis, and thrombin generation assessed in this study has been demonstrated in many cardiovascular diseases.34-37 As showed by Palka et al,38 also HFrEF patients are characterized by significantly lower fibrin clot permeability and trend toward CLT prolongation. Moreover, in HFrEF patients LA diameter, but not LVEF, correlated with CLT.38 Contrary to these findings, we observed a positive relationship between LVEF and CLT. Another intriguing finding in TEER patients is the association between baseline CLT and early postprocedural reduction in NT‑proBNP level. A similar association of elevated NT‑proBNP with unfavorably altered plasma fibrin clot properties was demonstrated in atrial fibrillation (AF) patients.39 In the PLATO (Platelet Inhibition and Patient Outcomes) study, CLT increased with higher levels of NT‑proBNP and troponin T, which was associated with worse outcomes.40 However, clinical significance of the fibrin clot modifications in TEER patients requires verification in a larger group of patients.
The relationship between NT‑proBNP and fibrin clot or thrombin generation parameters was demonstrated by Matusik et al39 in AF patients, and this clot phenotype was associated with prior ischemic stroke. Moreover, NT‑proBNP was showed to have a predictive value in AF patients off anticoagulation, and was partly attributed to prothrombotic blood alterations (ETP and CLT).41 Finally, patients with decompensated HF (increased NT‑proBNP levels) when compared with chronic HF individuals, exhibited accelerated formation of denser fibrin clots, potentially increasing the risk of thromboembolic complications,38 which is similar to our results.
Limitations
Our study has some limitations that need to be addressed. Firstly, despite the supported sample size calculation, the number of participants was restricted. Secondly, the HF group included all HF phenotypes (HFrEF, HFmrEF, and HFpEF), but the analyses primarily concentrated on MR within the entire group. Additionally, platelet activation parameters and hemolytic markers were not examined in the final analysis, limiting a more comprehensive exploration of the impact of platelet activation and shear stress on the observed effects.
Conclusions
We assessed for the first time fibrin clot characteristics and thrombin generation potential in patients undergoing the mitral TEER procedure. We demonstrated that fibrinogen levels decreased, and the permeation coefficient increased during a median 50‑day post‑TEER follow‑up, as compared with assessments shortly after the procedure. However, the analyzed blood coagulation parameters did not significantly differ from baseline vs the follow‑up assessment. Finally, CLT emerged as an independent predictor of the early decline in NT‑proBNP, underscoring its importance as a key indicator of the hemodynamic response to TEER.
- Ładziński S, Niedziela J, Witkowski A, et al. The influence of severe mitral regurgitation on major adverse cardiac and cerebrovascular events after myocardial infarction in 1‑year follow‑up: data from PL‑ACS registry. Kardiol Pol. 2023; 81: 572‑579. | Crossref
- Kowalewski M, Dąbrowski EJ, Kuźma Ł, et al. Tricuspid intervention for less‑than‑severe regurgitation simultaneously with minimally invasive mitral valve surgery in patients with atrial fibrillation. Kardiol Pol. 2023; 81: 990‑997. | Crossref
- Haberman D, Dahan S, Poles L, et al. Transcatheter edge‑to‑edge repair in acute mitral regurgitation following acute myocardial infarction: recent advances. Kardiol Pol. 2022; 80: 1190‑1199. | Crossref
- Zalewska J, Skowronski J, Witkowski A, Pregowski J. The percutaneous embolization of the coronary artery fistula after edge‑to‑edge repair of mitral and tricuspid valve regurgitation. Kardiol Pol. 2022; 80: 610‑611. | Crossref
- Bochenek M, Kosowski M, Przybylski R, et al. Bridge to recovery with left ventricular assist device and mitral transcatheter edge‑to‑edge repair in cardiogenic shock due to acute ischemic mitral insufficiency: a novel option to treat patients without surgery or heart transplant. Pol Arch Intern Med. 2023; 133: 16651. | Crossref
SUPPLEMENTARY MATERIAL
ARTICLE INFORMATION