
Relationship between iron homeostasis and prognosis in patients with heart failure: a retrospective study based on the MIMIC-IV database
Key words: first-admission mortality, heart failure, iron homeostasis, long-term mortality, MIMIC-IV database

 CC BY 4.0
Relationship between iron homeostasis and prognosis in patients with heart failure: a retrospective study based on the MIMIC-IV database
CC BY 4.0
Introduction: The role of iron homeostasis has become increasingly recognized as a key factor in determining a prognosis of patients with heart failure (HF). Disruptions in iron balance, encompassing deficiency and overload, can affect patient prognosis, and therefore, significantly impact treatment and management strategies.
Objectives: The study investigated possible associations between iron homeostasis–related indicators and long‑term mortality as well as first‑admission mortality in individuals with HF.
Patients and methods: Data on 3483 HF patients from the MIMIC‑IV database were retrospectively analyzed. The relationship between iron homeostasis–related indicators (ferritin, serum iron, transferrin, and total iron binding capacity [TIBC]) and the first‑admission and long‑term mortality of HF patients was discerned utilizing the Cox proportional hazards model and the Kaplan–Meier survival analysis. Additionally, the predictive capability of these indicators for patient prognosis was assessed using the receiver operating characteristic curve.
Results: Fourth quartile levels of ferritin and serum iron were obviously associated with poor long‑term outcomes in HF patients. Conversely, fourth quartile levels of transferrin and TIBC served as protective factors and were associated with a lower mortality. Additionally, iron homeostasis indicators exhibited a certain predictive value for both long‑term mortality and first‑admission mortality in HF patients.
Conclusions: This study underscores a significant association between iron homeostasis indicators and the prognosis of HF patients, providing valuable insights into risk stratification and clinical decision‑making for this population. Future studies should focus on dynamic fluctuations in iron homeostasis and explore interventions to improve the prognosis of HF patients.
What's new?
Iron metabolism is gaining increasing attention in the treatment of heart failure (HF). This study, for the first time, associates iron metabolism–related indicators with a prognosis of HF patients. We found that elevated levels of ferritin and serum iron, as well as low total iron‑binding capacity and transferrin level, are all indicators of higher mortality. This finding underscores the importance of comprehensive monitoring of iron metabolism in clinical practice. Not only should iron deficiency be monitored, but also the risks associated with iron overload should be considered. These insights provide important information for clinicians in developing more comprehensive strategies for managing iron metabolism, and enhancing prognostic outcomes in HF treatment.
Introduction
As average life expectancy increases, the incidence and prevalence of heart failure (HF) have steadily risen in recent years.1-3 Iron, a trace element, is indispensable for various fundamental biological processes in humans and pathogens, encompassing activities from DNA synthesis to adenosine triphosphate generation.4 External stimuli can disrupt the body’s iron homeostasis,5,6 and studies have shown that during the onset of HF, myocardial cells can exhibit disruptions in iron regulation.7,8
Current research has indicated that in patients with symptomatic HF, the prevalence of iron deficiency is approximately 50%, and iron deficiency can independently predict mortality.9,10 Iron deficiency negatively impacts the quality of life and prognosis of HF patients. Many studies suggested that intravenous injection of ferric carboxymaltose can improve iron deficiency symptoms (serum ferritin <100 ng/ml or 100–299 ng/ml with transferrin saturation <20%) in HF patients.11-13
Iron overload can also cause significant damage to the heart. Studies have shown that iron overload can exacerbate myocardial cell damage.14,15 Patients with hemochromatosis often experience iron overload accompanied by HF.16 One of the mechanisms behind this is that excess iron induces production of reactive oxygen species, which cause damage to cells.17 Multiple studies have also found that the use of iron chelators can reduce the incidence of cardiovascular adverse events.18-21
Currently, multiple biomarkers of HF have shown positive significance for the diagnosis and management of HF.22-25 However, there is a paucity of research aimed at elucidating the link between iron homeostasis indicators and the prognosis of HF.
In this study, iron homeostasis–related indicators and other clinical data were extracted from HF patients listed in the MIMIC‑IV database to observe the relationship between these iron homeostasis indicators and patient prognosis.
Patients and methods
This retrospective study investigated the acquired data on individuals with HF from the MIMIC‑IV database, a large database developed and run by the Laboratory for Computational Physiology at the Massachusetts Institute of Technology. The database encompasses a substantial number of high‑quality patient medical records from the intensive care unit at the Beth Israel Deaconess Medical Center.26
One author (HJ) conducted data extraction in accordance with requirements for accessing the database. Patients diagnosed with HF based on the International Classification of Diseases, Ninth Revision (ICD‑9) and Tenth Revision (ICD‑10), were incorporated into this study. The exclusion criteria were the age below 18 years at the time of the first admission and lack of data related to iron homeostasis. For the patients admitted multiple times due to HF, only the data from their first admission were extracted. Ultimately, 3483 patients were included in the study.
Data extraction
PostgresSQL (V14.6) and Navicate Premium (V16) tools were leveraged to extract data by running the Structured Query Language command. The extracted potential variables consisted of: 1) demographics, such as age, sex, and body mass index (BMI); 2) comorbidities, including atrial fibrillation, obesity, diabetes, and hypertension; and 3) laboratory results, such as ferritin, serum iron, and transferrin level, and total iron binding capacity (TIBC). Follow‑up started on the day of admission and ended on the day of death. In this study, due to substantial positive skewness in the distribution of ferritin levels, ferritin was log‑transformed for analysis. All laboratory variables and disease severity scoring were derived from the first‑admission data.
To avoid potential biases, if a variable exhibited more than 20% missing values, it was converted into a dummy variable. For variables with less than 20% missing data, multiple imputation was performed using a random forest algorithm (trained by other nonmissing variables) by the “mice” package in R software (R Foundation for Statistical Computing, Vienna, Austria).
The primary outcome measure in our study was long‑term mortality, and the secondary outcome measure was first‑admission mortality.
Continuous variables, based on their distribution, were represented either by mean and SD or by median and interquartile range (IQR), while categorical variables were displayed as percentages. The Kolmogorov–Smirnov test was leveraged to discern normality of continuous data. Continuous variables, if normally distributed, were analyzed with the t test or analysis of variance, whereas non‑normally distributed continuous variables were analyzed with the Mann–Whitney test or the Kruskal–Wallis test. The Cox proportional hazards model was used to calculate the hazard ratio (HR) and 95% CI for the link between iron homeostasis–related indicators and outcomes, and the model was adjusted stepwise to include confounders (Model 1: unadjusted; Model 2: adjusted for age and sex; Model 3: adjusted for age, sex, BMI, hypertension, atrial fibrillation, diabetes, obesity, old myocardial infarction, and albumin, globulin, and N‑terminal pro–B‑type natriuretic peptide level). The Kaplan–Meier survival analysis was executed to examine the incidence of end points in individuals with various levels of iron homeostasis–related indicators (ferritin, serum iron, transferrin, TIBC), and the difference was assessed by with the log‑rank test. Furthermore, a restricted cubic spline (RCS) model was employed to unravel the nonlinear relationships between iron homeostasis–related indicators and both long‑term mortality and first‑admission mortality. The relationship between iron homeostasis (ferritin, serum iron, transferrin, and TIBC) and mortality risk was examined using RCS curves. All statistical analyses were executed by employing R software (V4.0.2). A P value below 0.05 was considered significant.
Results
The study included 3483 individuals with HF (Supplementary material, Figure S1). Median age of these patients was 72 (IQR, 61–82) years, and 1839 patients (53%) were men. Median duration of long‑term follow‑up was 132 (IQR, 18–811) days. Median duration of in‑hospital follow‑up was 8 (IQR, 5–15) days. Of the 3483 patients, 1584 died. Those who died of HF had lower TIBC and transferrin levels and higher ferritin levels (Table 1, Supplementary material, Table S1).
Parameter | Overall (n = 3483) | Nonsurvivors (n = 1899) | Survivors (n = 1584) | P value |
Data are presented as numbers and percentage or median and interquartile range.
SI conversion factors: to convert ferritin to μg/l, multiply by 1; serum iron to μmol/l, by 0.179; total iron binding capacity to μmol/l, by 0.179, transferrin to μmol/l, by 0.123. | ||||
Age, y | 72 (61–82) | 68 (57–79) | 77 (67–84) | <0.001 |
Length of initial stay, d | 8 (5–15) | – | – | – |
Long‑term follow‑up, d | 132 (18–811) | – | – | – |
Women | 1644 (47) | 872 (46) | 772 (49) | 0.1 |
Ferritin (log2), original unit, ng/ml | 7.85 (6.57–8.96) | 7.73 (6.43–8.85) | 7.95 (6.71–9.05) | <0.001 |
Serum iron, µg/dl | 37 (24–58) | 37 (23–58) | 37(24–59) | 0.28 |
Total iron binding capacity, µg/dl | 246 (194–307) | 255 (203–321) | 237 (185–293) | <0.001 |
Transferrin, mg/dl | 189 (149–236) | 196 (156–247) | 182 (142–225) | <0.001 |
Acute coronary syndromes | 834 (24) | 398 (21) | 436 (28) | <0.001 |
Myocardial infarction | 832 (24) | 396 (21) | 436 (28) | <0.001 |
Unstable angina | 2 (0.1) | 2 (0.1) | 0 | 0.5 |
Old myocardial infarction | 752 (22) | 363 (19) | 389 (25) | <0.001 |
Atrial fibrillation | 1735 (50) | 837 (44) | 898 (57) | <0.001 |
Diabetes | 1621 (47) | 844 (44) | 777 (49) | 0.007 |
Hypertension | 1400 (40) | 762 (40) | 638 (40) | 0.93 |
Obesity | 678 (19) | 427 (22) | 251 (16) | <0.001 |
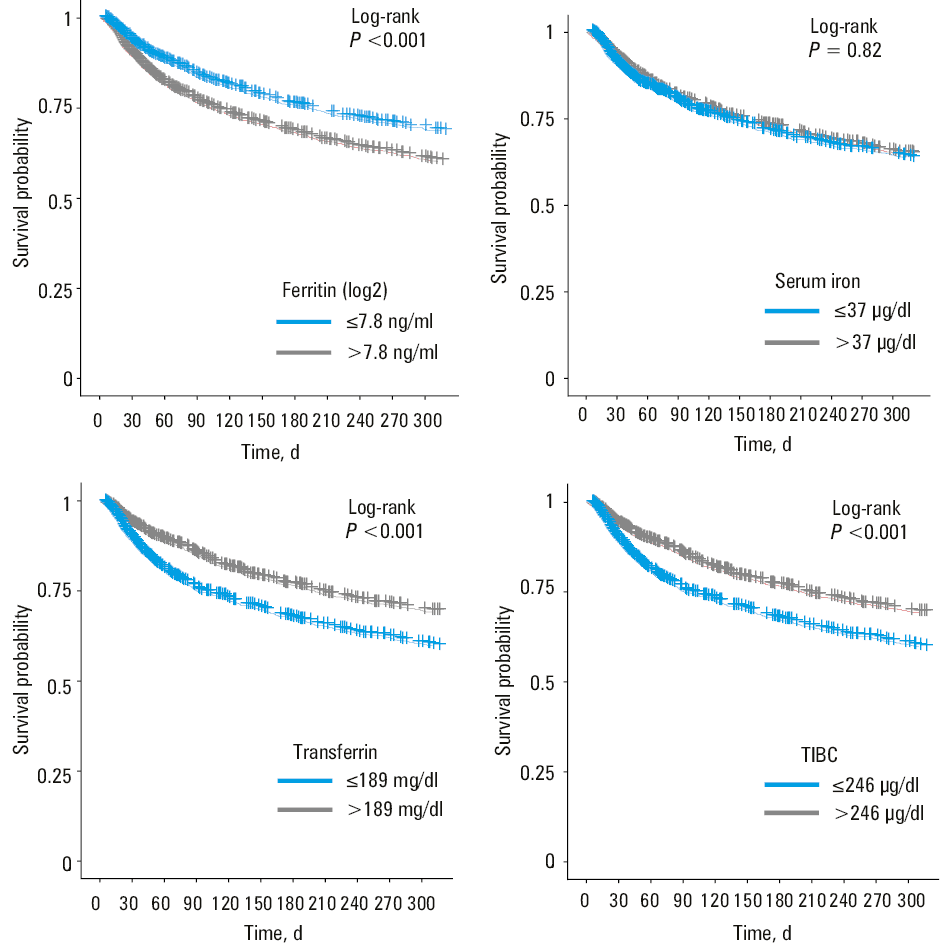
The patients were grouped based on the median values of each iron homeostasis indicator. The Kaplan–Meier survival analysis curves were employed to examine the incidence of the primary end points in different groups. As shown in Figure 1, higher ferritin levels and lower transferrin and TIBC levels (log‑rank P <0.001) were linked to a poor long‑term prognosis in HF patients. However, different levels of serum iron did not affect the prognosis of individuals with HF (log‑rank P = 0.82). Supplementary material, Figure S2 depicts the results of the Kaplan–Meier survival analysis for the first‑admission mortality. Likewise, the patients with higher ferritin levels (log‑rank P = 0.13) and lower transferrin and TIBC levels (log‑rank P = 0.26) showed higher mortality. No difference was noted between HF patients with high and low serum iron levels (log‑rank P = 0.91).
Abbreviations: TIBC, total iron binding capacity
The Cox proportional hazards model was leveraged to discern the link between iron homeostasis–related indicators and first‑admission mortality and long‑term mortality in patients with HF. Upon analyzing ferritin and serum iron as continuous variables, the results suggested that serum iron and ferritin were important risk factors for long‑term mortality in patients with HF (Table 2, Table 3) (ferritin: Model 1: HR, 1.103; 95% CI, 1.074–1.133; P <0.001; Model 2: HR, 1.15; 95% CI, 1.117–1.183; P <0.001; Model 3: HR, 1.056; 95% CI, 1.024–1.089; P <0.001; serum iron: Model 2: HR, 1.002; 95% CI, 1–1.003; P = 0.008; Model 3: HR, 1.002; 95% CI, 1.001–1.004; P <0.001).
Parameter | Model 1 | Model 2 | Model 3 | ||||||
HR | 95% CI | P value | HR | 95% CI | P value | HR | 95% CI | P value | |
Model 1: unadjusted; Model 2: adjusted for sex and age; Model 3: adjusted for the variables in Model 2 and further for body mass index, hypertension, atrial fibrillation, diabetes, obesity, and albumin, globulin, and N‑terminal pro–B‑type natriuretic peptide levels
Abbreviations: HR, hazard ratio | |||||||||
In‑hospital mortality | |||||||||
Continuous variable per unit, µg/dl | 1.003 | 1–1.006 | 0.06 | 1.004 | 1–1.007 | 0.02 | 1.004 | 1.001–1.007 | 0.01 |
Quartile | |||||||||
Q1 | – | – | – | – | – | – | – | – | – |
Q2 | 0.935 | 0.631–1.387 | 0.74 | 0.955 | 0.644–1.416 | 0.82 | 1.037 | 0.694–1.548 | 0.86 |
Q3 | 0.82 | 0.536–1.254 | 0.36 | 0.859 | 0.561–1.315 | 0.48 | 0.91 | 0.59–1.405 | 0.67 |
Q4 | 0.991 | 0.673–1.459 | 0.96 | 1.057 | 0.718–1.557 | 0.78 | 1.129 | 0.755–1.688 | 0.55 |
Long‑term mortality | |||||||||
Continuous variable per unit, µg/dl | 1.001 | 1–1.002 | 0.19 | 1.002 | 1–1.003 | 0.008 | 1.002 | 1.001–1.004 | <0.001 |
Quartile | |||||||||
Q1 | – | – | – | – | – | – | – | – | – |
Q2 | 1.152 | 1.004–1.322 | 0.04 | 1.193 | 1.039–1.369 | 0.01 | 1.309 | 1.138–1.505 | <0.001 |
Q3 | 1.049 | 0.91–1.207 | 0.51 | 1.112 | 0.965–1.28 | 0.14 | 1.231 | 1.067–1.421 | 0.003 |
Q4 | 1.069 | 0.931–1.227 | 0.35 | 1.183 | 1.03–1.359 | 0.02 | 1.307 | 1.133–1.507 | <0.001 |
Parameter | Model 1 | Model 2 | Model 3 | ||||||
HR | 95% CI | P value | HR | 95% CI | P value | HR | 95% CI | P value | |
Model 1: unadjusted; Model 2: adjusted for sex and age; Model 3: adjusted for the variables in Model 2 and further adjusted for body mass index, hypertension, atrial fibrillation, diabetes, obesity, and albumin, globulin, and N‑terminal pro–B‑type natriuretic peptide levels
Abbreviations: see Table 2 | |||||||||
In‑hospital mortality | |||||||||
Continuous variable per unit | 1.166 | 1.077–1.263 | <0.001 | 1.205 | 1.108–1.312 | <0.001 | 1.123 | 1.028–1.227 | 0.01 |
Quartile | |||||||||
Q1 | – | – | – | – | – | – | – | – | – |
Q2 | 1.073 | 0.633–1.816 | 0.79 | 1.078 | 0.637–1.825 | 0.78 | 0.91 | 0.532–1.556 | 0.73 |
Q3 | 0.94 | 0.56–1.58 | 0.82 | 0.916 | 0.545–1.541 | 0.74 | 0.767 | 0.453–1.3 | 0.32 |
Q4 | 1.633 | 1.034–2.58 | 0.04 | 1.721 | 1.086–2.728 | 0.02 | 1.181 | 0.736–1.894 | 0.49 |
Long‑term mortality | |||||||||
Continuous variable per unit | 1.103 | 1.074–1.133 | <0.001 | 1.15 | 1.117–1.183 | <0.001 | 1.056 | 1.024–1.089 | <0.001 |
Quartile | |||||||||
Q1 | – | – | – | – | – | – | – | – | – |
Q2 | 1.364 | 1.181–1.575 | <0.001 | 1.353 | 1.171–1.564 | <0.001 | 1.183 | 1.021–1.37 | 0.03 |
Q3 | 1.325 | 1.149–1.527 | <0.001 | 1.337 | 1.159–1.543 | <0.001 | 1.028 | 0.887–1.19 | 0.72 |
Q4 | 1.533 | 1.331–1.765 | <0.001 | 1.819 | 1.575–2.101 | <0.001 | 1.177 | 1.01–1.37 | 0.04 |
The same conclusion was reached for the relationship between ferritin and serum iron and first‑admission mortality (Table 2, Table 3) (ferritin: Model 1: HR, 1.166; 95% CI, 1.077–1.263; P <0.001; Model 2: HR, 1.205; 95% CI, 1.108–1.312; P <0.001; Model 3: HR, 1.123; 95% CI, 1.028–1.227; P = 0.01; serum iron: Model 2: HR, 1.004; 95% CI, 1–1.007; P = 0.02; Model 3: HR, 1.004; 95% CI, 1.001–1.007; P = 0.01).
When ferritin and serum iron were categorized as categorical variables, all 3 established models consistently revealed that fourth quartile levels of ferritin and serum iron were associated with a higher risk of long‑term mortality (Table 2, Table 3) (ferritin: Model 1: HR, 1.533; 95% CI, 1.331–1.765; P <0.001; Model 2: HR, 1.819; 95% CI, 1.575–2.101; P <0.001; Model 3: HR, 1.177; 95% CI, 1.01–1.37; P = 0.04; serum iron: Model 2: HR, 1.183; 95% CI, 1.03–1.359; P = 0.02; Model 3: HR, 1.307; 95% CI, 1.133–1.507; P <0.001).
Additionally, fourth quartile levels of ferritin were found to be associated with a higher risk of first‑admission mortality (Table 3) (ferritin: Model 1: HR, 1.633; 95% CI, 1.034–2.58; P = 0.04; Model 2: HR, 1.721; 95% CI, 1.086–2.728; P = 0.02; Model 3: HR, 1.181; 95% CI, 0.736–1.894; P = 0.49), but other factors were also involved. No association between higher serum iron levels and in‑hospital mortality was noted (Table 2) (serum iron: Model 1: HR, 0.991; 95% CI, 0.673–1.459; P = 0.96; Model 2: HR, 1.057; 95% CI, 0.718–1.557; P = 0.78; Model 3: HR, 1.129; 95% CI, 0.755–1.688; P = 0.55).
When transferrin and TIBC were analyzed as continuous variables, the results suggested that transferrin and TIBC were protective factors for the long‑term prognosis of patients with HF (Table 4, Table 5) (transferrin: Model 1: HR, 0.997; 95% CI, 0.996–0.998; P <0.001; Model 2: HR, 0.996; 95% CI, 0.996–0.997; P <0.001; Model 3: HR, 0.999; 95% CI, 0.998–1; P = 0.03; TIBC: Model 1: HR, 0.998; 95% CI, 0.997–0.998; P <0.001; Model 2: HR, 0.997; 95% CI, 0.997–0.998; P <0.001; Model 3: HR, 0.999; 95% CI, 0.999–1; P = 0.03). In terms of the relationship between the first‑admission mortality and these 2 indicators, transferrin and TIBC were found to be protective factors during hospitalization in patients with HF (Table 4, Table 5) (transferrin: Model 1: HR, 0.996; 95% CI, 0.993–0.998; P <0.001; Model 2: HR, 0.996; 95% CI, 0.993–0.998; P <0.001; Model 3: HR, 0.998; 95% CI, 0.995–1; P = 0.07; TIBC: Model 1: HR, 0.997; 95% CI, 0.995–0.999; P <0.001; Model 2: HR, 0.997; 95% CI, 0.995–0.999; P <0.001; Model 3: HR, 0.998; 95%, CI 0.996–1; P = 0.07).
Parameter | Model 1 | Model 2 | Model 3 | ||||||
HR | 95% CI | P value | HR | 95% CI | P value | HR | 95% CI | P value | |
Model 1: unadjusted; Model 2: adjusted for sex and age; Model 3: adjusted for the variables in model 2 and further adjusted for body mass index, hypertension, atrial fibrillation, diabetes, obesity, and albumin, globulin, and N‑terminal pro–B‑type natriuretic peptide levels
Abbreviations: see Table 2 | |||||||||
In‑hospital mortality | |||||||||
Continuous variable per unit, mg/dl | 0.996 | 0.993–0.998 | <0.001 | 0.996 | 0.993–0.998 | <0.001 | 0.998 | 0.995–1 | 0.07 |
Quartile | |||||||||
Q1 | – | – | – | – | – | – | – | – | – |
Q2 | 0.46 | 0.303–0.698 | <0.001 | 0.433 | 0.285–0.658 | <0.001 | 0.523 | 0.339–0.808 | 0.003 |
Q3 | 0.604 | 0.402–0.908 | 0.02 | 0.574 | 0.381–0.863 | 0.008 | 0.677 | 0.439–1.044 | 0.08 |
Q4 | 0.591 | 0.381–0.915 | 0.02 | 0.618 | 0.399–0.958 | 0.03 | 0.838 | 0.52–1.35 | 0.47 |
Long‑term mortality | |||||||||
Continuous variable per unit, mg/dl | 0.997 | 0.996–0.998 | <0.001 | 0.996 | 0.996–0.997 | <0.001 | 0.999 | 0.998–1 | 0.03 |
Quartile | |||||||||
Q1 | – | – | – | – | – | – | – | – | – |
Q2 | 0.762 | 0.668–0.871 | <0.001 | 0.668 | 0.584–0.763 | <0.001 | 0.825 | 0.717–0.949 | 0.007 |
Q3 | 0.702 | 0.614–0.804 | <0.001 | 0.623 | 0.544–0.714 | <0.001 | 0.855 | 0.739–0.99 | 0.04 |
Q4 | 0.583 | 0.506–0.673 | <0.001 | 0.547 | 0.474–0.632 | <0.001 | 0.851 | 0.726–0.997 | 0.045 |
Parameter | Model 1 | Model 2 | Model 3 | ||||||
HR | 95% CI | P value | HR | 95% CI | P value | HR | 95% CI | P value | |
Model 1: unadjusted; Model 2: adjusted for sex and age; Model 3: adjusted for the variables in Model 2 and further adjusted for body mass index, hypertension, atrial fibrillation, diabetes, obesity, and albumin, globulin, and N‑terminal pro–B‑type natriuretic peptide levles
Abbreviations: see Table 2 | |||||||||
In‑hospital mortality | |||||||||
Continuous variable per unit, µg/dl | 0.997 | 0.995–0.999 | <0.001 | 0.997 | 0.995–0.999 | <0.001 | 0.998 | 0.996–1 | 0.07 |
Quartile | |||||||||
Q1 | – | – | – | – | – | – | – | – | – |
Q2 | 0.46 | 0.303–0.698 | <0.001 | 0.433 | 0.285–0.658 | <0.001 | 0.523 | 0.339–0.808 | 0.003 |
Q3 | 0.604 | 0.402–0.908 | 0.02 | 0.574 | 0.381–0.863 | 0.008 | 0.677 | 0.439–1.044 | 0.08 |
Q4 | 0.591 | 0.381–0.915 | 0.02 | 0.618 | 0.399–0.958 | 0.03 | 0.838 | 0.52–1.35 | 0.47 |
Long‑term mortality | |||||||||
Continuous variable per unit, µg/dl | 0.998 | 0.997–0.998 | <0.001 | 0.997 | 0.997–0.998 | <0.001 | 0.999 | 0.999–1 | 0.03 |
Quartile | |||||||||
Q1 | – | – | – | – | – | – | – | – | – |
Q2 | 0.762 | 0.668–0.871 | <0.001 | 0.668 | 0.584–0.763 | <0.001 | 0.825 | 0.717–0.949 | 0.007 |
Q3 | 0.702 | 0.614–0.804 | <0.001 | 0.623 | 0.544–0.714 | <0.001 | 0.855 | 0.739–0.99 | 0.04 |
Q4 | 0.583 | 0.506–0.673 | <0.001 | 0.547 | 0.474–0.632 | <0.001 | 0.851 | 0.726–0.997 | 0.045 |
When transferrin and TIBC were analyzed as categorical variables, in the 3 established models, patients with fourth quartile levels of transferrin and TIBC showed a lower risk of long‑term mortality, with identical values for both indicators (Table 4, Table 5) (Model 1: HR, 0.583; 95% CI, 0.506–0.673; P <0.001; Model 2: HR, 0.547; 95% CI, 0.474–0.632; P <0.001; Model 3: HR, 0.851; 95% CI, 0.726–0.997; P = 0.045). For the first‑admission mortality, patients with fourth quartile levels of transferrin and TIBC had a lower risks of in‑hospital mortality at the first admission, with identical values for both indicators (Table 4, Table 5) (Model 1: HR, 0.591; 95% CI, 0.381–0.915; P = 0.02; Model 2: HR, 0.618; 95% CI, 0.399–0.958; P = 0.03; Model 3: HR, 0.838; 95% CI, 0.52–1.35; P = 0.47). The results identified transferrin and TIBC as significant protective factors during hospitalization of patients with HF.
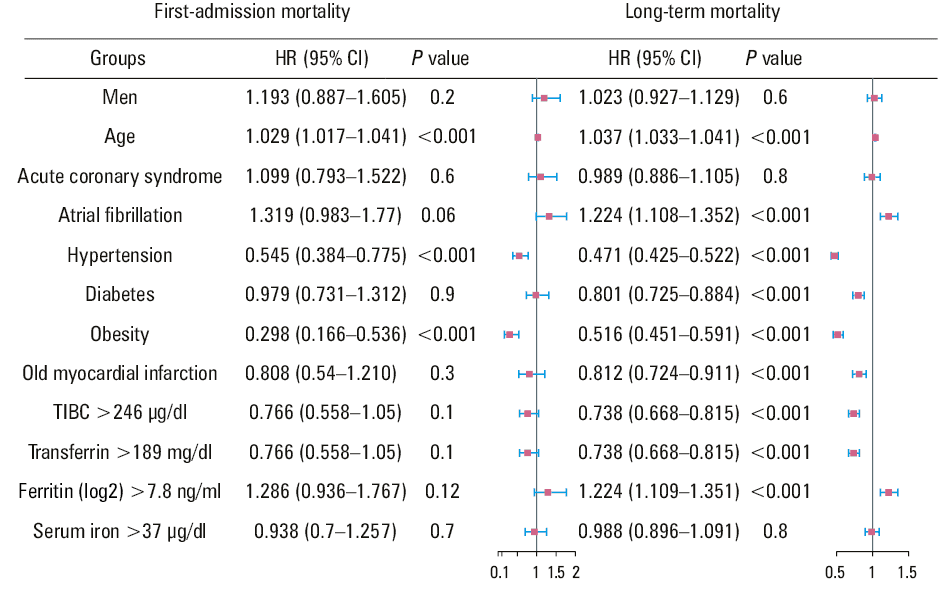
The univariable Cox regression was performed for various indicators of HF concerning both in‑hospital and long‑term mortality. A forest plot illustrating these findings is depicted in Figure 2. Our analysis showed that the association between in‑hospital mortality and iron homeostasis–related indicators was not significant in HF patients. However, higher than median TIBC and transferrin levels were protective factors for long‑term mortality (HR, 0.738; 95% CI, 0.668–0.815; P <0.001). Higher than median ferritin level was a risk factor for HF patients (HR, 1.224; 95% CI, 1.109–1.351; P <0.001), and higher than median level of serum iron (HR, 0.988; 95% CI, 0.896–1.091; P = 0.82) was not associated with long‑term mortality in patients with HF.
Receiver operating characteristic (ROC) analysis was implemented to evaluate the accuracy of iron homeostasis–related indicators in predicting the prognosis of HF. We found that all indicators related to serum iron homeostasis had a certain value in forecasting short‑term (3‑day) in‑hospital mortality in patients with HF (Supplementary material, Figure S3; area under the curve [AUC]; TIBC, 0.603; ferritin, 0.699; serum iron, 0.612; transferrin, 0.603). As for long‑term mortality (Supplementary material, Figure S3), both TIBC and transferrin had a certain predictive value for the 3‑month mortality in HF patients (AUC; TIBC, 0.623; transferrin, 0.623; ferritin, 0.594). However, serum iron exhibited poor predictive value (AUC, 0.495).
In the ROC analysis, a relationship was found between 4 serum iron homeostasis indicators and the prognosis of HF patients. In Supplementary material, Figure S4, the AUC value was used to evaluate the combined predictive capability of these 4 indicators for the prognosis of HF patients. We found that the model based on these 4 indicators performed favorably in predicting 3‑day in‑hospital mortality (AUC, 0.684) and in long‑term prognosis (30‑day AUC, 0.615; 60‑day AUC, 0.628; 90‑day AUC, 0.617) in HF patients.
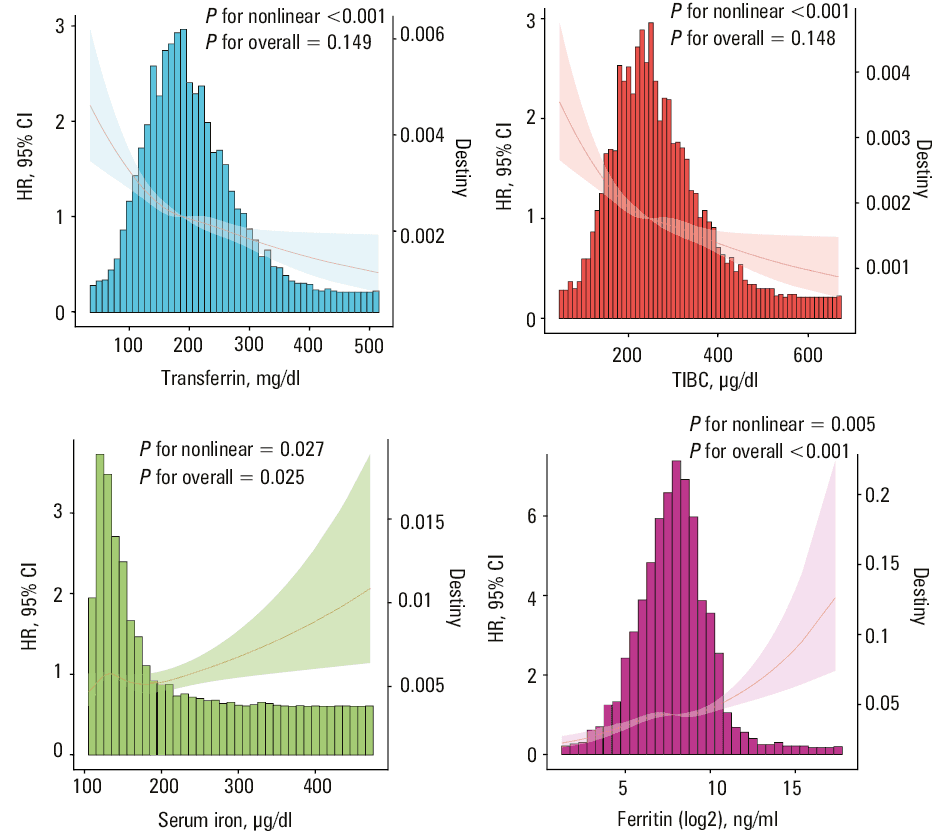
As shown in Figure 3 and Supplementary material, Figure S5, RCS analysis was used to discern the relationship between the risk of first‑admission mortality and long‑term mortality with iron homeostasis parameters. Both low and high levels of serum iron were found to be linked with adverse prognosis. The first‑admission mortality was positively associated with ferritin level, and negatively with the level of transferrin and TIBC, with both associations being nonlinear. RCS was also used to examine the link between long‑term mortality risk and the parameters of iron homeostasis, and showed that the long‑term mortality was positively linked to serum iron and ferritin levels, and negatively to the levels of transferrin and TIBC, with both associations following a nonlinear trend.
Discussion
In our systematic review of previous randomized controlled trials (Supplementary material, Table S2) on iron supplementation therapy in patients with HF, we observed that this treatment could alleviate HF symptoms to some extent. However, as compared with placebo, its impact on hospitalization and cardiovascular mortality of HF patients was insignificant. Moreover, research has suggested that utilization of sodium‑glucose transporter agonists may result in plasma iron deficiency, without significant depletion in intracellular iron levels, indicating that iron supplementation may not be an effective strategy for patients with HF accompanied by iron deficiency.27 Our study further investigated the association between iron levels and the prognosis of HF patients in the MIMIC‑IV database by analyzing iron homeostasis indicators.
The univariable Cox regression analysis identified ferritin and serum iron as key indicators of poor prognosis in patients with HF. Specifically, the increase in serum iron and ferritin levels was proportional to the risk severity. Unexpectedly, we also observed that HF patients with low serum iron and ferritin levels did not exhibit an increased risk of mortality. It could be seen that plasma ferritin and serum iron levels may not completely represent the cellular level of iron deficiency, as they are influenced by multiple factors. This underscores the need to explore new biomarkers to more accurately present the true cellular iron deficiency status in HF patients. The increase in ferritin and serum iron may suggest chronic inflammation.28,29 Also, studies have shown that elevated ferritin level is associated with an increased risk of newly‑developed HF in women.30 Moreover, excessively high iron level may trigger cell death through iron death mechanisms.31
The Cox regression analysis and RCS analysis demonstrated that high levels of transferrin and TIBC were associated with a protective effect in patients with HF. Studies have shown that supplementation with transferrin can effectively reverse myocardial iron deficiency status and promote cardiomyocyte differentiation in vitro.32,33 Transferrin deficiency was also observed in specific pathological conditions, such as in cardiomyocytes in Duchenne muscular dystrophy.34 Therefore, transferrin supplementation therapy holds promise as a novel direction for treatment of HF patients.
The univariable Cox regression analysis unexpectedly found that obesity, diabetes, and hypertension played a protective role in the long‑term prognosis of HF patients. These findings may be attributed to greater energy reserves observed in obese and diabetic patients. Additionally, HF patients with good nutritional status generally exhibit a more favorable prognosis.35-37 Moreover, hypertensive patients, by maintaining higher coronary perfusion pressure, may reduce the risk of HF progression.38 These results indicated that considering the joint impact of these factors is necessary for the management of HF patients, particularly when devising personalized treatment regimens.
Limitations
Due to limitations of the MIMIC‑IV database, data reflecting the cardiac function were missing, thus preventing an in‑depth exploration of the link between iron homeostasis indicators and cardiac function.
The MIMIC‑IV database only included initial iron homeostasis levels, so the dynamic changes in the iron homeostasis–related indicators were not captured. Further clinical studies are required to analyze the relationship between the dynamic changes in iron homeostasis indicators and the prognosis of HF patients.
Conclusions
This study extends the practicality of iron homeostasis–related indicators to HF patients, highlighting their potential utility as indices for stratifying the long‑term mortality risk in this population. Monitoring iron homeostasis–related indicators can help clinicians in the diagnosis and management of HF. However, there remains a need to explore new interventions targeting iron homeostasis to improve the prognosis of HF patients.
- Conrad N, Judge A, Tran J, et al. Temporal trends and patterns in heart failure incidence: a population‑based study of 4 million individuals. Lancet. 2018; 391: 572‑580. | Crossref
- van Riet EES, Hoes AW, Wagenaar KP, et al. Epidemiology of heart failure: the prevalence of heart failure and ventricular dysfunction in older adults over time. A systematic review. Eur J Heart Fail. 2016; 18: 242‑252. | Crossref
- Kamsani S, Sanders P. The fraction we know: heart failure phenotypes and their clinical outcomes. Pol Arch Intern Med. 2023; 133: 16630. | Crossref
- Drakesmith H, Prentice A. Viral infection and iron metabolism. Nat Rev Microbiol. 2008; 6: 541‑552. | Crossref
- Drakesmith H, Prentice AM. Hepcidin and the iron‑infection axis. Science. 2012; 338: 768‑772. | Crossref
SUPPLEMENTARY MATERIAL
ARTICLE INFORMATION