Introduction
The Swedish National Diabetes Registry, conducted between 1998 and 2012, found that type 1 diabetes mellitus (T1DM) diagnosed at the age between 1 and 10 years was associated with a reduced life expectancy by 14.2 years in men and by 17.7 years in women.1 A majority of data regarding development of cardiovascular complications stem from studies on patients with type 2 diabetes mellitus (T2DM). However, the underlying process of hyperglycemia is different in T1DM (lack of insulin) and T2DM (insulin resistance). Patients with T1DM and T2DM usually differ in their risk factor profile and presence of atherosclerotic disease and other comorbidities (eg, obesity, hypertension, atherosclerosis) at the time of diagnosis. Therefore, extrapolation of data obtained in the T2DM population to the T1DM one may not be justified, especially at early stages of the disease. The incidence of subclinical cardiovascular complications in young adults with T1DM is insufficiently studied.
Hyperglycemia present in T1DM patients inevitably leads to vascular endothelial damage, arterial stiffness, and atherosclerosis.2 At an early stage, deterioration of vasodilatory function is observed, and distant consequences include abnormalities in the microcirculation (small arteries and veins, arterioles, capillaries, and venules),3 which manifest clinically as retinopathy, nephropathy, and diabetic neuropathy. Studies in children and young adults have shown that even in this age group, there is already a significant reduction in flow‑mediated artery vasodilation (flow‑mediated dilation [FMD]), and higher values of intima‑media complex thickness (intima‑media thickness [IMT]) are observed, as compared with healthy peers.4 Analysis of arterial stiffness in T1DM patients showed an increase in aortic pulse wave velocity (PWV) even in the absence of organ changes.5 The T1DM patient population also shows impaired diastolic myocardial function that precedes impaired systolic function,6 and a higher incidence of heart failure.7
In order to better understand cardiovascular risk in adult diabetic patients before the age of 30 years, we decided to identify relationships between the duration of T1DM and occurrence of subclinical cardiovascular target organ damage.
Patients and methods
Study population
The study population included 56 adult patients supervised by the Diabetes Outpatient Clinic of the M. Konopnicka University Pediatrics Centre in Łódź who were between 18 and 28 years old, had T1DM diagnosed in childhood or adolescence, and signed an informed consent to participate in the study and diagnostics.
Based on the duration of T1DM, the patients were divided into group 1 (n = 25; T1DM duration ≤10 years) and group 2 (n = 31; T1DM duration >10 years). All patients had their glycated hemoglobin (HbA1c) level measured (between 3 weeks before and 3 weeks after a noninvasive testing). Based on the HbA1c levels, the patients were divided into 2 groups with HbA1c concentration equal to or below 7.5% and above 7.5%. Additional post hoc 2 × 2 factorial analysis was performed combining a circadian blood pressure (BP) profile (dipper and nondipper) as well as the duration of T1DM dichotomized for the longer (>10 years) and shorter period (≤10 years).
Definitions of medical conditions
For the purpose of this study, overweight was defined as body mass index (BMI) between 25 and 29.9 kg/m2. Obesity was defined as a BMI greater than or equal to 30 kg/m2. Nonproliferative diabetic retinopathy was defined as microaneurysm, hard or soft exudate, blot hemorrhages, and microinfarcts. Proliferative retinopathy referred to neovascularization, which appeared as a tortuous collection of blood vessels.
Noninvasive diagnostics
All tests assessing endothelial function (PWV, FMD, ankle‑brachial index [ABI]), as well as echocardiography and ultrasound of the carotid arteries, were performed at the Department of Cardiology of the Medical University of Lodz. All patients underwent noninvasive diagnostics including: 1) 24‑hour ambulatory blood pressure monitoring (ABPM), 2) 2‑dimensional transthoracic echocardiography (TTE) including myocardial speckle tracking, 3) aortic PWV measurement, 4) ultrasound of the carotid arteries, 5) ABI measurement, and 6) assessment of brachial artery FMD.
Twenty‑four‑hour ambulatory blood pressure measurement
Out‑of‑hospital 24‑hour ABPM was performed using the 90227 OnTrak recorder (Spacelabs Healthcare, Snoqualmie, Washington, United States). Based on the measurements, the presence of hypertension and the dipper or nondipper circadian BP profile were assessed. Hypertension was diagnosed when mean arterial pressure was above 135/85 mm Hg during periods of activity, above 120/70 mm Hg at rest, and above 130/80 mm Hg during the day. The dipper profile was diagnosed when the decrease in mean BP during bedrest was 10%–20%, as compared with mean for active / day hours. The nondipper profile was reported when the decrease in mean values during night rest was below 10%.
Echocardiography
Two‑dimensional TTE was performed using the Vivid 9 system (GE Healthcare, Horten, Norway). During examination, a minimum of 3 heart cycles were recorded for the apical 2-, 3-, and 4‑chamber views, maintaining the frame rate in the range of 60–80 per second and adjusting the sector width to the size of the myocardium. The recorded image loops were then analyzed offline on an Echo‑PAC v203 workstation (GE Healthcare, United States). Left ventricular global longitudinal strain (GLS) was calculated using automated functional imaging package, and the result was presented as a bull’s‑eye polar map in a 17‑segment model.
Aortic pulse wave velocity
PWV was measured after a 10‑minute rest in the supine position. PWV was determined using a SphygmoCor device (AtCor Medical, Sydney, Australia), based on the distance from the femoral artery to the place where the pulse wave was measured on the common carotid artery.
Ankle‑brachial index
The test was performed by using a specialized ABPI MD device (MESI, Ljubljana, Slovenia) allowing for simultaneous measurements of blood pressure at the arm and around both ankles. The ABI index was calculated automatically by dividing the systolic BP (SBP) at the ankle by the SBP at the arm.
Flow‑dependent vasodilation of the brachial artery
During examination, a sphygmomanometer cuff was placed on the upper arm, proximal to the examination site. A linear Doppler transducer (Vivid, GE Healthcare) was used to visualize the brachial artery by measuring the artery diameter and blood flow velocity using pulsed Doppler. Then, the cuff of the blood pressure monitor was inflated and maintained for 5 minutes at 50 mm Hg above the SBP value. After that time, the cuff was deflated, releasing the pressure. Approximately 60 seconds after releasing the pressure, the maximum diameter of the vessel was measured. FMD expresses the percentage change in the diameter of the brachial artery after ischemia in relation to the initial diameter of the vessel.
Statistical analysis
Statistical analysis was performed using MedCalc software version 12.1.4 (MedCalc, Ostend, Belgium). Normality of quantitative variable distribution was tested using the Shapiro–Wilk test. For comparison of 2 quantitative variables, the t test was employed for those with a normal distribution, and the Mann–Whitney test for those with a non‑normal distribution. Qualitative data expressed as a percentage were examined as a comparison of proportions using the χ2 test. The results were considered significant if P value was below 0.05. Correlations were assessed with the Pearson linear correlation test and expressed using the correlation coefficient r. One‑way analysis of variance was used to evaluate differences in the examined parameters between subgroups depending on the daily BP profile and duration of T1DM. Due to the homogeneity of variance in the subgroups, the Scheffe test was used for the post hoc tests. The size of the group was estimated on the basis of available literature.8-10 Published studies were sourced for data on a difference in the mean value and SD for PWV and ABI in T1DM patients. Calculations using MedCalc software, with α equal to 0.05 as the level of significance were made. They showed that a minimum group size of 56 patients is enough for demonstrating differences in GLS, IMT, and PWV, assuming a 1:1 ratio of the compared groups.
Results
Study group characteristics
A total of 56 patients (48% men) with T1DM were included, at a median (interquartile range [IQR]) age of 22 (18–28) years. The study group characteristics are presented in Supplementary material, Table S1. Median (IQR) duration of T1DM was 11.3 (6–22) years. No patient in the study group had a history of myocardial infarction, coronary angioplasty, or stroke. Hypertension was present in 9 (16%) and thyroid disease in 10 (18%) of the study participants. In the total group of 56 patients, 10 (18%) were overweight (BMI, 25–29.9 kg/m2) and 2 (4%) were obese (BMI, 30–34.9 kg/m2). Routine ophthalmologic examination detected abnormal fundus in 4 (7%), nonproliferative retinopathy in 3 (5%), and preproliferative retinopathy in 1 (2%) patient.
Comparison of noninvasive test results depending on diabetes duration
PWV values were higher in the group 1 (T1DM duration ≤10 years) than in the group 2 (T1DM duration >10 years) (5.3 m/s vs 5.6 m/s; P = 0.01). In contrast, the absolute GLS value was lower in the group 2 than in the group 1 (19.55% vs 20.48%; P = 0.04). In addition, a linear relationship of T1DM duration with GLS and PWV was examined using the Spearman correlation analysis. The results showed a weak but significant negative correlation between T1DM duration and GLS (P = 0.04; r = –0.28), while no correlation was found between T1DM duration and PWV (P = 0.03; r = 0.03).
Comparison of noninvasive test results depending on glycated hemoglobin levels
Between 3 weeks before and 3 weeks after the noninvasive testing, all patients had their HbA1c level measured. No considerable differences in absolute values were detected between patients with HbA1c level equal to or below 7.5% (n = 27) and those with HbA1c level above 7.5% (n = 29) for GLS (20% vs 19.3%; P = 0.16), PWV (5.7 vs 5.7 m/s; P = 0.9), ABI (1.03 vs 1.03; P = 0.82), IMT (0.65 vs 0.66 mm; P = 0.91), and FMD (8.1% vs 7.9%; P = 0.72).
Additional analyses
The number of patients in individual subgroups differed, as there were 17 patients with diabetes duration above 10 years and dipper profile, 14 patients with diabetes duration above 10 years and nondipper profile, 12 patients with diabetes duration up to or equal to 10 years and dipper profile, and 13 patients with diabetes duration up to or equal to 10 years and nondipper profile. The one‑way analysis of variance was performed for GLS, IMT, ABI, and FMD, as normality of their distribution was established. Differences between the subgroups were confirmed for GLS (P = 0.04) and IMT (P = 0.01) (Supplementary material, Table S2). To assess which of the compared subgroups differed from each other, a post hoc analysis with the Scheffe test was performed, which identified differences between: 1) the patients with diabetes duration up to or equal to 10 years and dipper or nondipper profile for GLS (P = 0.04; Figure 1A); 2) the patients with diabetes duration above 10 years and nondipper profile vs those with diabetes duration up to or equal to 10 years and nondipper profile for IMT score (P = 0.01; Figure 1B).
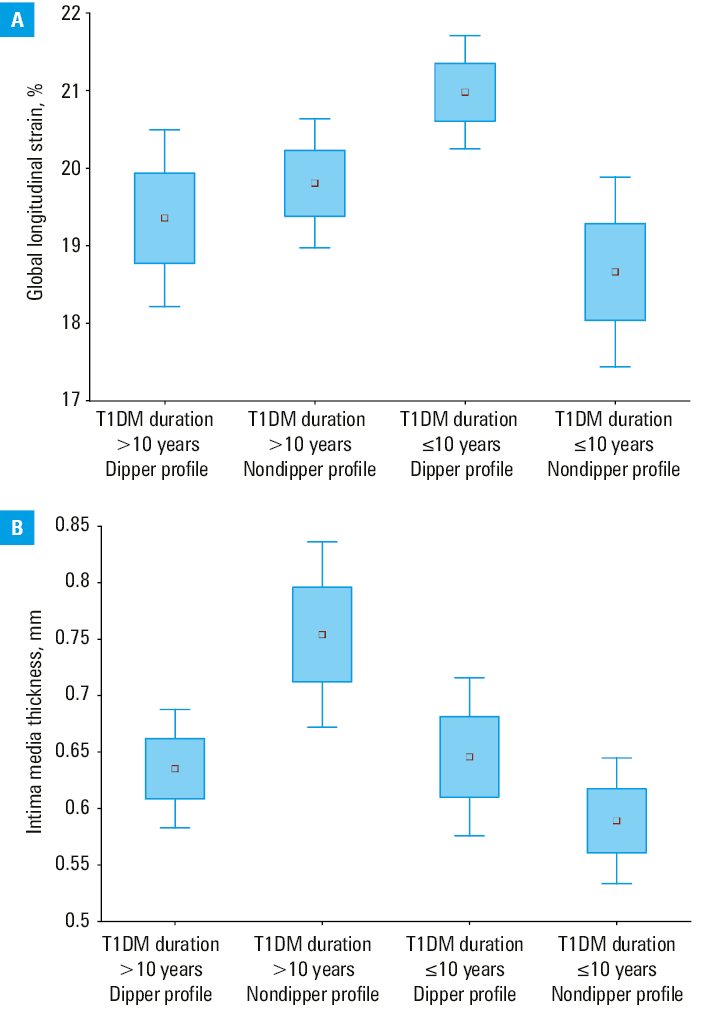
Abbreviations: T1DM, type 1 diabetes mellitus
Discussion
The study demonstrated that GLS and PWV change significantly with T1DM duration. In our study group, mean absolute GLS values were lower than the ranges of age‑specific reference values in the healthy population.11 A comparison between groups showed a significantly lower absolute GLS value in the patients with longer T1DM duration (>10 years). Additionally, the Spearman correlation analysis confirmed a significant linear relationship between T1DM duration and GLS values, showing that the absolute GLS value decreases with T1DM duration. Mean PWV values for the entire study population were within normal range,12 but reached a significantly higher level in the group with longer T1DM duration (>10 years). In contrast to GLS, no linear correlation between PWV and T1DM duration was found. This could be explained by the nonlinear (eg, exponential) nature of the relationship or by the influence of other factors, such as sex, glycemic control, or BP control. A post hoc analysis combining BP and T1DM duration characteristics showed that the subgroups with T1DM duration equal to or below 10 years differed significantly in GLS values depending on the circadian BP profile (dipper vs nondipper). Still, the mean GLS in the entire study group (n = 56) differing only in the dipper vs nondipper daily BP profile was not significantly different. These data suggest that in the patients with shorter T1DM duration, the nondipper profile may have an adverse effect on left ventricular function as assessed by GLS. This is consistent with previously published studies, where the nondipper profile was associated with poorer left ventricular function in healthy individuals.13-15 The dipper vs nondipper difference was not observed in the patients with T1DM duration longer than 10 years. This finding provides new insights into the impact of the daily BP profile in the group of young patients with T1DM. Secondly, the post hoc analysis showed that in the nondipper group, the IMT value differed significantly depending on T1DM duration (≤10 years vs >10 years). Among the nondipper patients, the subgroup with T1DM duration above 10 years had the IM complex thickness significantly greater than the subgroup with T1DM duration up to or equal to 10 years. Previous studies comparing the dipper and nondipper profile in T1DM patients proved that the nondipper pattern was associated with proliferative retinopathy, nephropathy16 and lower FMD values.17 In a study by Mateo–Gavira et al,18 circadian BP profile was determined in a group of T1DM patients (mean age, 28 years). After 7 years of follow‑up significantly more frequent microvascular changes were detected in patients with a baseline nondipper profile.18 The results of our study and previous studies suggest that vascular lesions may develop more frequently in the nondipper group and longer duration of T1DM.
It is also noteworthy that there was no significant difference in the abovelisted noninvasive cardiovascular tests depending on the last known HbA1c level (≤7.5% vs >7.5%). Although HbA1c measurement remains a gold standard in monitoring of diabetes, it reflects average glycemia of the past 3 months and does not reflect glycemia variance (periods of hyperglycemia, euglycemia, and hypoglycemia), or glycemic equilibrium before these 3 months. A new technology of continuous glucose monitoring allows for real‑time continuous glycemic measurement, and such parameters as time‑in‑range of glycemic targets are gaining importance.19,20 The method seems very promising, even though it still requires further research to be used in assessing metabolic compensation and predicting complications.
Study limitations
The group we studied came from a single center. This fact ensures a fairly homogeneous therapeutic approach; however, it may differ in other regions of Poland, Europe, and on the global scale. In addition, the study group consisted of relatively young people with a low proportion of complications. Supplementing the observations with cardiac magnetic resonance imaging would add valuable information on the health status of the patients.
Conclusions
Patients with T1DM duration of more than 10 years had significantly lower absolute GLS and significantly higher PWV. In addition, GLS showed a significant linear correlation with T1DM duration. A post hoc analysis showed that the patients with the nondipper daily BP profile and T1DM duration of more than 10 years had a higher mean IMT than those with the nondipper daily BP profile and T1DM duration of up to or equal to 10 years. In contrast, in the group with a shorter duration of T1DM, the nondippers had significantly lower mean absolute GLS values than the dippers. As subclinical target organ damage can be detected even in young adults with T1DM, in the group of patients suffering from T1DM for more than 10 years, echocardiography and PWV evaluation are recommended.
- Rawshani A, Sattar N, Franzén S, et al. Excess mortality and cardiovascular disease in young adults with type 1 diabetes in relation to age at onset: a nationwide, register‑based cohort study. Lancet. 2018; 392: 477‑486. | Crossref
- Katakami N. Mechanism of development of atherosclerosis and cardiovascular disease in diabetes mellitus. J Atheroscler Thromb. 2018; 25: 27‑39. | Crossref
- Cade W. Diabetes‑related microvascular and macrovascular diseases in the physical therapy setting. Phys Ther. 2008; 88: 1322‑1335. | Crossref
- van der Heyden J, Birnie E, Bovenberg S, et al. Do traditional cardiovascular risk factors solely explain intima‑media thickening in youth with type 1 diabetes? J Diabetes Complications. 2016; 30: 1137‑1143. | Crossref
- Terlemez S, Bulut Y, Ünüvar T, et al. Evaluation of arterial stiffness in children with type 1 diabetes using the oscillometric method. J Diabetes Complications. 2016; 30: 864‑867. | Crossref
SUPPLEMENTARY MATERIAL
ARTICLE INFORMATION