Association of skeletal muscle karyopherin α1 and α2 with myogenesis and insulin action
1 , 3
, 3


 CC BY-NC-SA 4.0
Association of skeletal muscle karyopherin α1 and α2 with myogenesis and insulin action
Introduction
Insulin resistance has been previously linked with impaired myogenic / regenerative potential of skeletal muscle.1 Low muscle mass and its coexistence with obesity (sarcopenic obesity) is a risk factor for type 2 diabetes (T2D).2 Individuals with newly diagnosed T2D have a lower ratio of lean mass to fat mass, as compared with nondiabetic individuals.3
In adult life, skeletal muscle myogenic / regenerative potential is enabled by muscle stem cells, referred to as satellite cells. Upon activation, satellite cells generate myoblasts, which proliferate and subsequently differentiate and fuse into multinucleated myofibers.4 Myogenesis is controlled by transcription factors; myoblast determination protein 1 and myogenic factor are one of the earliest factors involved in satellite cell proliferation, whereas myogenin is expressed during differentiation.4
Satellite cells constitute approximately 4% of cells in adult muscle5; myonuclear turnover is 1%–2% per week.6 Depletion of satellite cells was shown to negatively impact running volume and muscle fiber hypertrophy.7 Satellite cells contribute to myofibers in all young and old adult muscles, in the absence of injury.8,9 Small myofiber injuries, which occur during routine daily activity, lead to satellite cell activation.10 In humans, a correlation between satellite cell content and muscle ability to hypertrophy11 and contribution to nonhypertrophic muscle remodeling12 was described. The presence of activated satellite cells was demonstrated in healthy adult muscle at rest.13
Gene expression is regulated by transcription factors and chromatin remodeling factors, synthesized in the cytoplasm but exerting their effects in the nucleus.14 Macromolecules require nuclear transport receptors enabling transport through the pore complexes in the nuclear envelope. Such transport is possible thanks to karyopherins, which are classical nuclear import receptors.14,15 The KPNA1 and KPNA2 genes encode karyopherin α1 (KPNA1) and karyopherin α2 (KPNA2), respectively. Both proteins influence myogenesis, but act independently of and oppositely to each other.14
We have recently demonstrated that runt‑related transcription factor 1 (RUNX1) in muscle may play a role in modulation of insulin action through its effect on myogenesis, which suggests that myogenic / regenerative potential of adult skeletal muscle may be an important determinant of insulin sensitivity.16 In our study, we hypothesized that nuclear import through karyopherins may play a role in modulating insulin action, and that this effect may be related to skeletal muscle myogenic / regenerative potential. A study carried out in young individuals without possible confounding factors, such as morbid obesity or hyperglycemia, may allow for the estimation of an early association between nuclear import, myogenesis, and insulin sensitivity.
The aim of the present study was to analyze the association between skeletal muscle KPNA1 and KPNA2 and insulin sensitivity. Furthermore, we aimed to assess whether the potential effect of karyopherins is dependent on myogenesis.
Patients and methods
Study group
The study group comprised 59 young (age, 18–35 years) individuals, 30 with normal weight (body mass index [BMI] <25 kg/m2; 19 men and 11 women) and 29 with overweight or obesity (BMI, 25–40 kg/m2; 20 men and 9 women). All participants were nonsmokers, led a sedentary lifestyle, had no serious diseases, morbid obesity, or clinical and laboratory signs of inflammation (normal serum high‑sensitivity C‑reactive protein [hs‑CRP] and plasma fibrinogen levels, and white blood cell count), and were not taking any drugs. Their body weight was stable for at least 3 months prior to the study, and their glucose tolerance was normal, based on an oral glucose tolerance test. Clinical examination, anthropometric measurements, laboratory analyses, hyperinsulinemic‑euglycemic clamp, and vastus lateralis muscle biopsy were performed as previously described.16 The study protocol was approved by the Ethics Committee of Medical University of Bialystok (R‑I‑002/439/2016). A written informed consent was obtained from all individuals before their participation in the study.
Cell culture
L6 rat skeletal muscle cell culture, gene silencing, cell culture growth monitoring, and cell glucose uptake measurement were performed as previously described.16 Kpna1 and Kpna2 silencing (si) was performed separately at the proliferating stage (myoblasts) and at the late stage of differentiation (myotubes), separately for each gene.
Quantitative polymerase chain reaction and protein analysis
Gene expression with quantitative polymerase chain reaction using a LightCycler 480 II System (Roche Diagnostics, Rotkreuz, Switzerland) and protein analysis were performed as described previously.16 Reagents for gene silencing, primers, and antibodies for the measurement of KPNA expression are reported in Supplementary material, Table S1.
Statistical analysis
Statistical analysis was performed with the STATISTICA 13.5 software (Statsoft, Kraków, Poland). Variables that did not have a normal distribution (insulin, triglyceride, hs‑CRP, gene expression in human muscle) were log‑transformed prior to analyses. Continuous variables are presented as arithmetic mean (SD) or geometric mean (geometric SD factor). Differences between the groups were estimated with the unpaired t test with the Benjamini–Hochberg correction for multiple comparisons. Differences and changes in gene expression during cell cultures were studied with 1‑way analysis of variance (ANOVA) and with repeated‑measures ANOVA and the post hoc Tukey test. The effects of insulin stimulation on glucose uptake and protein kinase B (Akt) phosphorylation were studied with repeated‑measures ANOVA with planned comparisons. The relationships between variables were studied with the Pearson product moment correlation analysis and with multiple regression analysis. The level of significance was set at P value below 0.05.
Results
Skeletal muscle karyopherin α1 and α2 expression in normal‑weight and overweight / obese individuals
Mean (SD) BMI was 21.97 (1.69) kg/m2 in the normal‑weight group and 29.85 (3.38) kg/m2 in the overweight / obese group. Insulin sensitivity was lower in the overweight / obese individuals than in the normal‑weight participants (Supplementary material, Table S2). Serum hs‑CRP (P <0.001) and plasma fibrinogen levels (P = 0.008) were higher in overweight / obese individuals (Supplementary material, Table S2); however, these parameters remained within the normal range in all participants.
Muscle KPNA1 expression was lower in the overweight / obese than in the normal‑weight individuals, both in the entire study group (P <0.001) (Figure 1A) and in the subgroups of men (P = 0.005) and women (P = 0.004). KPNA2 expression did not differ between the groups (Figure 1A). No differences between men and women in muscle KPNA1 and KPNA2 expression was observed.
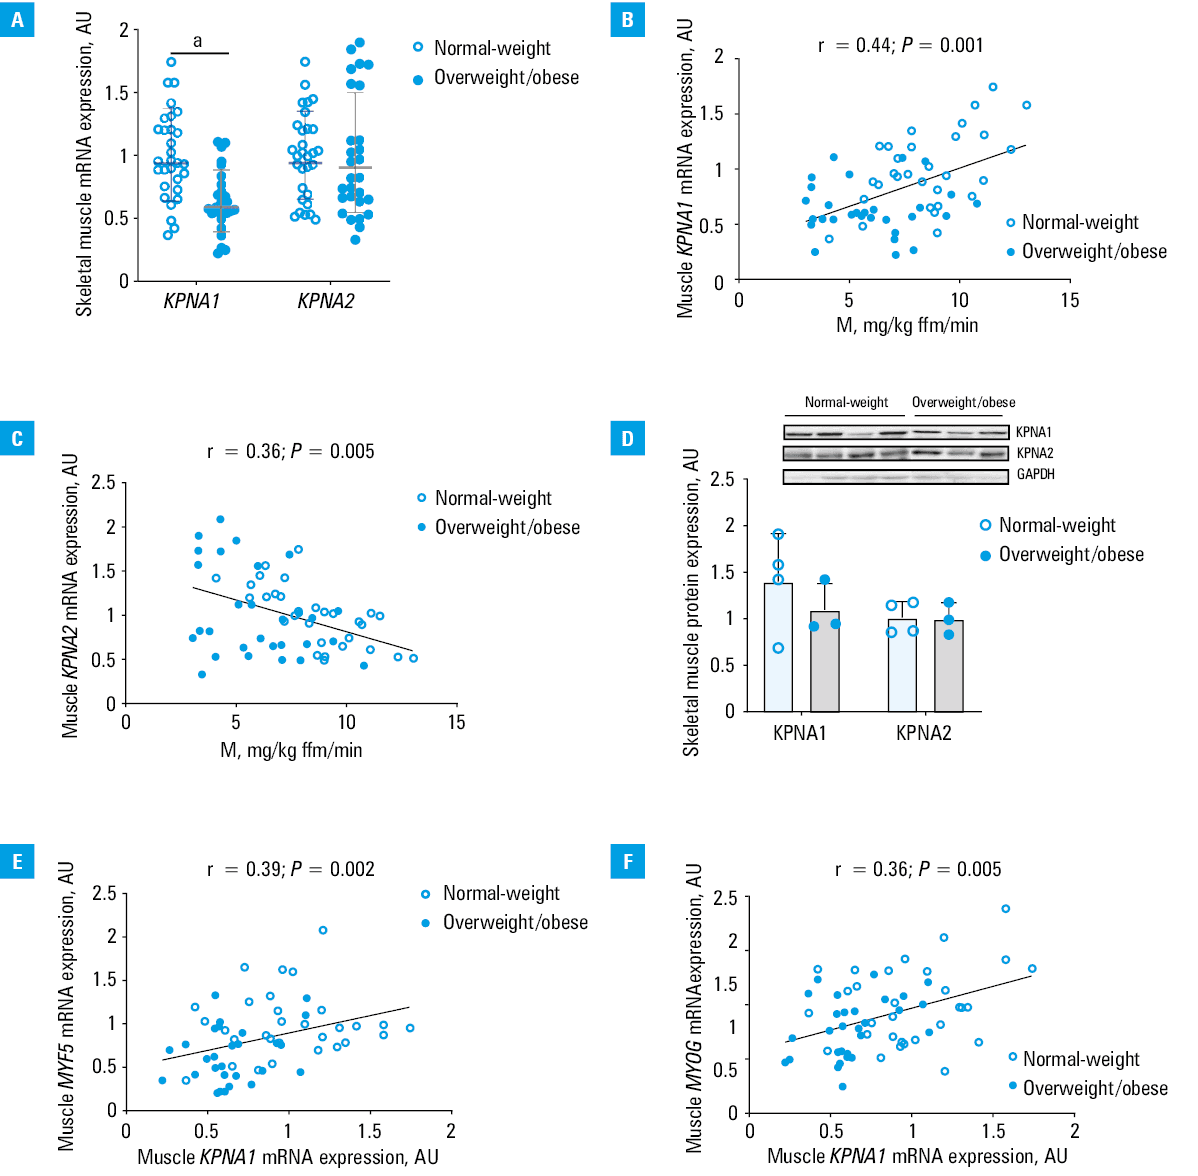
Abbreviations: AU, arbitrary unit
Muscle KPNA1 and KPNA2 mRNA expressions positively correlated with each other (r = 0.3; P = 0.02). Despite that, they were differentially related to insulin sensitivity. KPNA1 expression positively correlated with insulin sensitivity in the entire group (r = 0.44; P <0.001) (Figure 1B), and in the subgroups of men (r = 0.41; P = 0.01) and women (r = 0.51; P = 0.02). KPNA2 expression correlated negatively with insulin sensitivity in the entire group (r = –0.36; P = 0.005) (Figure 1C), and in the subgroups of men (r = –0.34; P = 0.03) and women (r = –0.61; P = 0.004). The correlations of KPNA1 and KPNA2 with insulin sensitivity were independent of each other and of age, sex, and BMI (with insulin sensitivity as a dependent variable; KPNA1, standardized β = 0.47; KPNA2, standardized β = –0.55; both P <0.001).
Muscle KPNA1 and KPNA2 protein expression was measured in 7 individuals, 4 normal‑weight and 3 with overweight / obesity, in whom tissue was available for protein measurement. Both KPNA1 and KPNA2 protein expression correlated strongly with KPNA1 and KPNA2 mRNA expression (r = 0.89; P = 0.007 and r = 0.77; P = 0.04, respectively). KPNA1 and KPNA2 protein expression did not differ between the groups (Figure 1D). KPNA1 protein expression correlated positively with insulin sensitivity (r = 0.88; P = 0.008).
Overweight / obese participants had lower muscle MYOG (encoding the late differentiation factor myogenin), MYH1, and MYH2 expression, as compared with normal‑weight individuals (Supplementary material, Table S2). Muscle KPNA1 expression was positively related to MYF5 (r = 0.39; P = 0.002) (Figure 1E), MYOG (r = 0.36; P = 0.005) (Figure 1F), and MYH2 expression (r = 0.28; P = 0.03). KPNA2 expression was not related to the expression of myogenic factors. Muscle karyopherin levels were not related to inflammatory parameter levels.
Kpna1 and Kpna2 after gene silencing at the stage of myoblast
Kpna1 knockdown in myoblasts resulted in 90% decrease in mRNA expression and 49% decrease in protein expression (Supplementary material, Figure S1A). In the siKpna1-treated cells, Kpna1 expression was lower in comparison with the non‑coding (NC)-treated cells throughout proliferation and differentiation, reaching significance during proliferation (P <0.001) and at the end of differentiation (P = 0.002) (Supplementary material, Figure S1B).
Kpna2 knockdown in myoblasts resulted in 90% decrease in mRNA expression and 52% decrease in protein expression (Supplementary material, Figure S1C). In the siKpna2-treated cells, Kpna2 expression was lower in comparison with the NC‑treated cells until the start of differentiation (P <0.001) (Supplementary material, Figure S1D).
The siKpna1-treated cells initially proliferated faster than the NC‑treated cells (Supplementary material, Figure S2A), with cell index higher at 12–24 hours and 24–48 hours, but lower at 48–72 hours (Supplementary material, Figure S2B). Early myogenic factor Myf5 expression was decreased in the siKpna1-treated cells in comparison with the control cells on the third day of growth (3GM; P = 0.04) (Supplementary material, Figure S2C). During differentiation, Myog expression was decreased in the siKpna1-treated cells in comparison with the NC‑treated cells (Supplementary material, Figure S2D).
The siKpna2-treated cells initially proliferated slower than the NC‑treated cells (Supplementary material, Figure S2A), with cell index lower at 12–24 hours and 24–48 hours, but higher at 48–72 hours (Supplementary material, Figure S2B). Myf5 expression was increased in the siKpna2-treated cells in comparison with the control cells on 3GM (P = 0.03) (Supplementary material, Figure S2C). During differentiation, Myog expression did not differ between the groups (Supplementary material, Figure S2D).
In the developed myotubes, insulin increased Akt phosphorylation in the NC‑treated cells (+33%; P = 0.01), but not in the siKpna1-treated cells (Supplementary material, Figure S2E). Basal glucose uptake was lower in the siKpna1-treated cells in comparison with the NC‑treated cells (P = 0.02) (Supplementary material, Figure S2F). Insulin increased glucose uptake in the siNC‑treated cells (+85%; P <0.001), but not in the siKpna1-treated cells (Supplementary material, Figure S2F). The change in glucose uptake in response to insulin was lower in the siKpna1-treated cells than in the NC‑treated cells (P = 0.001).
The effect of insulin on Akt phosphorylation (+53%; P = 0.003) (Supplementary material, Figure S2E) and glucose uptake (+64%; P <0.001) (Supplementary material, Figure S2F) was preserved in the siKpna2-treated cells.
Kpna1 and Kpna2 silencing at the stage of myotube
Kpna1 knockdown in myotubes resulted in a 61% decrease in mRNA expression and a 40% decrease in protein expression (Supplementary material, Figure S3A). Kpna2 knockdown in myotubes resulted in a 57% decrease in mRNA expression and a 55% decrease in protein expression (Supplementary material, Figure S3B).
In the myotubes with Kpna1 silencing, basal and insulin‑stimulated Akt phosphorylation (Supplementary material, Figure S3C) and glucose uptake (Supplementary material, Figure S3D) did not differ in comparison with the siNC‑treated cells.
The effect of insulin on Akt phosphorylation was comparable between the siNC‑treated myotubes and the siKpna2-treated myotubes (Supplementary material, Figure S3C).
After insulin stimulation, glucose uptake increased both in the siNC‑treated myotubes (+88%; P <0.001) and the siKpna2-treated myotubes (+101%; P <0.001) (Supplementary material, Figure S3D). In absolute values, the change in glucose uptake after glucose stimulation was higher in the siKpna2-treated myotubes than in the siNC‑treated myotubes (P = 0.03) Insulin‑stimulated glucose uptake was also higher in the siKpna2-treated myotubes than in the NC‑treated myotubes (P <0.001).
Discussion
In the present study, KPNA1 was positively related to insulin sensitivity, and this association seemed to be influenced by its effects on maintaining proper myoblast differentiation. In contrast, KPNA2 was negatively related to insulin sensitivity, and this association seemed to be independent of myogenesis.
KPNA1 expression was decreased in obesity, and was positively related to insulin sensitivity and to the expression of myogenic factors. Overweight / obese individuals were characterized by lower muscle expression of myogenic factors. Correlations of muscle KPNA1 expression with myogenic factors indicate that an impact of this karyopherin on myogenesis may influence the association between KPNA1 and insulin sensitivity. In line with this observation, Kpna1 silencing resulted in a decrease in proliferation of myoblasts in the later phase. Myotube formation in the siKpna1-treated cells was ascertained by microscope monitoring; however, lower expression of myogenin in the developed myotubes suggests impairment of differentiation. Even though insulin may stimulate myogenesis, in our study, Kpna1 silencing at the stage of myoblast resulted in a decreased insulin‑stimulated Akt phosphorylation and glucose uptake in myotubes.
Kpna1 silencing in myotubes did not exert any effect on insulin‑stimulated Akt phosphorylation and glucose uptake. These data should be interpreted together with the human results of our study, showing positive correlations between muscle KPNA1 expression and insulin sensitivity and myogenic factors and a decrease in muscle KPNA1 in obesity. Together, these results indicate that muscle nuclear import with KPNA1 regulates insulin action, and that this regulation is associated with myogenesis. We have demonstrated that muscle RUNX1 is related to myogenesis and insulin sensitivity.16 Muscle karyopherins are not related to muscle RUNX1. RUNX1 is a transcription factor, whereas karyopherins influence import of different molecules from the cytoplasm to the nucleus. In our research, we have also studied other pathogenic aspects of insulin resistance. We demonstrated relationships between genes associated with glucocorticoid action in subcutaneous adipose tissue and whole‑body insulin resistance, mainly reflecting skeletal muscle.17
A recent single study in mice suggested that muscle nuclei were not postmitotic.18 Nevertheless, the role of satellite cells in muscle regenerative potential has been documented in many studies,5-13 and may offer a potential explanation for our findings.
Muscle KPNA2 expression correlated negatively with insulin sensitivity. KPNA2 was identified as one of the genes negatively associated with improvements in insulin sensitivity in transcriptomic studies of human skeletal muscle.19 In our study, muscle KPNA2 was not related to myogenic factors. Kpna2 silencing at the stage of myoblast did not influence myoblast differentiation and insulin action in myotubes.
In contrast, we demonstrated that Kpna2 knockdown in myotubes resulted in increased cell glucose uptake, which suggests that KPNA2 inhibits glucose uptake in mature muscle. This is in agreement with the clinical part of our study showing a negative correlation between muscle KPNA2 and insulin sensitivity in humans. Our data indicate that the association between KPNA2 and insulin sensitivity is independent of myogenesis. Karyopherins regulate nuclear import of many factors and there are numerous possible mechanisms for the observed effects.
A limitation of our study is that human findings were interpreted with data from rat myoblast cell line. Rat Kpna1 and Kpna2 are orthologs of the respective human karyopherin and share with them over 92% and over 87% sequence similarity, respectively (https://www.genecards.org/).20 Furthermore, not all differences and correlations observed for KPNA1 and KPNA2 mRNA were also observed for the respective proteins. However, this is rather due to the limited number of samples for the protein measurements, since we observed an excellent correlation between muscle mRNA and protein expression for both karyopherins.
Our study shows that myogenic / regenerative potential of skeletal muscle in the adulthood may be important for maintaining insulin sensitivity. Prevention of obesity‑related sarcopenia seems to be crucial for metabolic health. Nuclear import in muscle may be a potential target for the treatment of insulin resistance‑related diseases.
Our data highlight the role of nuclear import as a modulator of insulin sensitivity, with KPNA1 influencing myogenic potential, and KPNA2 acting independently of myogenesis. These data may have potential implications for further studies of an association between sarcopenia and development of T2D.
- Fu X, Zhu M, Zhang S, et al. Obesity impairs skeletal muscle regeneration through inhibition of AMPK. Diabetes. 2016; 65: 188‑200. | Crossref
- Jun JE, Lee SE, Lee YB, et al. Low skeletal muscle mass accompanied by abdominal obesity additively increases the risk of incident type 2 diabetes. J Clin Endocrinol Metab. 2023; 108: 173‑1180. | Crossref
- Zieleniewska NA, Szum‑Jakubowska A, Chabicz M, et al. The prevalence of prediabetes and diabetes: a population‑based study. Pol Arch Intern Med. 2023; 133: 16407. | Crossref
- Almeida CF, Fernandes SA, Ribeiro Junior AF, et al. Muscle satellite cells: exploring the basic biology to rule them. Stem Cells Int. 2016; 2016: 1078686. | Crossref
- Kadi F, Thornell LE. Concomitant increases in myonuclear and satellite cell content in female trapezius muscle following strength training. Histochem Cell Biol. 2000; 113: 99‑103. | Crossref
SUPPLEMENTARY MATERIAL
ARTICLE INFORMATION