Metabolic revitalization: exploring erythrocyte fatty acid profile following laparoscopic sleeve gastrectomy
Key words: bariatric surgery, erythrocyte membranes, fatty acids, obesity

 CC BY 4.0
Metabolic revitalization: exploring erythrocyte fatty acid profile following laparoscopic sleeve gastrectomy
Introduction: Obesity is linked to metabolic disorders. Bariatric surgery offers a promising therapeutic effect in the treatment of obesity, but its impact on fatty acid (FA) profiles within erythrocytes and the associated clinical implications remain underexplored.
Objectives: This study aimed to assess changes in erythrocyte membrane FA composition after laparoscopic sleeve gastrectomy (LSG) and to correlate these alterations with clinical parameters.
Patients and methods: A total of 61 patients with morbid obesity undergoing LSG and 32 healthy controls were enrolled. Erythrocyte membrane FA composition was analyzed using gas chromatography. Clinical parameters, including body mass index (BMI), blood pressure, and multiple biochemical markers, were evaluated. In the surgical patients, the dynamics of metabolism post‑LSG was assessed by exploring the ratios of erythrocyte FA concentrations at baseline and 6 months postsurgery, with the corresponding ratios calculated for clinical parameters.
Results: Bariatric intervention resulted in reduction of median BMI (41.1 to 32 kg/m2) and median fat mass (54.1 to 35.2 kg). Other anthropometric parameters also improved significantly. Favorable changes in FA metabolism post‑LSG, potentially leading to a reduction in cardiovascular disease risk, were observed. The OMEGA‑3 Index (median, 1.8 vs 3) and the eicosapentaenoic / arachidonic FA ratio (median, 0.1 vs 0.2) increased after surgery. Linoleic acid (LA) was shown to be significantly associated with markers of obesity. The LA ratios increased along with the reduction of BMI (r = –0.32), fat mass (r = –0.39), and waist circumference (r = –0.33) proportions. A positive correlation was noted between LA concentration and excess weight loss percentage (r = 0.49), and excess BMI loss percentage (r = 0.5).
Conclusions: The study underscores distinct post‑LSG changes in erythrocyte FA profiles, potentially associated with reduced weight and BMI, improved inflammatory status, and lower cardiovascular disease risk.
What's new?
This study is the first to provide insight into the changes in fatty acid (FA) composition of erythrocyte membranes following laparoscopic sleeve gastrectomy (LSG). We showed a post‑LSG increase in the OMEGA‑3 Index and eicosapentaenoic to arachidonic FA ratio, both of which are established measures of inflammation and cardiovascular disease risk. As compared with other types of bariatric surgery, LSG may have a more positive impact on reducing these adverse conditions associated with morbid obesity. Additionally, we found several correlations between erythrocyte FAs and various clinical indicators. Notably, we observed negative associations between the postbariatric shift in linoleic acid and anthropometric parameters, such as body mass index, fat mass, and waist circumference.
Introduction
Obesity is a chronic inflammatory disease resulting from an excess of accumulated adipose tissue, one of the main centers of energy metabolism regulation.1 Chronic inflammation within visceral adipose tissue may cause insulin resistance and lipotoxicity, leading to atherosclerosis, diabetes, hyperlipidemia, heart disease, and hypertension.2 Recent reports indicate that 12.5% of the global population has a body mass index (BMI) greater than or equal to 30 kg/m2, thus marking obesity as a global pandemic.3 Among various approaches, bariatric (metabolic) surgery emerges as the most potent therapy for morbid obesity. The 2 most popular interventions of this kind include Roux‑en‑Y gastric bypass (RYGB) and laparoscopic sleeve gastrectomy (LSG).4 Beyond weight loss, surgery reduces comorbidities, augments prognosis, and enhances quality of life.5 However, the accompanying nutrient restriction, malabsorption, and hormonal alterations impact metabolism in a not yet fully explored way.6,7 While certain studies suggest that RYGB might have a greater metabolic impact, particularly concerning dyslipidemia remissions, it is also associated with more profound changes in absorption of essential vitamins, minerals, and trace elements. On the other hand, LSG is considered a safer procedure with lower postoperative complication and reoperation rates.8-11 The dynamics of metabolism in bariatric patients could be examined by analyzing changes in the fatty acid (FA) composition of cell membranes, which reflect the quality of cell functioning.12-14 To this end, analysis the erythrocyte membrane FA composition is the most straightforward option due to a relatively easy way of obtaining the biological material, and the fact that it is not influenced by short‑term dietary variations, being a robust biomarker of lipid metabolism. In addition, it was found to be closely associated with peripheral tissue FA concentrations.15,16
FAs play an indispensable role immune responses and are vital to biochemical pathways within the human body. Essential FAs, such as linoleic acid (LA) and α-linolenic acid (ALA), positively influence blood cholesterol levels, reducing coronary heart disease mortality.17-20 These n‑6 and n‑3 polyunsaturated fatty acids (PUFAs) play a pivotal role in physiological functions despite being unattainable via human cell synthesis. ALA serves as a precursor to eicosapentaenoic acid (EPA) and docosahexaenoic acid (DHA), while LA is crucial in arachidonic acid (ARA) synthesis. EPA and DHA boast anti‑inflammatory properties, while ARA contributes to cognition, immune regulation, and platelet aggregation.21-25
Previous works have also shown that bariatric surgery influences the profiles of FAs and their derivatives, which are associated with changes in the physiology and lifespan of cells.26-28 The present study aimed to explore the profiles of erythrocyte FA composition in obese individuals undergoing LSG, compare them with FA profiles assessed 6 months after surgery and those of healthy controls, and examine correlations between these profiles and clinical parameters. By identifying specific changes in FA profiles induced by LSG and examining the associations of these changes with the evolution of clinical parameters, we aim to get a deeper insight into the metabolic processes occurring after LSG, to be able to compare them with outcomes of similar investigations described for other types of bariatric surgery. The results of our study may offer new criteria for selecting the appropriate type of surgery for individual patients, and contribute to the development of more effective monitoring and treatment strategies for post‑LSG patients.
Patients and methods
Participants
We enrolled consecutive patients admitted to a surgery ward for the LSG procedure who consented to participate in the study. Eligible participants were aged 18 to 65 years and diagnosed with morbid obesity (BMI >40 kg/m2 or >35 kg/m2 with at least 1 obesity‑related comorbid condition). Recruitment spanned from December 2021 to April 2022. Exclusion criteria comprised a history of other bariatric surgery, pregnancy, and active malignancy. Medical records were utilized for patient characterization. Healthy control participants of similar age were recruited, with inclusion criteria comprising a nonobese status (BMI <30 kg/m2) and no history of smoking, current pregnancy, malignancies, or chronic diseases.
Study design
The control group underwent a single examination. The participants with obesity underwent assessments and blood sample collection twice: at baseline and 6‑months after the procedure.
Data extracted from medical records encompassed age, sex, body weight, height, BMI, and systolic and diastolic blood pressure (SBP, DBP). Waist and hip circumferences were measured by a single researcher (JB). Clinical laboratory analysis comprised complete blood count results and serum levels of laboratory parameters, including triglycerides, total cholesterol, high‑density lipoprotein cholesterol (HDL‑C), non–HDL‑C, low‑density lipoprotein cholesterol (LDL‑C), creatinine, glomerular filtration rate calculated using the Modification of Diet in Renal Disease formula, partial thromboplastin time, international normalized ratio (INR), albumin, total protein, alanine aminotransferase (ALT), alkaline phosphatase, γ-glutamyl transferase, bilirubin, glucose, glycated hemoglobin A1c (HbA1c), iron, ferritin, potassium, and sodium. The LDL‑C level was calculated using the Friedewald formula. Additional data on fat mass (FM), fat‑free mass (FFM), and visceral fat rating (VFR) were obtained via bioelectrical impedance body composition analysis (Tanita Body Composition Analyzer / DC430‑MA (Tanita Corp., Tokyo, Japan), which was performed in the controls and in the follow‑up subgroup. Baseline patient data were retrieved from records collected at the latest preoperative dietitian consultation.
To establish the effects of bariatric intervention on anthropometric parameters, the following factors were calculated according to the formulas presented below: total weight loss percentage (TWL%), excess weight loss percentage (EWL%), and excess BMI loss percentage (EBMIL%).
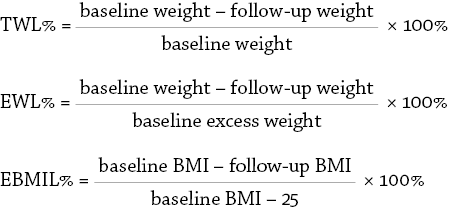
Excess weight was defined as the number of kilograms that contributed to surpassing BMI of 22 kg/m2.
Finally, we analyzed the erythrocyte membrane FA composition of participants using gas chromatography as described below.
The study adhered to the ethical principles of the 1975 Declaration of Helsinki and was approved by the Jagiellonian University Ethics Committee (1072.6120.246.2019). Informed consent was obtained from all study participants.
Laboratory analyses
All tests and laboratory analyses were carried out on venous blood samples drawn after at least 8 hours of fasting. Clinical laboratory analyses were performed at the hospital laboratory. FA composition of the erythrocyte membranes was determined by gas‑liquid chromatography. First, centrifugation was performed to separate erythrocytes from plasma (2880 × g for 10 min). The erythrocytes were washed with phosphate‑buffered saline. Hemoglobin‑free erythrocyte membranes were prepared by hypotonic hemolysis at 4 °C in 10 mM Tris buffer with pH of 7.4. The membranes were then isolated by centrifugation (10 000 × g for 15 min) and washed several times to eliminate Hb residues according to the method proposed by Graham.29 Total lipid extraction from the erythrocyte membranes was carried out with a solution of chloroform / methanol (2:1) (Sigma‑Aldrich, St. Louis, Missouri, United States). The synthesis of FA methyl esters was carried out with a 14% boron trifluoride‑methanol complex solution (Sigma‑Aldrich). The FA methyl esters were analyzed using gas chromatography (Agilent 6890N, Agilent, Santa Clara, California, United States). Chromatograph parameters were flame‑ionization detector, 260 °C; oven‑start at 140 °C and ramp up to 240 °C; column DB‑23 (60 m; 0.25 m, Agilent J&W); inlet temperature, 250 °C; split, 40:1; injection, 1 µl. FA methyl esters were identified according to standards (Supelco, Sigma‑Aldrich). The data were analyzed using ChemStation software (Agilent).
Results were expressed as relative percentages of FAs, as well as the sum of saturated (SFA), monounsaturated (MUFA), n‑3, and n‑6 FAs.
Statistical analysis
STATISTICA version 13 software (TIBCO Software Inc., Palo Alto, California, United States) was used for statistical analysis. Continuous data were presented as mean (SD) or median (interquartile range [IQR]), and qualitative data as numbers and percentages. The χ2 test and Yates test were used to compare qualitative data. The t test (for data with normal distribution) and the Mann–Whitney or Wilcoxon test (respectively for independent and dependent variables with distribution other than normal) were used for quantitative data. We checked for correlations of variables using the Spearman test. Continuous variables were first checked for normality of distribution with the Shapiro–Wilk test. For all tests, a P value below 0.05 was considered significant.
Results
We enrolled 61 patients with morbid obesity, including 41 women (67.2%), at a median (IQR) age of 41 (31–48.5) years. Forty‑three individuals (70.5%) underwent follow‑up assessments. The sex (n = 26; 60.5% women) and age distributions did not change significantly due to loss to follow‑up. The control group comprised 32 healthy individuals at a median (IQR) age of 39 (35.5–48) years. The sex distribution in the control group (men, 34.4%; women, 65.6%) was similar to that in the study group at baseline, and it also turned out to be satisfactorily comparable with the follow‑up group.
The parameters characterizing the control group, used for comparisons with baseline and follow‑up patients, were assessed only once.
General clinical and laboratory parameters
In the group of patients with obesity, the median (IQR) BMI at baseline was 41.1 (38.8–46.7) kg/m2, and its value decreased significantly to 31.2 (28.7–36) kg/m2 postsurgery. Mean (SD) TWL% reached 22.2% (5.3%), EWL%, 47.4% (13.6%), and median (IQR) EBMIL%, 58.6% (39.6%–73.6%). Notably, the control group showed the lowest median (IQR) BMI (23.2 [20.7–25] kg/m2). This consistent downward trend extended to various anthropometric and body composition parameters, such as hip circumference (baseline, 133 cm vs follow‑up, 109 cm vs control, 96.5 cm), FM (baseline, 54.1 kg vs follow‑up, 35.2 kg vs control, 14.2 kg), and VFR (baseline, 14 vs follow‑up, 11 vs control, 4) (all P <0.05).
The bariatric procedure notably succeeded in reducing blood pressure (both SBP and DBP). No statistical disparity was observed between the control and follow‑up subgroups.
Additionally, the surgery markedly influenced numerous laboratory parameters. Red cell distribution width–coefficient of variation was significantly lower in healthy individuals than in the study patients (both at baseline and at follow‑up). Furthermore, the study patients exhibited slightly higher platelet counts at baseline, as compared with healthy individuals and the follow‑up subgroup. In turn, the differences were minimal across all 3 groups for mean corpuscular volume and mean corpuscular Hb. However, in both cases, the erythrocyte volume and Hb mass in the baseline subgroup were significantly lower than in the follow‑up subgroup and the control group.
Biochemical analysis revealed significant disparities between the control group and patients with morbid obesity. In comparison with the controls, the study patients exhibited lower levels of total protein, albumin, total cholesterol, LDL‑C, and iron. Conversely, healthy individuals had lower concentrations of ALT, triglycerides, HbA1c, and ferritin.
Significant biochemical alterations were observed 6 months after bariatric surgery in the serum profiles of the participants, as compared with baseline measurements. Notably, both total protein and albumin levels increased during follow‑up. Similar trends were noted for total cholesterol, LDL‑C, and iron levels. Conversely, some parameters exhibited a decrease, including ALT, triglycerides, HbA1c, and ferritin.
A comprehensive overview and detailed description of basic clinical and laboratory parameters are presented in Tables 1 and 2.
Parameter | Control group | Baseline group | Follow‑up group |
Categorical data are presented as number (percentage) and continuous variables are presented as mean (SD) if distributed normally, otherwise as median (interquartile range).
Comparisons between groups were made as follows: 1) the control and baseline groups were compared using the Mann–Whitney test / t test for independent (unpaired) variables, involving patients from the control group and all available patients from the baseline group (including those who were subsequently lost to follow‑up); 2) the baseline and follow‑up groups were compared using the Wilcoxon test / t test for dependent (paired) variables, analyzing pairs of parameter values (baseline and follow‑up) (only the baseline patients that were not lost to follow‑up were included); 3) the control and follow‑up groups were compared using the Mann–Whitney test / t test for independent (unpaired) variables.
a Significant difference between control and baseline groups (P <0.001)
b Significant difference between baseline and follow‑up groups (P <0.05 and ≥0.001)
c Significant difference between baseline and follow‑up groups (P <0.001)
d Significant difference between control and follow‑up groups (P <0.05 and ≥0.001)
e Significant difference between control and follow‑up groups (P <0.001)
Abbreviations: BMI, body mass index; DBP, diastolic blood pressure; FM, fat mass; FFM, fat‑free mass; MM, muscular mass; SBP, systolic blood pressure; TBW, total body water; VFR, visceral fat rating; WHR, waist / hip ratio | |||
Weight, kg | 66.65 (59.48–75.2)a,e | 120 (105–140)a,c | 95.8 (79.1–113)a,e |
BMI, kg/m2 | 23.2 (20.68–25.03)a,e | 41.05 (38.75–46.68)a,c | 31.19 (28.71–36.03)c,e |
FM, kg | 14.15 (10.5–18.95)a,e | 54.1 (45.1–60.2)a,c | 35.2 (28.8–44.3)c,e |
FFM, kg | 49.7 (45.2–57.75)a,d | 60.2 (54.4–70.2)a,c | 56.9 (49.5–74.8)c,d |
MM, kg | 47.2 (43.55–54.85)a,d | 57.2 (52.8–66.7)a,c | 54 (47–71.1)c,d |
TBW, kg | 34.7 (31.2–40.3)a,e | 44.3 (40.3–50.5)a,c | 40.7 (35.3–53.7)c,e |
VFR | 4 (3–5)a,e | 14 (13–19)a,c | 11 (9–14)c,e |
Waist, cm | 81 (71.5–86)a,e | 117 (109.5–132.5)a,c | 97 (89–108.5)c,e |
Hip, cm | 96.5 (91.5–102.5)a,e | 133 (121.5–141)a,c | 109 (104–119)c,e |
WHR | 0.82 (0.06)a,e | 0.91 (0.11)a,b | 0.89 (0.07)b,e |
SBP, mm Hg | 123 (116–133)a | 146 (135–154)a,c | 130 (121.5–136.5)c |
DBP, mm Hg | 78 (71.5–86.5)a | 90 (81–95)a,b | 84 (77–89.5)b |
Parameter | Control group | Baseline group | Follow‑up group |
Variables are presented as mean (SD) if distributed normally, otherwise as median (interquartile range). For details regarding intergroup comparisons, see Table 1.
SI conversion factors: to convert creatinine clearance to ml/s, multiply by 0.0167; ALP, ALT, and GGT to μkat/l, by 0.0167; hemoglobin and MCHC to g/l, by 10; iron to μmol/l, by 0.179.
a Significant difference between control and baseline groups (P <0.001)
b Significant difference between baseline and follow‑up groups (P <0.001)
c Significant difference between control and follow‑up groups (P <0.001)
Abbreviations: ALP, alkaline phosphatase; ALT, alanine transaminase; APTT, activated partial thromboplastin time; GGT, γ-glutamyltransferase; GFR MDRD, glomerular filtration rate calculated using Modified Diet in Renal Disease formula; HBA1c, glycated hemoglobin; HDL‑C, high‑density lipoprotein cholesterol; INR, international normalized ratio; LDL‑C, low‑density lipoprotein cholesterol; MCH, mean corpuscular hemoglobin; MCHC, mean corpuscular hemoglobin concentration; MCV, mean corpuscular volume; PDW, platelet distribution width; RDW‑CV, red blood cell distribution width; TC, total cholesterol; TG, triglycerides | |||
Leukocytes, 103/μl | 5.16 (4.45–5.88)a,c | 9.94 (7.49–12.44)a,b | 6.6 (5.83–7.58)b,c |
Erythrocytes, 106/μl | 4.6 (0.46) | 4.59 (0.45) | 4.67 (0.38) |
Hemoglobin, g/dl | 13.94 (1.56) | 13.58 (1.28)b | 14.1 (1.06)b |
Hematocrit, % | 40.24 (3.79) | 39.52 (3.4)b | 40.99 (3.01)b |
MCV, fl | 87.54 (3.03) | 86.26 (3.89)b | 87.86 (3.18)b |
MCH, pg/cell | 31 (29.1–31.4)a | 29.5 (28.65–30.8)a,b | 29.9 (29.3–31.1)b |
MCHC, g/dl | 34.65 (34.05–35.35) | 34.25 (33.65–34.9) | 34.2 (33.7–35.1) |
RDW‑CV, % | 12.3 (11.95–13.1)a,c | 13.2 (12.7–13.7)a | 13.2 (12.8–13.8)c |
Platelets, 103/μl | 242 (210–271.5)a | 270 (226–306.5)a,b | 248 (220–295)b |
PDW, fl | 12.1 (11.1–13.55) | 12.4 (11.2–13.55)b | 13.1 (11.8–14.1)b |
APTT, s | 29.2 (27.8–31.1) | 28.15 (25.9–30.55)b | 29.4 (27–31.2)b |
INR | 0.97 (0.91–1.03) | 0.96 (0.92–1) | 0.97 (0.92–1.03) |
Albumin, g/l | 45.94 (2.64)a | 41.45 (3.18)a,b | 45.02 (2.66)b |
Total protein, g/l | 70.87 (3.52)a | 66.18 (5.44)a,b | 69.50 (3.81)a |
ALT, U/l | 21 (17–29)a | 49.5 (36–77)a | 20 (16–26) |
Total bilirubin total, μmol/l | 9.47 (5.76–12.95) | 8.16 (6.4–10.1) | 9.91 (6.85–13) |
ALP, U/l | 58 (51–71)c | 69 (56–78) | 72 (56–85)c |
GGT, U/l | 16 (12–24)a | 25.5 (18–44)a,b | 20 (12–27)b |
TG, mmol/l | 0.95 (0.73–1.32)a,c | 1.31 (0.95–1.75)a,b | 1.19 (0.94–1.52)b,c |
TC, mmol/l | 4.97 (0.78)a | 4.29 (0.74)a,b | 4.92 (0.87)b |
HDL‑C, mmol/l | 1.55 (1.35–1.82)a | 1.11 (1.01–1.28)a,b | 1.47 (1.29–1.63)b |
Non–HDL‑C, mmol/l | 3.37 (0.82) | 3.14 (0.76) | 3.44 (0.79) |
LDL‑C, mmol/l | 2.86 (0.7)a,c | 2.47 (0.73)a,b | 3.2 (0.77)b,c |
Glucose, mmol/l | 4.9 (4.54–5.02)a | 5.56 (5.13–6.58)a,b | 4.94 (4.74–5.29)b |
HbA1c, % | 5.3 (5–5.55)a,c | 5.7 (5.5–6.3)a,b | 5.5 (5.3–5.7)b,c |
Creatinine, μmol/l | 86.25 (78.9–90)a,c | 71 (62.4–77.75)a,b | 65.8 (60.9–72.6)b,c |
GFR MDRD, ml/min/1.73 m2 | 93.39 (83.44–101.08) | 95.46 (78.66–108.41)b | 100.17 (85.13–120.16)b |
Urea, mmol/l | 4.52 (3.67–5.1) | 4.32 (3.64–5.4) | 4.58 (3.64–5.79) |
Potassium, mmol/l | 4.12 (0.23)a,c | 4.26 (0.36)a,b | 4.46 (0.38)b,c |
Sodium, mmol/l | 140 (139–141)a,c | 139 (137–139.5)a,b | 141 (140–142)b,c |
Iron, μg/dl | 15.85 (9.79–22.65)a | 10.7 (7.46–13.2)a,b | 16.7 (12.2–20.5)b |
Ferritin, μg/l | 34 (18–93.5)a,c | 119 (65–203)a,b | 110 (38–193)b,c |
Erythrocyte membrane fatty acid profile
Healthy individuals predominantly displayed membranes composed of oleic (16.9%), stearic (12.4%), and palmitic (12.3%) acids. While these compounds were also prominent in the erythrocytes of the study patients, their proportions varied notably. In the patients with morbid obesity, the erythrocyte membrane FA profile comprised palmitic acid in nearly 30% (a significantly higher value than in the controls [12.3%]), but in follow‑up, the amount of palmitic acid decreased to 20.8% (both P <0.05). An inverse trend was observed for oleic and stearic FAs. At baseline, the study patients exhibited lower quantities of these compounds than the controls (12.6% vs 18.2% and 10.6% vs 12.9%, respectively). However, only the difference in oleic acid was significant. In the follow‑up subgroup, the levels of oleic (14.6%) and stearic (11.6%) FAs displayed a increasing tendency, as compared with baseline values.
The levels of EPA (3%) and DHA (2.7%) were notably higher in the controls than in the baseline subgroup (1.2% and 0.6%, respectively; both P <0.05), while an increase in EPA (up to 1.8%; P = 0.002) and no change in DHA (0.6%) were observed 6 months after surgery. The ARA content was the highest in healthy individuals (10.8%), lower in the baseline subgroup (9.3%), and the lowest in the follow‑up subgroup (8.1%; both P <0.05). There were no differences in LA levels between the study and control groups; however, the amount of ALA was the lowest in the healthy individuals, as compared with both the baseline and follow‑up subgroups (0.2% vs 1.6% and 1.3%, respectively; both P <0.05). Further details are presented in Table 3.
Fatty acid percentage | Control group | Baseline group | Follow‑up group |
Variables are presented as mean (SD) if distributed normally, otherwise as median (interquartile range.) For details regarding intergroup comparisons, see Table 1.
a Significant difference between control and baseline groups (P <0.05 and ≥0.001)
b Significant difference between control and baseline groups (P <0.001)
c Significant difference between baseline and follow‑up groups (P <0.05 and ≥0.001)
d Significant difference between baseline and follow‑up groups (P <0.001)
e Significant difference between control and follow‑up groups (P <0.05 and ≥0.001)
f Significant difference between control and follow‑up groups (P <0.001)
Abbreviations: ARA, arachidonic acid; ALA, α-linolenic acid; DHA, docosahexaenoic acid; EPA, eicosapentaenoic acid; γ-LA, γ-linoleic acid; LA, linoleic acid; FA, fatty acids; MUFA, monounsaturated fatty acids; PUFA, polyunsaturated fatty acids; SFA, saturated fatty acids | |||
C14:0, myristic acid | 1.6 (0.77–2.15)a,f | 2.26 (1.66–4)a,c | 3.99 (2.23–5.5)c,f |
C16:0, palmitic acid | 12.26 (9.63–15.67)b,f | 29.05 (26.15–34.85)b,c | 20.81 (18.03–34.8)c,f |
C18:0, stearic acid | 12.37 (9.63–14.1) | 10.38 (9.35–12.54) | 11.61 (8.93–14.31) |
C20:0, arachidic acid | 0.23 (0.15–0.39)b | 0.86 (0.45–1.3)b,d | 0.17 (0.11–0.45)d |
C22:0, behenic acid | 1.90 (1.74–2.14)b | 0.74 (0.43–1.06)b | 0.62 (0.32–4.49) |
SFA | 26.84 (6.07)b,f | 44.86 (7.08)b | 42.87 (9.79)f |
C14:1n‑5, myristoleic acid | 2.04 (1.39–2.74)f | 2.2 (1.66–3.14)d | 3.51 (2.09–5.23)d,f |
C16:1, palmitoleic acid | 1.69 (0.89–2.09)b | 4.09 (3.04–5.27)b,d | 1.98 (1.4–3.19)d |
C18:1, oleic acid | 16.89 (15.12–20.06)b,e | 11.08 (9.8–14.33)b | 15.5 (9.52–19.03)e |
C22:1n‑9, erucic acid | 3.16 (1.55–9.03)b,f | 0.72 (0.24–1.54)b | 1.29 (0.61–1.54)f |
MUFA | 24.66 (4.75)b | 20.16 (4.84)b | 22.18 (7.38) |
C18:1t, elaidic acid | 2.22 (1.57–4.18)b,e | 0.41 (0.16–1.47)b,c | 1.47 (0.43–2.35)c,e |
C18:2n6t, linolelaidic acid | 1.48 (1.11–2.13)b | 0.66 (0.39–1.02)b,c | 1.17 (0.76–1.78)c |
Trans‑FA | 3.46 (2.62–4.86)b,e | 1.1 (0.59–1.9)b,c | 2.54 (0.83–4)c,e |
C18:2n‑6, LA | 6.10 (2.59) | 7.06 (3.2) | 7.04 (2.75) |
C18:3n‑6, γ-LA | 2.69 (1.57–7.59)f | 3.04 (2.05–5.52)d | 1.07 (0.72–2.47)d,f |
C20:2n‑6, cis‑11,14‑eicosadienoic acid | 2.96 (1.94–3.42)a,f | 1.16 (0.41–2.39)a | 0.79 (0.48–1.66)f |
C20:3n‑6, cis‑8,11,14‑eicosatrienoic acid | 1.45 (0.81–2.76)e | 1.08 (0.28–2.36) | 0.8 (0.47–1.54)e |
C20:4n‑6, ARA | 10.8 (9.11–13.37)f | 9.27 (6.3–12.85)c | 8.14 (4.28–9.89)c,f |
C22:2n‑6, cis‑13,16‑docosadienoic acid | 2.71 (1.08–9.27)a,e | 1.12 (0.3–1.86)a | 0.42 (0.1–1.05)e |
C22:4n‑6, adrenic acid | 5.68 (2.75–9.53)b,f | 0.3 (0.11–0.53)b,c | 0.93 (0.28–2.86)c,f |
n‑6 PUFA | 32.35 (8.45)b,f | 26.11 (6.42)b,d | 20.53 (5.59)d,f |
C18:3n‑3, ALA | 0.19 (0.12–0.57)b,f | 1.55 (0.82–3.34)b | 1.31 (0.87–2.13)f |
C20:3n‑3, cis‑11,14,17‑eicosatrienoic acid | 1.81 (0.9–3.38) | 1.92 (0.95–2.86) | 1.33 (0.63–2.24) |
C20:5n‑3, EPA | 3.04 (1.91–5.36)b,e | 1.21 (0.59–1.95)b,c | 1.75 (1.01–3.39)c,e |
C22:6n‑3, DHA | 2.67 (1.14–5.08)b,f | 0.56 (0.23–1.11)b | 0.63 (0.29–1.21)f |
n‑3 PUFA | 8.31 (5.67–13.3)b,e | 5.23 (3.46–7.81)b | 6.38 (3.36–9.76)e |
n‑3 / n‑6 | 0.24 (0.16–0.39) | 0.18 (0.14–0.34) | 0.27 (0.17–0.45) |
OMEGA‑3 index | 6.01 (4.75–8.81)b,f | 1.74 (0.82–2.72)b,c | 2.95 (1.73–4.55)c,f |
EPA / ARA | 0.27 (0.12–0.49)b | 0.11 (0.05–0.2)b,c | 0.21 (0.13–0.47)c |
LA / γ-LA | 2.27 (0.81–3.49)f | 2.51 (1.43–4.08)c | 5.13 (2.75–11.95)c,f |
We observed a significant difference in the ratios of saturated to unsaturated FAs in the study population. In the healthy individuals, the erythrocyte membranes were predominantly composed of unsaturated FAs (71.2%). Conversely, the erythrocyte membranes of the study patients showed much lower percentages unsaturated FAs (55.1% and 57.1%, respectively, at the baseline and follow‑up). Similar trends were observed for both n‑3, and n‑6 FAs, with respective median values of 8.3% and 32.4% in the healthy individuals, 5.2% and 26.1% in the baseline subgroup, and 6.4% and 20.5% in the follow‑up subgroup (all P <0.05).
The concentration of MUFAs was the highest in the control group (24.7%). The study patients at baseline exhibited a notably lower percentage of these compounds (20.2%; P <0.001). While there was a slight increase 6 months postsurgery (22.2%), this change did not reach statistical significance.
Another crucial parameter reflecting FA metabolism is the OMEGA‑3 Index, that is, the sum of DHA and EPA levels. In the healthy individuals, this parameter yielded a value of 6%; however, in the baseline subgroup, it was notably lower at 1.7%. Six months after surgery, this index significantly increased up to approximately 3%, moving toward the levels observed in the control group. Moreover, the EPA to ARA ratio exhibited an analogous trend, with the lowest proportion observed in the baseline subgroup (0.1), followed by significantly higher values in both the healthy participants (0.3) and the follow‑up subgroup (0.2). To establish the FA ∆6‑desaturase index, we computed the ratio of LA to γ-LA. The median (IQR) value of this ratio was the lowest among the healthy controls (2.27 [0.81–3.49]), slightly but not significantly higher in the baseline subgroup (2.51 [1.43–4.08]), and notably elevated in the follow‑up group (5.13 [2.75–11.95]; P <0.05).
Correlations between erythrocyte membrane fatty acid composition and clinical parameters
Analysis of the correlation matrices (Figures 1, 2, 3) for the erythrocyte membrane FA profile and various clinical parameters revealed several notable findings in all 3 groups.
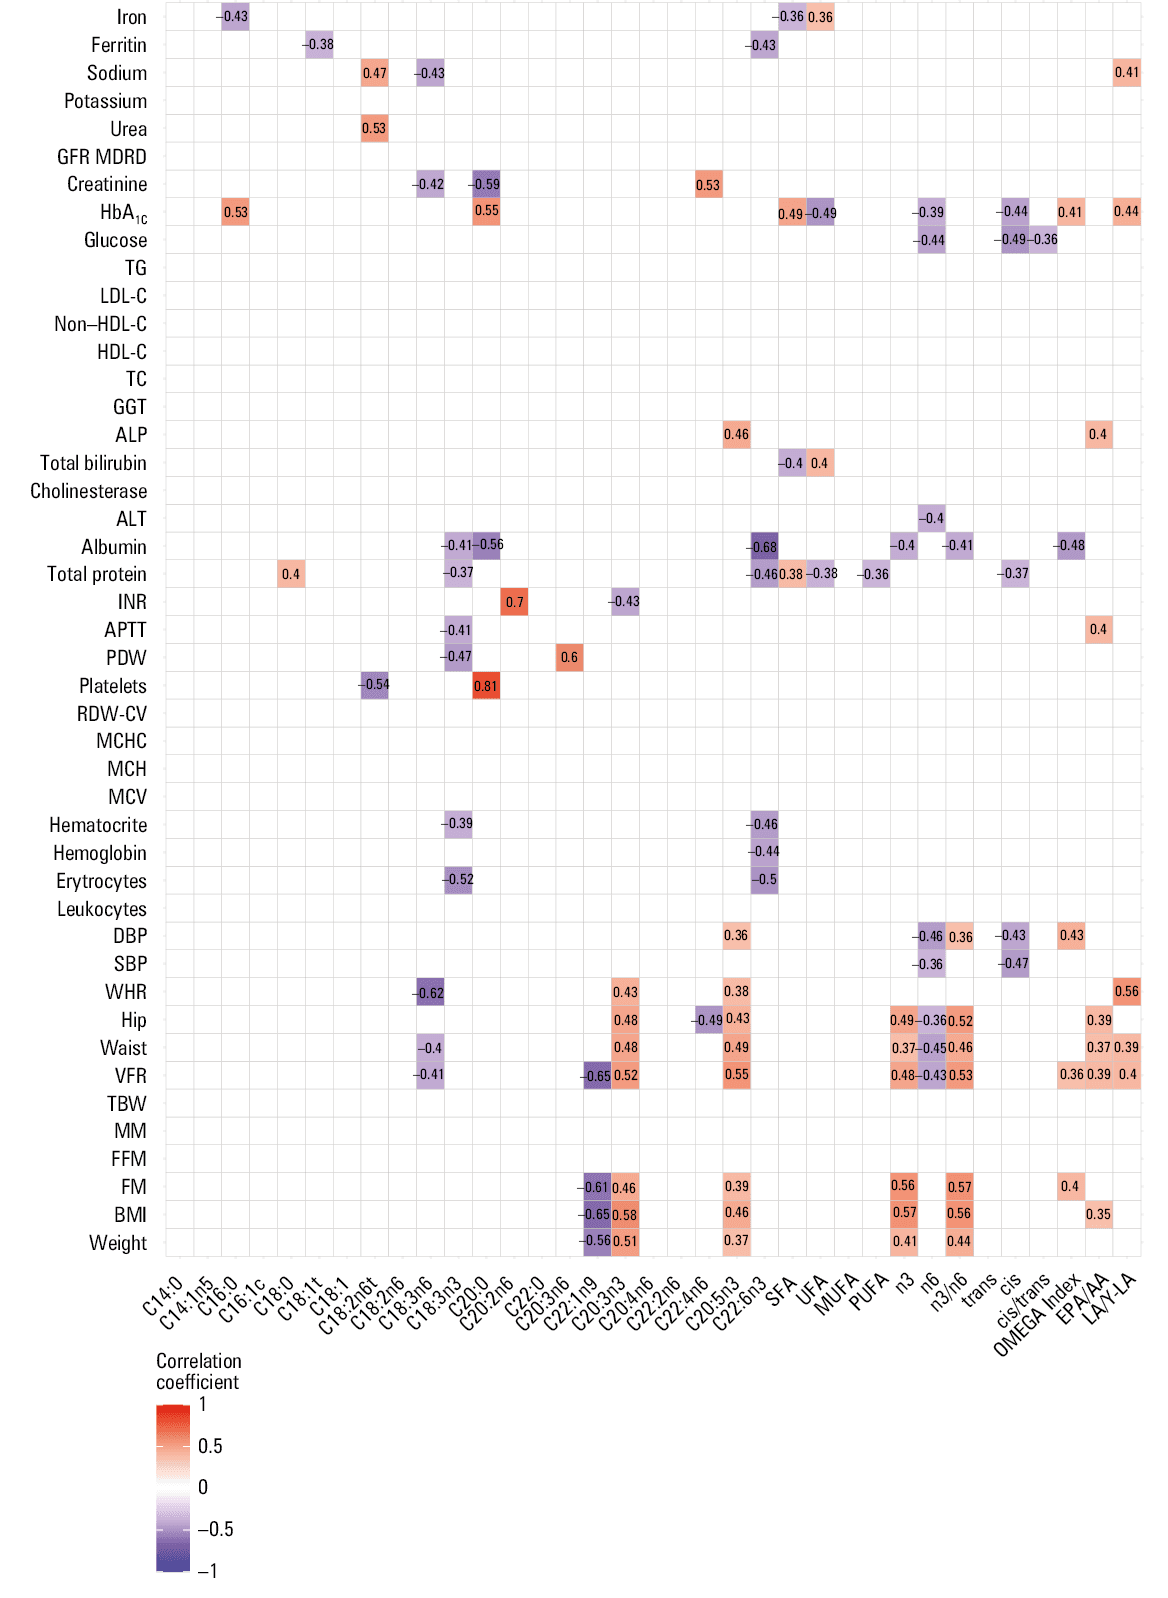
Abbreviations: UFA, unsaturated fatty acids; others, see Tables 1, 2, 3
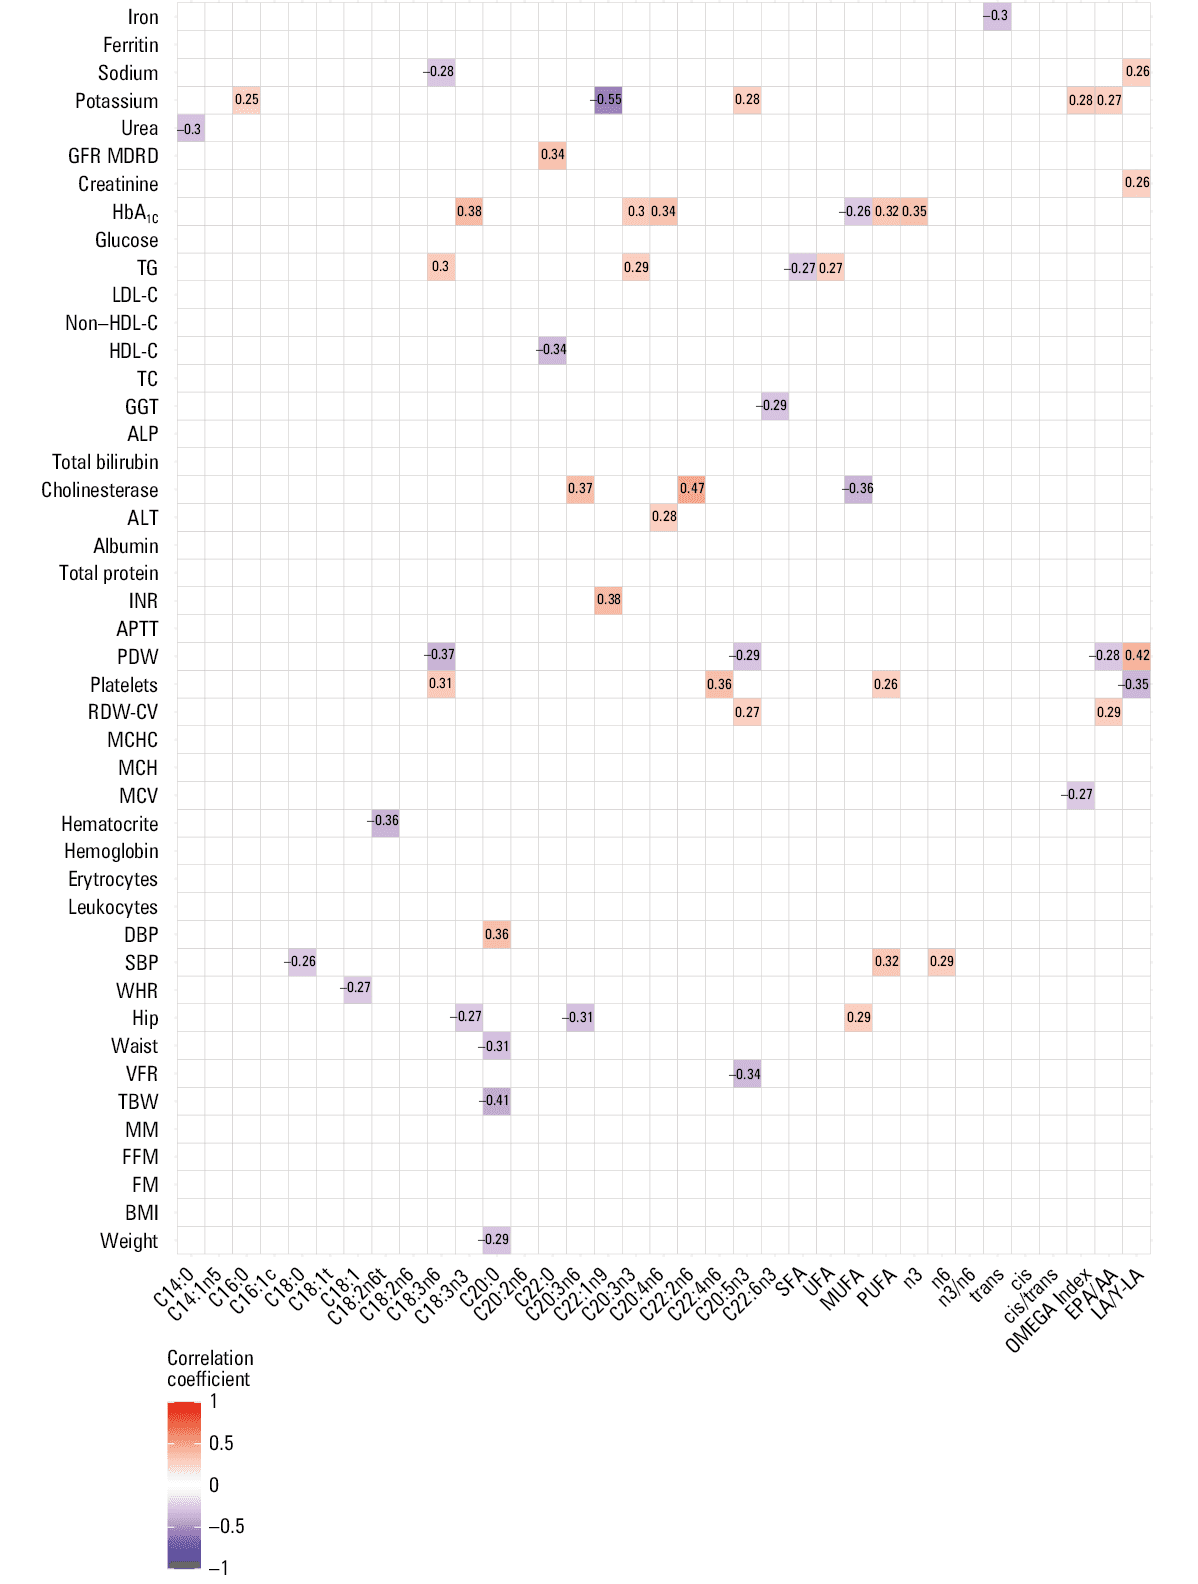
Abbreviations: see Figure 1
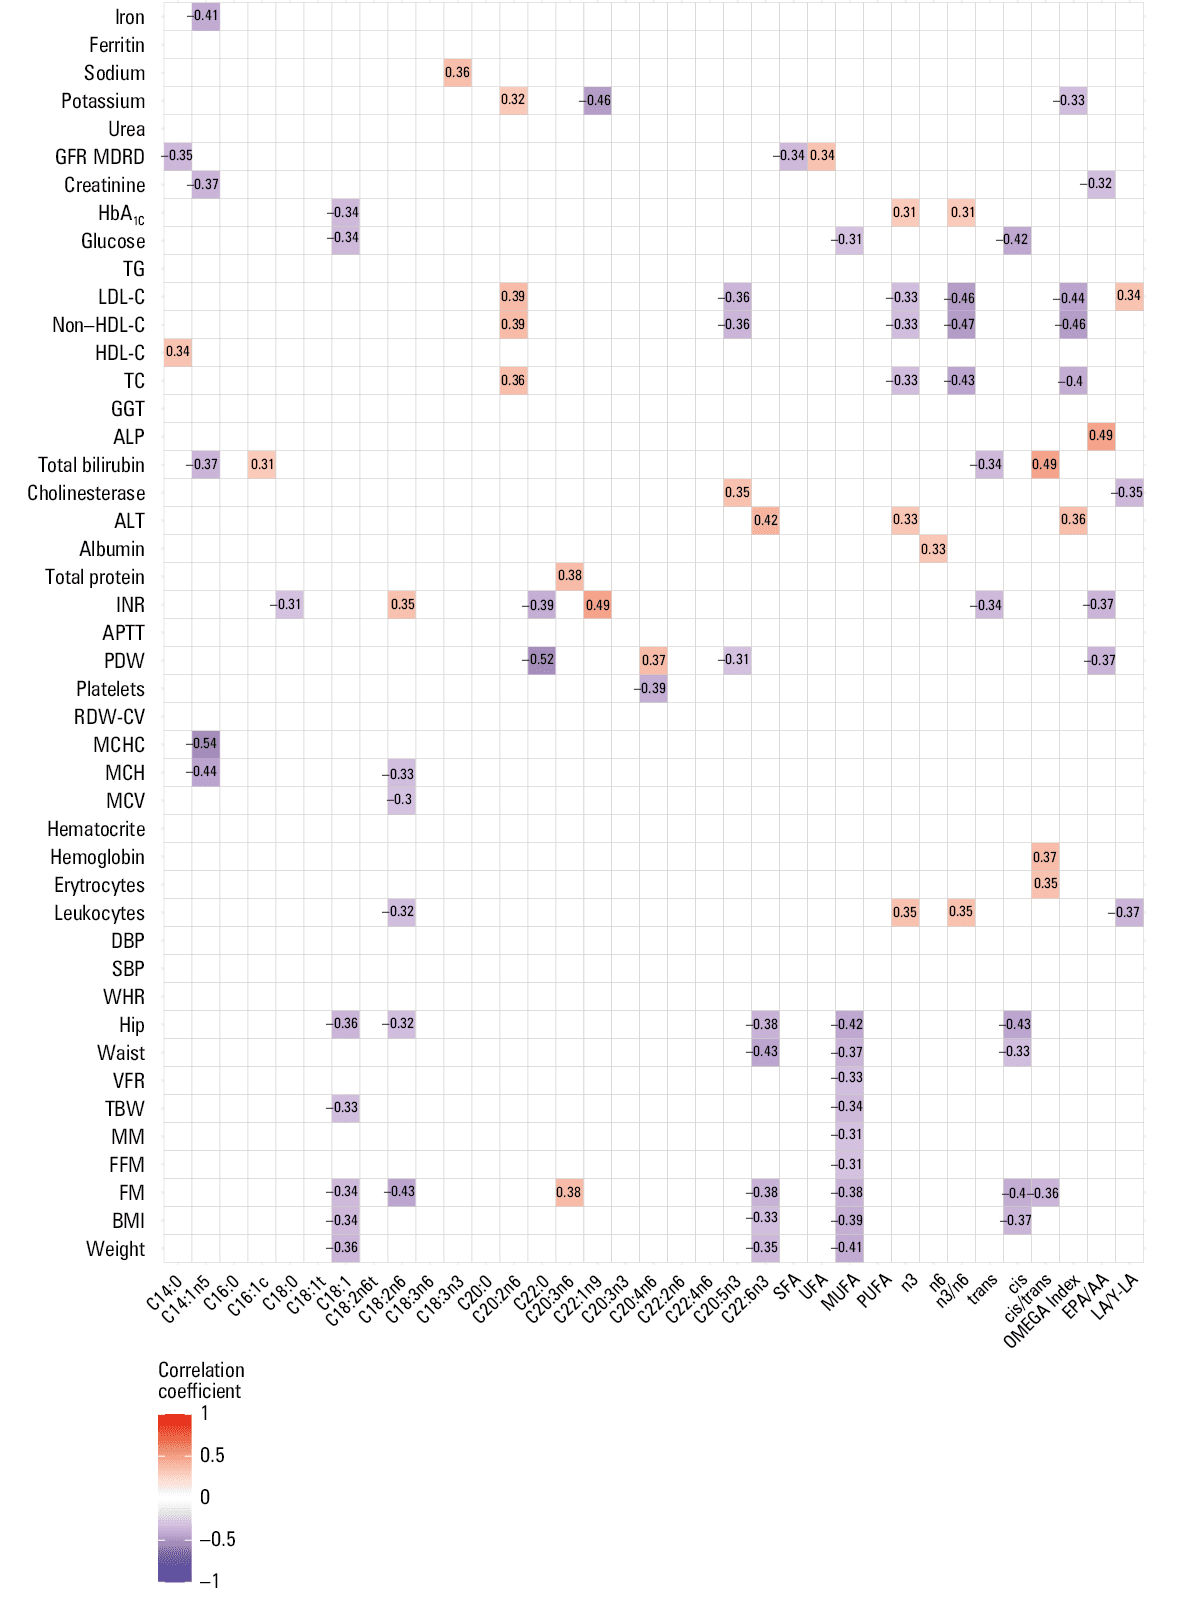
Abbreviations: see Figure 1
In the healthy individuals, the most potent positive correlations were noted between platelet count and arachidic acid (C20:0; r = 0.81), along with INR and cis‑11,14‑eicosadienoic acid (C20:2n‑6; r = 0.7). The strongest negative correlation was observed between albumin level and DHA (C22:6n3; r = –0.68). In turn, Cis‑11,14,17‑eicosatrienoic acid (C20:3n‑3) correlated considerably with several anthropometric parameters: BMI (r = 0.58), FM (r = 0.46), VFR (r = 0.52), as well as hip and waist circumferences (both r = 0.48). We noted similar trends in EPA (C20:5n3) for BMI (r = 0.46), VFR (r = 0.55), and waist and hip circumferences (r = 0.49 and r = 0.43, respectively). EPA also correlated positively with DBP (r = 0.36). In contrast, erucic acid (C22:1n‑9) had similar, yet reverse, relations with BMI (r = –0.65), FM (r = –0.61), and VFR (r = –0.65). Moreover, we found comparable relations of γ-LA (C18:3n6) with VFR (r = –0.41) and WHR (r = –0.62).
With respect to the baseline subgroup, neither a high number of significant correlations between FA levels and clinical parameters nor high values of coefficients of these correlations were observed in these patients, as compared with the controls. The strongest positive correlation was noted between cis‑13,16‑docosadienoic acid (C22:2n‑6) and cholinesterase level (r = 0.47). For EPA vs VFR, the correlation coefficient was –0.34, which strongly contrasts with the control group, where this relationship was stronger, yet positive (r = 0.55).
In the healthy individuals, we did not note any significant correlations between C20:2n‑6, C20:3n‑3, or C22:1n‑9 and adipose tissue–related anthropometric parameters. Analogously, there were no significant correlations between levels of the FAs mentioned above and biochemical parameters in the baseline and control groups.
In the follow‑up subgroup, the strength and number of correlations were generally somewhere between the values observed in the control and baseline groups. Oleic acid (C18:1) negatively correlated with FM and BMI (both r = –0.34). Similarly, LA (C18:2n‑6) exhibited reverse linear relations with FM (r = –0.43). All these correlations were significant.
To adjust for individual characteristics that may influence the relationship between variables and capture the effect of an intervention we also established follow‑up to baseline ratios of each FA and clinical / laboratory parameter. Then, these proportions were correlated, as described in the Statistical analysis section. All noted and significant correlations are presented in Figure 4.
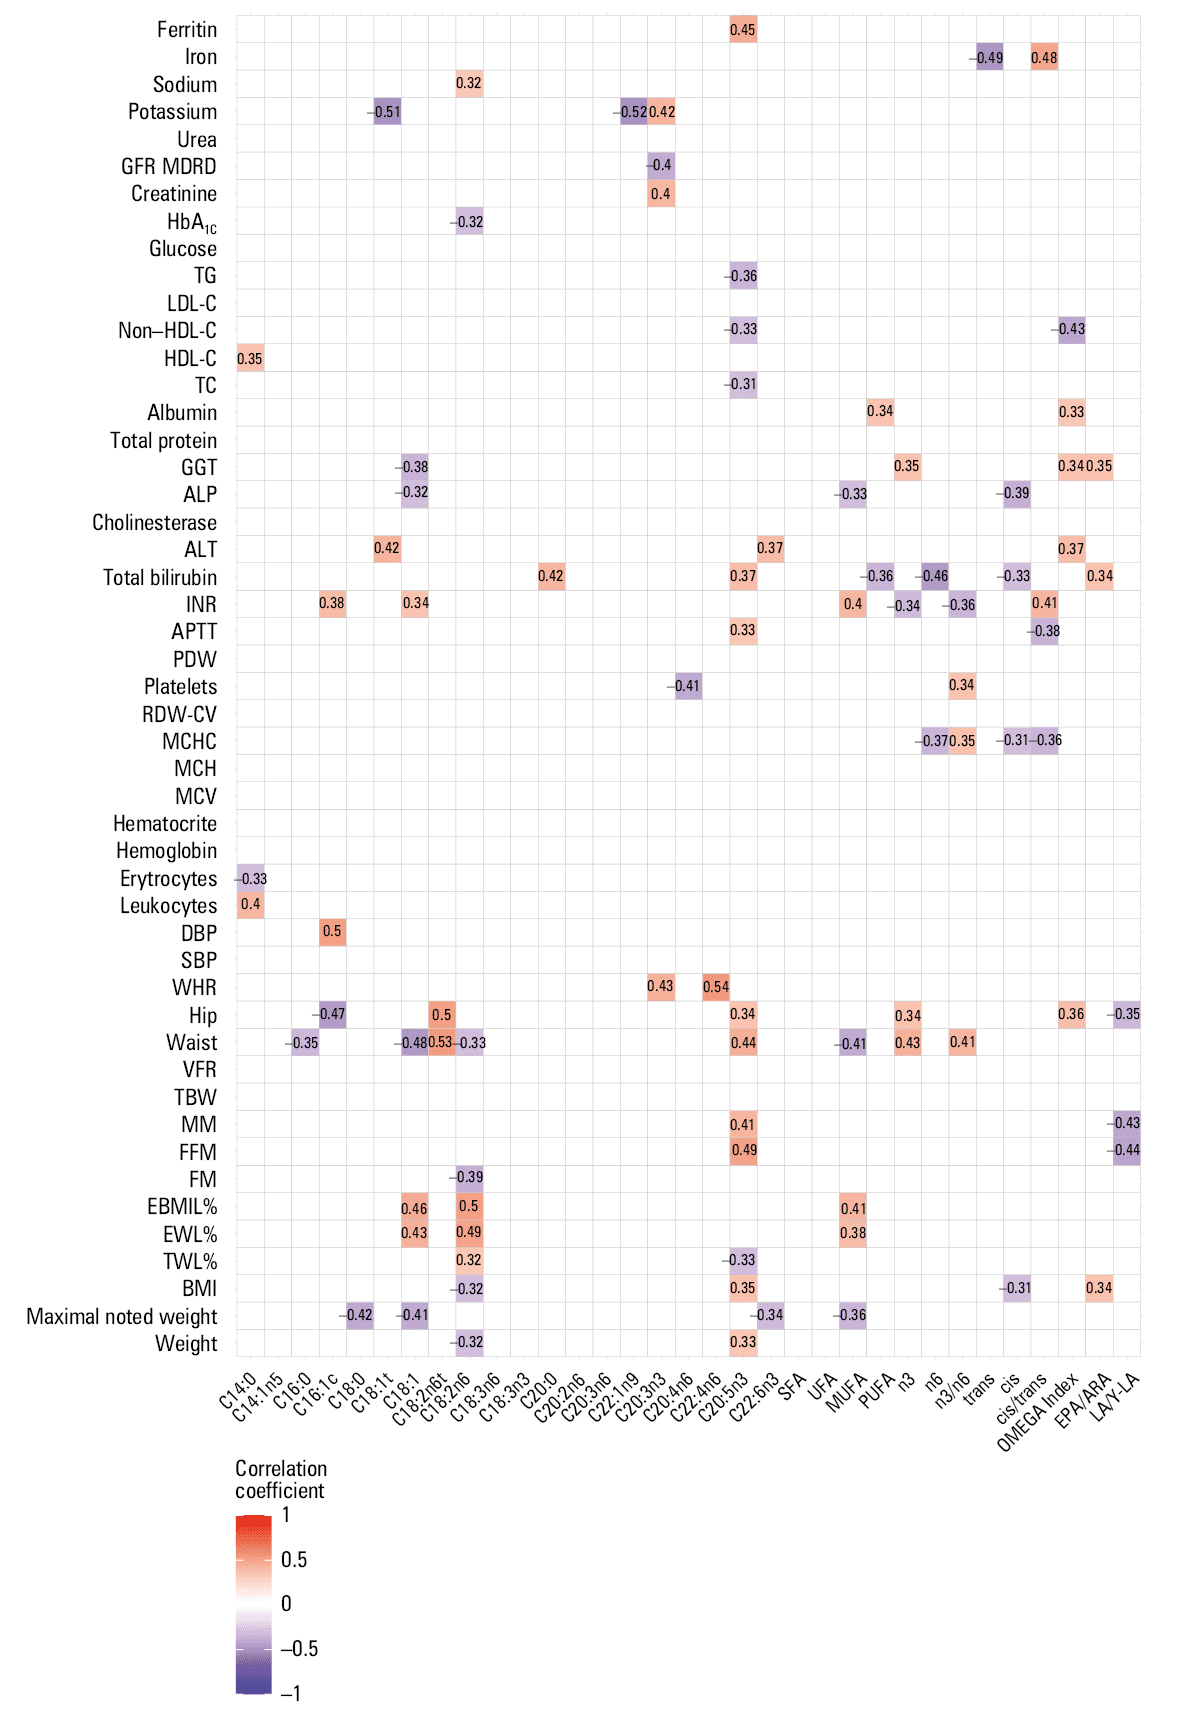
Abbreviations: see Figure 1
The strongest positive correlation was observed between WHR and adrenic acid (C22:4n6) ratios (r = 0.54). On the contrary, the strongest negative correlation was noted between erucic FA (C22:1n9) and potassium (r = –0.52) ratios. LA (C18:2n6) ratios increased along with the reduction of BMI (r = –0.32), weight (r = –0.32), FM (r = –0.39), and waist circumference (r = –0.33) proportions. Opposite correlations were observed between LA and TWL% (r = 0.32), EWL% (r = 0.49), and EBMIL% (r = 0.5). Similar trends were noted for oleic acid (C18:1), whose ratio increased along with the decrease in maximal noted weight (r = –0.41) and waist circumference (r = –0.48) proportions, while EWL% and EBMIL% positively correlated (r = 0.43, r = 0.46 respectively) with this FA. EPA (C20:5n3) also exhibited several dependencies with obesity‑related parameters; it correlated positively with FFM (r = 0.49) and waist circumference (r = 0.44), and negatively with non–HDL‑C (r = –0.33) and triglyceride levels (r = –0.36). Finally, the OMEGA‑3 Index correlated negatively with non–HDL‑C levels (r = –0.43). All correlations mentioned above were significant.
Discussion
Our study confirms that LSG leads to quick weight loss and improvement of other anthropometric parameters in patients with morbid obesity. However, the main question we addressed was related to metabolic alterations following LSG that may potentially occur after drastic changes in the amount and quality of ingested food. We concentrated on postbariatric surgery evolution of the erythrocyte membrane FA composition, which should, to some extent, reflect general changes in cell physiology, as FAs are known to be regulators of numerous cell functions.30
For example, n‑6 and n‑3 FAs were found to influence gene expression (eg, related to lipid and carbohydrate metabolism and inflammation), directly through interactions with transcription factors, or indirectly by changing the composition of membrane lipids and lipid rafts, and modifying cell signaling pathways.31-33
One way of monitoring the FA profile changes induced by bariatric surgery is to analyze the blood FA composition. Such studies were indeed performed mainly for plasma, serum, or whole blood6,26; however, the results were inconsistent, possibly due to FA fluctuations based on daily dietary intake and / or different types of bariatric procedures that were examined.34-37 A much better matrix for investigating changes in FA levels caused by bariatric surgery can be the FA composition of the erythrocyte membrane, as it reflects dietary intake over 2 to 3 months.38,39 Another very important requirement is that the study includes patients who undergo only 1 type of bariatric surgery. Such studies were previously performed on patients undergoing the RYGB procedure.6,26 However, data for other types of interventions were missing.
Changes in erythrocyte membrane fatty acid composition
To our best knowledge, this is the first study analyzing changes in the FA profile of erythrocyte membranes among patients treated with LSG. We analyzed the erythrocyte membrane FA composition in healthy individuals and patients with morbid obesity. In the latter group, the analysis was performed at the baseline and 6 months after the surgical intervention. In the following section, our results are compared with the outcomes of similar investigations related to RYGB.6,26,27
Considering that the n‑3 PUFA status can be used for the assessment of inflammation16,40 and risk of chronic diseases,41,42 we first analyzed the indices often used to assess the n‑3 PUFA status, including the n‑3 to n‑6 FA ratio, the OMEGA‑3 Index, and the EPA to ARA ratio.41-43
In the group of healthy controls, the ratio of n‑3 to n‑6 was much higher than in the patients with morbid obesity, which is in line with the predisposition of obese individuals to inflammatory and other diseases. In the case of RYGB surgery, the n‑3 to n‑6 FA ratio was significantly reduced 12 months after the intervention, as compared with preoperative values (0.04 vs 0.09, respectively).27 This contrasts with our findings, where this marker slightly increased after only 6 months post‑LSG.
The positive impact of LSG surgery on the erythrocyte membrane FA composition seems even more pronounced when reflected by changes in the OMEGA‑3 Index. Of note, the OMEGA‑3 Index value of 4 is considered optimal to reduce the risk of chronic diseases.15 Our post‑LSG patients almost reached this threshold 6 months after the operation, showing a significant improvement, as compared with the low levels seen in the baseline subgroup. In contrast, among patients treated with RYGB surgery, the post‑surgery OMEGA‑3 Index was shown to be lower than the baseline value (0.63 vs 1.16, respectively; P <0.01).27 Another measure of the PUFA status is the EPA to ARA ratio. A low ratio of these FAs was proved to be an independent risk factor for acute coronary syndrome.41 In the study of RYGB patients, this index decreased from 0.079 to 0.042 at 12‑month follow‑up.27 In our study, the EPA to ARA ratio was much higher in all subgroups, which may be a result of differences between the analyzed populations (United States vs Poland). It is also worth noting that 6 months after the intervention, the EPA to ARA ratio increased in our study group, in contrast to what was observed in the abovementioned post‑RYGB individuals.
Our results suggest diverse changes in FA metabolism post‑LSG, potentially leading to a more favorable inflammatory status and a greater reduction in cardiovascular disease (CVD) risk than following RYGB. The observed positive changes in the erythrocyte membrane FA composition in post‑LSG patients are likely related to the differences in absorption of nutrients, which might be considerable following these 2 types of surgical intervention. It is possible that RYGB surgery, which involves bypassing a large portion of the stomach and the small intestine, reduces the absorption of nutrients,27 (eg, lipids and lipid‑soluble vitamins) to a greater extent than LSG. Further studies are warranted to ascertain whether this beneficial effect of LSG is long‑lasting and potentially enhanced with time.
Correlations of the erythrocyte membrane fatty acid profile with clinical / laboratory parameters
With respect to the correlations between the follow‑up to baseline ratios of each FA and clinical / laboratory parameters, one of the striking observations was a significant association between the level of LA and weight and other anthropometric data, such as BMI, FM, TWL%, EWL%, and EBMIL%. The LA level increased with the reduction of weight, BMI, and FM. In turn, it showed a positive relationship with TWL%, EWL%, and EBMIL%. The observed relations raise a question about the role of LA in metabolic processes associated with development of obesity.
The role of LA in obesity development is currently uncertain due to many factors potentially contributing to this process.44 For example, Wang et al45 showed that erythrocyte LA is positively associated with weight gain.45 On the contrary, Belury et al46 proved that a higher erythrocyte LA concentration was associated with improved body composition, lower weight, BMI, insulin resistance, and inflammation.46 Positive impact of LA on the health status was observed also in other conditions, such as stroke or carotid artery disease.47
Wrzosek et al48 analyzed blood FA profile evolution in post‑LSG patients. Higher LA concentrations in plasma were observed 1 year after surgery, as compared with the baseline levels, and were attributed to the positive action of LA’s metabolic product, ARA, which, in low concentrations, is a potent bioactive mediator.48
The outcomes of our study strengthen the importance of LA in promoting favorable physiological processes after LSG.
Study limitations
The study limitations encompass the unaccounted effects of lipid‑lowering treatments on erythrocyte FAs, necessitating separate methodologies. To justify the minimal potential influence of lipid‑lowering treatment on the study outcomes, we refer to the findings from our prior investigation, which revealed that only a minority of the participants were undergoing such therapy. Moreover, even among those receiving medication, the disease control was suboptimal, and there was no observed statistical impact on lipid parameters.49 Consequently, we decided not to incorporate this factor into the present analysis. Notably, the baseline subgroup adhered to the enhanced recovery after surgery protocol, which minimized the effect of surgical intervention on baseline metabolism.50Another limitation is the unaccounted effect of diet and physical activity. These aspects were not assessed in individual patients, as it would require separate methodologies, such as dedicated questionnaires or devices for measuring intensity of exercise. We relied on the fact that each individual scheduled for bariatric surgery had to follow a similar prescribed restrictive diet and perform a similar recommended set of physical exercises. Despite a considerable number of patients lost to follow‑up, the samples of baseline patients (with and without follow‑up) were similar in most of the parameters studied (Supplementary material, Tables S1–S3).
Conclusions
In summary, this study provided insight into the evolution of erythrocyte FA profile following LSG. It revealed beneficial changes in the composition of FAs within the erythrocyte membrane among patients 6 months postintervention, along with notable weight loss, reductions in BMI, and improvements in all other anthropometric parameters. Our study indicated that, as compared with other types of bariatric surgery, LSG may have a more beneficial influence on the reduction of inflammation and CVD risk, via increasing OMEGA‑3 Index and the EPA/ARA ratio. Furthermore, our results unveiled complex relationships between the erythrocyte FA profile and clinical parameters across diverse study groups, reflecting different health conditions. Of particular interest is a positive correlation between the magnitude of improvements in anthropometric parameters after LSG with the extent of erythrocyte LA increase. It is likely that these correlations are related to a higher LA intake among the patients exhibiting the greatest improvements in clinical parameters, such as weight, BMI, and FM. Thus, patients who have undergone LSG should be recommended to follow a diet with a sufficient supply of LA.
- Unamuno X, Gómez‐Ambrosi J, Rodríguez A, et al. Adipokine dysregulation and adipose tissue inflammation in human obesity. Eur J Clin Invest. 2018; 48: e12997. | Crossref
- Chouchani ET, Kajimura S. Metabolic adaptation and maladaptation in adipose tissue. Nat Metab. 2019; 1: 189‑200. | Crossref
- Chooi YC, Ding C, Magkos F. The epidemiology of obesity. Metabolism. 2019; 92: 6‑10. | Crossref
- Ramos A, Kow L, Brown W, et al. The IFSO Global Registry 5th IFSO Global Registry Report. https://www.ifso.com/pdf/5th‑ifso‑global‑registry‑report‑september‑2019.pdf. Accessed December 14, 2023.
- Colquitt JL, Pickett K, Loveman E, Frampton GK. Surgery for weight loss in adults. Cochrane Database of Systematic Reviews. 2014; 2014: CD003641. | Crossref
SUPPLEMENTARY MATERIAL
ARTICLE INFORMATION