Are patients with severe obesity aging faster? Impact of severe obesity on different aspects of biological age
Key words: aging, biological age markers, fat tissue, obesity

 CC BY 4.0
Are patients with severe obesity aging faster? Impact of severe obesity on different aspects of biological age
Introduction: Obesity and aging are characterized by chronic low‑grade inflammation, which contributes to the onset of degenerative processes.
Objectives: Our objective was to comprehensively analyze the prevalence of premature aging in patients with obesity and identify metabolic factors influencing aging.
Patients and methods: In this prospective cohort study, telomere length, DNA damage, interleukin 6 (IL‑6) level, metabolic age, and cognitive functions were evaluated in patients with severe obesity (study group [SG], defined as body mass index [BMI] equal to or above 40 kg/m2 or equal to or above 35 kg/m2 with comorbidities; n = 100) and healthy volunteers (control group [CG], defined as BMI 18.5–24.9 kg/m2; n = 33). The SG was further divided into 2 subgroups, SG1 comprising patients with BMI equal to or above 50 kg/m2 and SG2 with BMI below 50 kg/m2.
Results: Our findings showed that individuals in the SG had shorter telomeres, higher levels of inflammation, and more advanced metabolic age than those in the CG. However, no significant differences in DNA damage or cognitive function abilities were observed between the groups. Notably, the SG1 displayed elevated IL‑6 levels as compared with the SG2. Furthermore, IL‑6 levels decreased significantly with increasing body fat, and the individuals with higher visceral fat levels had longer telomeres.
Conclusions: Premature aging manifests in obesity through telomere length, inflammation levels, and metabolic age. Aging in obesity should be considered as a nonlinear process.
What's new?
Obesity and aging are characterized by a state of chronic low‑grade inflammation, leading to development of chronic diseases and degenerative processes. However, the impact of metabolic dysregulation stemming from obesity and fat tissue on different aspects of biological aging remains unexplored. Analyzing a wide range of biological age markers, including telomere length, DNA damage, level of inflammation, metabolic age, and psychological age, the study compares biological age markers in 100 patients with severe obesity and 33 healthy controls. The study demonstrates the features of aging in obesity and delineates the association between metabolic parameters and biological age markers.
Introduction
The main mechanism underlying aging is considered to be a chronic, low‑grade inflammation that progresses over time, known as inflammaging. It is triggered by accumulation of tissue‑damaging proinflammatory factors, impaired autophagy and immune functioning, increased cellular aging, and development of age‑related diseases, such as atherosclerosis, hypertension, diabetes mellitus, dementia, and cancer.1 Molecular and cellular hallmarks of aging have been distinguished and characterized, with telomere length, the level of DNA damage, and accumulation of inflammatory markers being the main culprits.2
Telomeres, as protective structures located at the ends of chromosome DNA strands, are naturally shortening during each cell division. Factors damaging DNA, inflammation‑generated free radicals or cellular stress can lead to telomere attrition and excessive shortening.3 A molecule called 8‑oxo‑2'-deoxyguanosine (8‑oxo‑dG) is a marker of genome instability due to DNA damage, and its accumulation denotes progressive cell senescence.4,5 Another marker used to assess the level of senescence is deterioration of neurocognitive abilities, such as frontal lobe function, visual perception, memory function, attention, reaction time, cognitive intelligence, and general mental functioning.6 The last factor, metabolic age, can be determined with a body composition analyzer algorithm.7,8
There are many similarities in the mechanisms of aging and obesity. Obesity is defined as chronic low‑grade inflammation, which also results in development of comorbidities characteristic of aging. Visceral adipose tissue is regarded as a neuroendocrine organ triggering inflammation. The tissue secretes proinflammatory factors (eg, interleukin 6 [IL‑6], tumor necrosis factor α) and accumulates immune cells, which generate cytokines impairing metabolic pathways.9,10 IL‑6 is one of the most important regulators of immune processes, influencing secretion of acute‑phase proteins and development of a generalized inflammatory response. Although the proinflammatory activity of adipose tissue in the pathogenesis of obesity is clear, its actual role is not fully understood. Adipose tissue also plays a protective function by activating inflammatory response or buffering lipid toxicity.11
Obesity is considered a factor that accelerates the mechanisms of aging. Some papers linked obesity with more advanced telomere shortening than in healthy individuals.12,13 However, it has not yet been investigated how obesity‑generated metabolic disorders and body fat content affect various aspects of biological age. To fill this gap, we aimed to investigate the impact of severe obesity on different aspects of aging, including telomere length, level of DNA damage, inflammatory markers, cognitive functioning, and metabolic age.
Patients and methods
Study design
This prospective cohort study was conducted in the academic, tertiary referral hospital and a specialized private medical center that focuses on fostering healthy lifestyle and longevity, between July 2020 and May 2021.
The study group (SG) included patients qualified for surgical treatment of obesity according to bariatric and metabolic surgery guidelines (with body mass index [BMI] ≥40 kg/m2 or BMI ≥35 kg/m2 with obesity‑related comorbidities).14 A group of volunteer participants who have never suffered from obesity, with BMI from 18.5 to 24.9 kg/m2 were the control group (CG). The inclusion criteria were age between 18 and 65 years, informed consent to participate in the study, and meeting the eligibility criteria either for SG or CG. The exclusion criteria comprised symptoms of an acute inflammatory reaction, inflammatory bowel disease, depression, neurological or other diseases affecting cognitive function, medications that impair cognitive function, or pregnancy within the last 6 months.
We first analyzed differences in the investigated biological age markers (telomere length, DNA damage, inflammatory parameters, metabolic age, cognitive functions) between the groups. Then, the SG was divided into 2 subgroups: patients with class IV obesity with BMI equal to or above 50 kg/m2 (SG1) and patients with below class IV obesity with BMI below 50 kg/m2 (SG2). The cutoff of 50 kg/m2 was set due to possible differences in clinical management for this class of obesity.15,16
We analyzed the effect of BMI, percentage body fat, and visceral fat levels on individual biological age markers.
With an aim to establish a relationship between obesity‑related parameters and telomere length, we developed a regression model assessing the effect of metabolic parameters routinely tested before bariatric surgery on telomere length. These parameters included the levels of glycated hemoglobin (HbA1c), low‑density lipoprotein cholesterol (LDL‑C), high‑density lipoprotein cholesterol (HDL‑C), total cholesterol, triglycerides, C‑reactive protein (CRP), free triiodothyronine (ft3), free thyroxine (ft4), and thyroid‑stimulating hormone (TSH).
Finally, the SG was divided according to telomere quartile. We examined the variations in additional biomarkers of biological age across telomere length quartiles, with adjustments made for sex and chronological age.
The study was meticulously designed, adhering to all the guidelines outlined in the STROBE checklist for cohort studies.17
End points
The primary end point was to analyze differences in biological age markers between the SG and the CG.
The secondary end point was to investigate differences in biological age between patients with BMI below and equal to or above 50 kg/m2. Furthermore, we checked the relation between the selected metabolic and biochemical parameters and individual markers of aging. Ultimately, we aimed to find the parameters most strongly affecting telomere length in the patients with obesity.
Biological age markers
Measurements of telomere length, DNA damage, and IL‑6 were performed at the university laboratory.
Telomere length analysis
Blood samples collected from each participant into EDTA tubes were immediately frozen at –80 °C until analysis. Genomic DNA from the blood samples was extracted using the NucleoSpin blood purification kit (Macgerey‑Nagel, Duren, Germany) and dissolved in an elution buffer according to the manufacturer’s instructions. Concentration of each DNA sample was quantified using the Qubit fluorometer (Thermo Fisher Scientific, Waltham, Massachusetts, United States), and DNA integrity was analyzed with the Agilent 2100 bioanalyzer (Agilent Technologies, Santa Clara, California, United States). To determine absolute telomere length values, a digital polymerase chain reaction (dPCR) technology was used. High‑molecular weight DNA was diluted using molecular grade water to receive the concentration of 1 ng/2 µl. One nanogram of DNA was used as input material. All samples were measured in triplicates on the same plate and then averaged. PCR amplifications were performed with Qiagen Qiacuity Digital PCR Machine (Qiagen, Manchester, United Kingdom). The thermal profile of dPCR was adapted based on the quantitative PCR method developed by Cawthon18 with modifications (details available upon request). Nontemplate controls, in the form of 3 established reference DNA samples, were also run in triplicate on each plate as positive controls. Forward and reverse telomere primer sequences were adapted from Cawthon and were as follows: 5'-cggtttgtttgggttt‑gggtttgggtttgggtttgggtt‑3' and 5'-ggcttgccttacccttacccttacccttacccttaccct‑3'.18
DNA damage analysis
Peripheral blood was collected into EDTA tubes from all participants. The samples were frozen and stored at −80 °C until 8‑hydroxy‑2'-deoxyguanosine (8‑oxo‑dG) analysis. DNA was extracted from blood samples using a DNeasy blood and tissue kit (Qiagen) and quantified with the NanoDrop 1000 spectrophotometer (SelectScience, Thermo Fisher Scientific). The level of 8‑oxo‑dG was measured using the EpiQuick 8‑OHdG DNA damage quantification direct kit (Epigentek, Cambridge Bioscience Ltd, Cambridge, United Kingdom) according to the manufacturer’s instructions. The values from each sample were calculated based on calibration sigmoid plots of absorbance (450 nm) of an 8‑oxo‑dG standard at various concentrations. The results were also presented as relative quantification with a positive control provided by the kit and normalized to the input DNA (pg), using the recommended formula.
Determination of interleukin 6 level
Blood samples were collected after overnight fast from the cephalic vein of all participants. The samples were centrifuged at 1000 × g for 15 minutes at room temperature, and serum was collected. The serum specimens were stored at –80 °C until further analysis. Serum concentration of IL‑6 was measured using commercially available enzyme‑linked immunosorbent assay kits (Bio‑Techne, Minneapolis, Minnesota, United States). All procedural steps were performed according to the assay’s instructions and manufacturers’ recommendations. The concentration of IL‑6 was expressed in mmol/l.
Cognitive function assessment
Cognitive function assessment was performed by a clinical psychologist.
Psychological age testing (assessing the ability to maintain and switch attention, process information in a sequential manner, and monitor one’s own behavior, and executive functions) was performed using 2 commercially available psychological tests: the Color Trails Test (CTT) and the Wisconsin Card Sorting Test.
The CTT test consists of 2 parts, CTT‑1 and CTT‑2. The time taken to solve the test was assessed. The shorter it was, the better the score. Raw results were compared with normalization ranges that took into account age and level of education, and allowed for assigning centiles and tens, as well as with performance level groups (1, acute impairment; 2, moderate / acute impairment; 3, mild / moderate impairment; 4, mild impairment; 5, below average; 6, average; 7, above average) assigned to each respondent.19,20 In the Wisconsin Card Sorting Test, the fewer attempts the examinee made to solve the test, the better the score. Due to confounding factors that occurred during the cognitive function tests, 4 missing values were removed from the analysis.
Determination of metabolic age
Body composition analysis and calculation of metabolic age based on basal metabolism were performed by measuring electrical bioimpedance with the Tanita BC‑601 body composition analyzer (Tokyo, Japan).21
Assessment of selected metabolic markers
The markers assessed with the Tanita BC‑601 body composition analyzer and included in further analysis were BMI, body fat percentage, and visceral fat levels. Serum levels of CRP, fT3, fT4, TSH, HbA1c, LDL‑C, HDL‑C, cholesterol, and triglycerides were determined as markers of metabolic health after overnight fast.
Statistical analysis
Calculations were conducted using R version 3.6.0 (R Foundation for Statistical Computing, Vienna, Austria), PSPP (Free Software Foundation, Boston, Massachusetts, United States), and MS Office 2019 packages (Redmond, Washington, United States). A P value below 0.05 was treated as significant. Normal distribution of data was assessed using histograms, kurtosis, and skewness. Multivariate analysis of variance (ANOVA) was employed to analyze quantitative variables, according to the group, age, and sex. To assess differences in biological age between the obesity subgroups, the t test or the Mann–Whitney test was applied. To assess the impact of metabolic parameters on biological age markers, the ANOVA examined the impact of the group (patients with obesity or healthy volunteers), BMI, body fat, and visceral fat on biological age components. This was followed by the post hoc analysis using the Tukey honestly significant difference. Multivariable linear regression was used to explore the relationship between metabolic parameters and telomere length. The SG was also divided into telomere length quartiles, with additional analyses of variance incorporating age and sex.
Ethics
All procedures involving human participants were in compliance with the ethical standards of the institutional and national research committee and with the 1964 Helsinki Declaration and its later amendments or comparable ethical standards. The study was approved by the Bioethics Committee of the Jagiellonian University (1072.6120.201.2019).
Results
Characteristics of the participants
Our cohort consisted of 133 participants, with 100 patients (66% women, 34% men; mean [SD] age, 42.17 [10.27] years) meeting the criteria for the SG. The CG comprised 33 volunteers (63.6% women, 36.4% men; mean [SD] age, 44.88 [8.2] years). There were no significant differences in age or sex distribution between the groups. Mean (SD) BMI was 44.57 (6.06) kg/m2 in the SG, and 23.06 (3.13) kg/m2 in the CG (Table 1).
Parameter | Total | Patients with obesity | Nonobese controls | P value |
Data are presented as mean (SD) or median (interquartile range).
Abbreviations: BMI, body mass index | ||||
Patients, n (%) | 133 (100) | 100 (75.2) | 33 (24.8) | – |
Age, y | 43 (10.2) | 42.17 (10.27) | 44.88 (8.2) | 0.7 |
Women, n (%) | 87 (65.4) | 66 (66) | 21 (63.6) | 0.8 |
Weight, kg | 109 (43–225.9) | 129.38 (84–225.9) | 70.68 (43–110) | <0.001 |
BMI, kg/m2 | 36 (21) | 44.57 (6.06) | 23.06 (3.13) | <0.001 |
Body fat, % | 45.16 (8.41) | 47.5 (6.4) | 24.3 (7.97) | <0.001 |
Visceral fat distribution, % | 12 (7) | 18.83 (8.31) | 5.73 (3.14) | <0.001 |
Type 2 diabetes and prediabetes, n (%) | 19 (14.29) | 19 (19) | 0 | <0.001 |
Hypertension, n (%) | 40 (14.29) | 40 (40) | 0 | <0.001 |
Autoimmune thyroid disease (in regression phase), n (%) | 20 (15.04) | 16 (16) | 4 (36.4) | <0.001 |
Obstructive sleep apnea, n (%) | 10 (7.52) | 10 (10) | 0 | <0.001 |
Obesity in family, n (%) | 67 (50.36) | 63 (63) | 4 (12.5) | <0.001 |
Duration of obesity, y | 20 (12) | 20 (12) | 0 | <0.001 |
Smoking, n (%) | 34 | 26 (26) | 8 (20) | 0.88 |
Smoking, pack‑years | 16 (8) | 15 (7) | 20 (12) | 0.96 |
Education | ||||
Primary, n (%) | 1 (0.75) | 2 (2) | 0 | <0.001 |
Vocational, n (%) | 3 (2.26) | 5 (5) | 0 | |
Secondary, n (%) | 30 (22.56) | 47 (47) | 0 | |
Higher, n (%) | 62 (46.6) | 46 (46) | 33 (100) | |
SG1 comprised 20, a SG2 79 patients. To maintain integrity of the analysis, 1 sample which significantly deviated from the SG2 was removed. The groups were similar in chronological age and sex distribution.
Primary end point
Differences in biological age markers between the patients with severe obesity and healthy controls are presented in Table 2 and in Figure 1. The variance model was significant for telomere length, IL‑6, and metabolic age. The only differential variable was group assignment.
Parameter | Patients with obesity | Nonobese controls | P value |
Data are presented as mean (SD) or median (interquartile range).
a 4 values were missing in the obesity group
Abbreviations: bp, base pairs, CTT‑1, Color Trails Test part 1; CTT‑2, Color Trails Test part 2; IL‑6, interleukin 6 | |||
Patients, n | 100 | 33 | – |
Telomere length, bp | 3947.4 (1115.14) | 5191.53 (2356.29) | 0.009 |
DNA damage, mmol/l | 1500.69 (523.65) | 1547.39 (456.17) | 0.65 |
Inflammation level (IL‑6), pg/ml | 4.57 (3.17) | 1.19 (0.33) | <0.001 |
Metabolic age, y | 56.18 (9.85) | 37.12 (12.8) | <0.001 |
Cognitive function assessmenta | |||
Cognitive function CTT‑1 raw score, s | 43.11 (18.82) | 35.09 (10.95) | – |
Cognitive function CTT‑1, centile | 54 (27–69) | 46 (30–67) | – |
Cognitive function CTT‑2, raw score, s | 77.10 (25.25) | 66.35 (16.23) | – |
Cognitive function CTT‑2, centile | 73 (42–84) | 66 (50–79) | – |
Performance level group [index], n | 2 (2) | 2 (1) | 0.8 |
Wisconsin Cart Sorting Test, number of attempts | 128 (42) | 86 (38) | 0.6 |
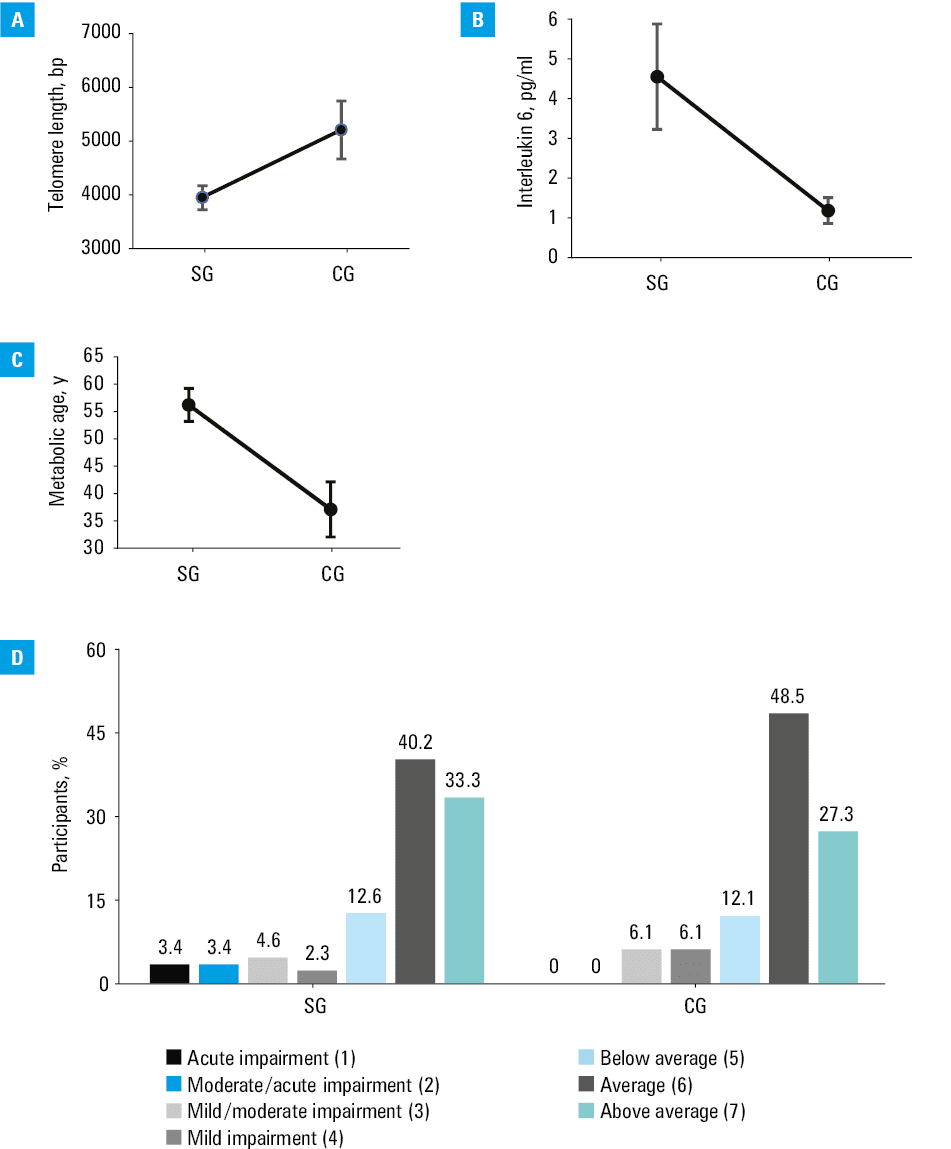
Mean (SD) telomere length was shorter in the patients with obesity than in the healthy controls (3957.4 [1115.15] vs 5191.53 [2356.29] bp; P = 0.009).
The variance model was not significant for DNA damage.
The mean (SD) level of IL‑6 was higher in the SG than in the CG (4.57 [3.17] vs 1.19 [0.33] pg/ml; P <0.001).
The participants from the SG had higher mean (SD) metabolic age than the controls (56.18 [9.85] vs 37.12 [12.8] years; P <0.001).
In terms of cognitive function in the CTT‑1 test, the mean (SD) raw speed of the test solving was 43.11 (18.82) seconds in the SG and 35.09 [10.95] seconds in the CG. In the CTT‑2 test, the mean (SD) raw speed of the test solving for the patients with obesity was 77.1 (26.25) seconds and for the CG it was 66.35 (16.23) seconds. Considering the education level and age of the patients, median (IQR) was 54 (27–69) centiles for the SG, and 46 (30–67) centiles for the CG.
In the CTT‑2 test, the patients with obesity reached a median (IQR) of 73 (42–84) centiles, and the healthy controls 66 (79–50) centiles. The model for the results assigned to the normalization groups (1 to 7) did not show significance (P = 0.8). In the Wisconsin Card Sorting Test, the mean (SD) number of attempts required to solve the test was 128 (42) in the SG and 86 (38) in the CG (P = 0.6).
Secondary end points
Divergence in biological age markers between patients with body mass index equal to or above and below 50 kg/m2
IL‑6 levels were higher in the patients with BMI equal to or above 50 kg/m2 than those with BMI below 50 kg/m2 (P = 0.04). However, no significant differences were identified for the other biological age markers between the SG1 and SG2 groups (Table 3).
Parameter | SG1 | SG2 | P value |
Data are presented as mean (SD) or median (interquartile range).
a 4 values were missing in the obesity group
Abbreviations: SG, study group; others, see Table 2 | |||
Patients, n | 20 | 79 | – |
Calendar age, y | 41.72 (7.37) | 42.68 (8.28) | 0.61 |
Telomere length, bp | 4302.65 (998.97) | 3865.92 (1135.62) | 0.12 |
DNA damage, mmol/l | 1453.03 (563.48) | 1518.82 (516.56) | 0.51 |
Inflammation level (IL‑6), pg/ml | 4.96 (2.02) | 4.48 (3.42) | 0.04 |
Metabolic age, y | 62.12 (12.45) | 55.18 (9.85) | 0.2 |
Cognitive function assessmenta | |||
Cognitive function
(CTT‑1), centile | 60 (42–84) | 60 (40–88) | 0.73 |
Influence of metabolic parameters on aging markers
ANOVA models assessed the effects of obesity prevalence, BMI, and body fat levels on the components of biological age (telomere length, DNA damage, IL‑6 level, and metabolic age) in different groups.
The ANOVA analyses showed that the models for telomere length, IL‑6, and metabolic age were of high quality (P <0.05) (Table 4).
Parameter | Telomere length | DNA damage | Inflammation marker (IL‑6) | Metabolic age |
a P <0.05; b P <0.01; c P <0.001
Abbreviations: see Table 2 | ||||
Model | <0.001c | 0.96 | <0.001c | <0.001c |
Obesity group assignment | 0.009b | 0.67 | <0.001c | <0.001c |
BMI | 0.251 | 0.92 | 0.67 | 0.95 |
Body fat percentage | 0.56 | 0.49 | 0.04a | 0.004b |
Visceral fat level | 0.01a | 0.39 | 0.055 | 0.39 |
The model fit coefficient of R2 explained 12% of the variation in telomere length. The model for inflammatory marker IL‑6 explained 24.5% of the variation in this parameter. The model for metabolic age explained 41% of the variation in metabolic age.
Telomere length, IL‑6 level, and metabolic age depended on the obesity group (P <0.001).
BMI alone did not have a significant effect on any parameters of biological age.
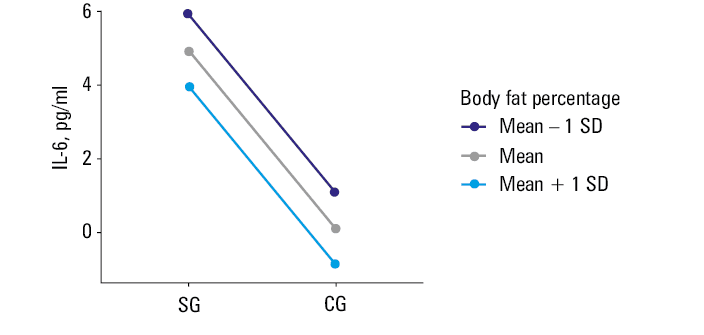
Body fat percentage affected the level of the inflammatory marker IL‑6 (P = 0.04). The regression model showed that when body fat increased by 1%, IL‑6 level decreased by 0.08 pg/ml. As the result was surprising, we repeated an independent statistical analysis 2 times with the same outcomes (Figure 2).
Metabolic age increased with an increase of the body fat content (P = 0.004).
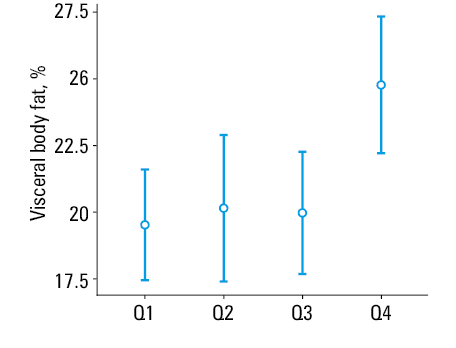
Our analysis showed that the visceral fat level was related to telomere length (P = 0.01). We performed a more detailed analysis, using post hoc test and division of telomere length into quartiles, and found differences between the first quartile and the fourth quartile (P = 0.01) and between the third quartile and the fourth quartile (P = 0.04). This indicated that the telomeres were the longest in the patients with the highest levels of visceral fat (Figure 3).
Influence of metabolic parameters and biological age markers on telomere length
Further analyses assessed the influence of metabolic parameters on telomere length. In a multivariable linear regression model, the levels of CRP, fT3, fT4, TSH, HbA1c, LDL‑C, HDL‑C, cholesterol, and triglycerides were not shown to have a significant effect on telomere length in the patients with obesity.
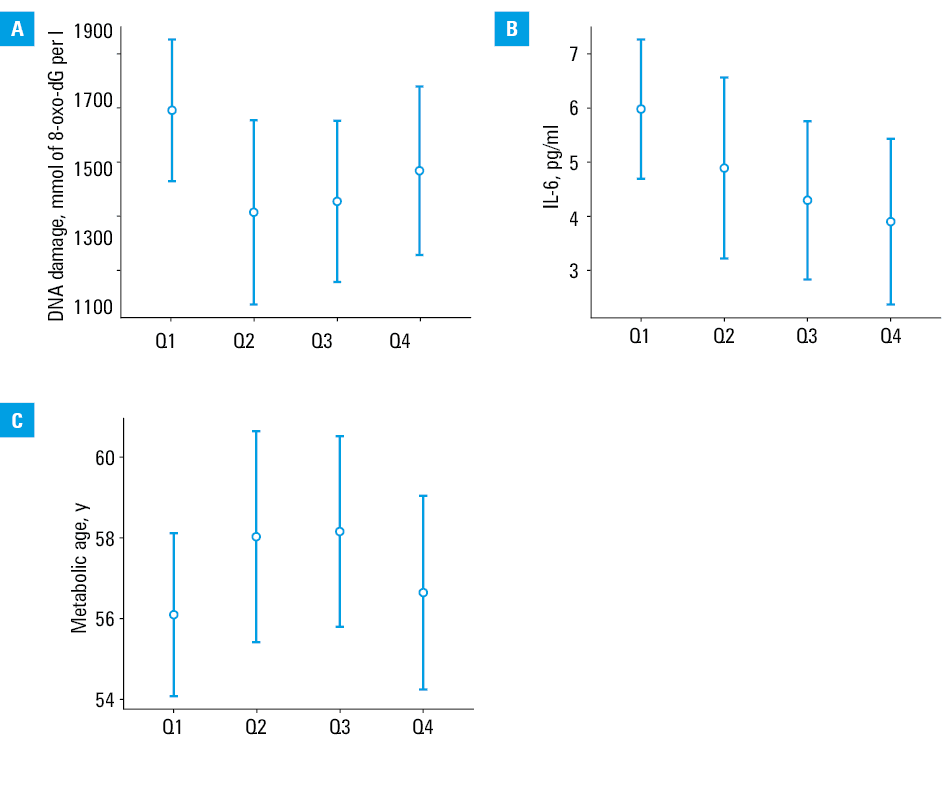
In ANOVA analyses, we examined how telomere length related to the indicators of biological aging (DNA damage, IL‑6 level, metabolic age), considering age and sex, with telomere length divided into quartiles.
The analyses showed no specific differences, indicating that the DNA damage level (P = 0.25), IL‑6 level (P = 0.17), or metabolic age (P = 0.49) were not differentiated by telomere length in patients with obesity (Figure 4). No model showed a significant effect of age or sex on telomere length.
Discussion
Current research studies are increasingly focused on the intricate interplay between obesity and aging, highlighting complexity of this relationship. This is one of the few studies that comprehensively analyzed the impact of obesity on various aspects of biological age, such as telomere length, levels of DNA damage and inflammation, metabolic age, and psychological age. The value of our study is derived from its thorough examination of various aging parameters, aiming to establish connections between the markers of biological aging, inflammation, obesity severity, adiposity, and metabolic profiles.
Our results indicate the influence of obesity on some aspects of premature aging. We showed that the patients with obesity had shorter telomeres, higher levels of inflammation (IL‑6), and more advanced metabolic age. However, we observed no differences in DNA damage and cognitive function abilities between patients with and without obesity.
We also included a comparative analysis of patients with class IV obesity, in whom we proved higher levels of the inflammatory marker, IL‑6, but no differences in telomere length, DNA damage, or cognitive function in comparison with the patients with lower classes of obesity.
By analyzing the models that considered the effect of metabolic parameters on the markers of biological age, we showed that obesity alone affects telomere length, IL‑6 levels, and metabolic age. We also demonstrated a correlation between visceral fat levels and telomere length, and between adipose tissue percentage, IL‑6 levels, and metabolic age. Surprisingly, the detailed analysis showed that IL‑6 levels decreased with increasing body fat and that the telomeres were the longest in the group of patients with obesity and the highest visceral fat levels. Metabolic age alone correlated positively with higher body fat, consistent with the developed algorithm for calculating marker values.
We found no correlations between other metabolic parameters, such as CRP, fT3, fT4, TSH, HbA1c, LDL‑C, HDL‑C, cholesterol, triglycerides, and biological age markers or telomere length.
Our observations of obesity‑generated premature aging are supported by several papers. Chen et al22 investigated the effect of obesity prevalence on telomere length in a population of American Indians, and demonstrated that the group with obesity had significantly shorter telomeres than controls. Valdes et al23 reported that telomeres in patients with obesity were by 240 bp shorter than in lean participants. Interestingly, these authors pointed out that considering in vivo models representing the levels of oxidative and inflammatory damage, telomere length in the obese individuals was indicative of 8.8 additional years of age.
The level of DNA damage did not differ between the SG and the CG. Our results contradict the studies proving a significant increase in 8‑oxo‑dG levels in both serum and urine in patients with obesity as compared with healthy individuals.24,25 However, in line with our results, Donmez‑Altuntas et al26 showed lower levels of DNA damage in patients with obesity than in healthy controls, explaining it by potential repair of some of 8‑oxo‑dG lesions through the base excision repair pathway.26 A possible explanation for our results is a requirement of preoperative weight loss (5%–10%) through diet and physical activity, which may have resulted in a significant reduction in oxidative stress, free radical activity, and activation of molecular repair pathways. In support of this, Dandona et al27 described a significant reduction in oxidative stress and reactive oxygen species in patients with obesity without diabetes after a short period of diet and weight loss.
Increased inflammation in obese individuals was reported by Roytblat et al,28 who investigated 100 obese adults and revealed a significant correlation between IL‑6 levels and anthropometric measures, such as body weight and BMI. However, the underlying factors contributing to the heightened levels of inflammatory markers remain elusive.
We noted no differences in cognitive function between the participants with and without obesity. The lower raw results in the cognitive tests achieved by the patients with obesity were most likely linked to their lower level of education than in the controls, as after assignment to the normalization group, we found no significant differences. Contrary to our results, some papers indicated a general negative effect of obesity on global cognitive functions, as well as specifically on executive functions, motor functions, attention stability, processing speed, and verbal memory, indicating association specifically with vascular cognitive impairment.29-32 Data collected from reviews on the association of obesity with cognitive aging suggest that obesity in middle‑aged adults may be more detrimental to later cognitive decline than obesity developed later in life.33,34
We also proved premature aging in obese patients using a metabolic age marker developed from a body composition analyzer algorithm.
Our secondary objective was to identify factors that influence premature aging in patients with obesity.
In the subgroup of patients with BMI equal to or above 50 kg/m2, we showed higher levels of IL‑6 than in the patients with BMI below 50 kg/m2, although we did not show differences in other biological age markers. Although there are only a few reports in the literature on IL‑6 levels in patients with class IV obesity, it is worth mentioning the work of El‑Mikkawa et al,35 who showed a significant correlation between circulating IL‑6 levels and BMI in patients with class III obesity. No differences in biological age markers in the group with class IV obesity, as compared with patients with obesity of lower classes, suggested that the mechanisms of premature aging are already activated at the onset of obesity, regardless of its stage, or after damaging factors, such as inflammation or oxidative stress, exceed certain threshold. Perhaps the obesity class is less important than the duration of chronic inflammation or years of obesity.
Furthermore, when analyzing the effects of metabolic parameters on the markers of biological age, we did not show an effect of BMI on aging characteristics. There are papers confirming a negative association between BMI and telomere length36-39; however, they are inconclusive and advocate the need for further research on the association of BMI with inflammation and telomere length, rather than BMI itself. Valdes et al23 concluded that leptin levels, rather than BMI, may have a greater influence on telomere length.
Longer telomeres in the patients with higher percentage of visceral fat, not shorter telomeres in the individuals with class IV obesity, and the negative association between fat percentage and IL‑6 levels may suggest the existence of compensatory mechanisms. Fat accumulation leads to hypoxia and aging, causing macrophage infiltration, cytokine secretion, and low‑grade inflammation. Inflammation also triggers anti‑inflammatory mediators, such as IL‑10 and IL‑19, whose roles are not well understood. Mice on high‑fat diets showed increased IL‑10 expression.40-42 Adipose tissue activates stress response pathways, such as unfolded protein response and autophagy, to adapt to metabolic demands and oxidative stress.43-45 While those compensatory mechanisms may provide short‑term protection against metabolic disorders, long‑term exposure to excessive obesity may overwhelm these mechanisms and contribute to development of chronic diseases.
Our results highlighted the role of obesity in premature aging and raised questions about the mechanisms behind this link and possible compensatory mechanisms that protect the intracellular molecular environment despite increased body fat level. As emphasized by Płaczkiewicz‑Jankowska et al,46 innovative solutions and concerted efforts are urgently needed to address the obesity pandemic. Understanding the mechanisms of obesity‑related premature aging could lead to development of advanced obesity monitoring biomarkers and new pharmacotherapeutic targets.
Limitations
Our study has a few limitations. Importantly, participant recruitment was limited by the study’s funding, which resulted in a relatively small cohort. The SG1 size was small, but it should be acknowledged that individuals with BMI equal to or above 50 kg/m2 represent extreme cases of obesity with low prevalence in Poland. Moreover, the enrolled patients had a strong motivation, as they sought surgical intervention and were required to demonstrate changes in dietary habits and physical activity, resulting in preoperative weight loss over approximately 8–10 months prior to the study inclusion. The study did not take into account the effect of medication taken for metabolic syndrome diseases. Lastly, reliable medical records regarding the duration of obesity were lacking.
Conclusions
Our paper demonstrates that patients with severe obesity experience premature aging in terms of telomere length and metabolic age. The level of inflammation is higher in the patients with obesity vs controls, and even higher in those with class IV obesity. The findings suggest that premature aging in individuals with obesity should be considered as progressing in nonlinear manner.
- Salvestrini V, Sell C, Lorenzini A. Obesity may accelerate the aging process. Front Endocrinol (Lausanne). 2019; 10: 266. | Crossref
- López‑Otín C, Blasco MA, Partridge L, et al. The hallmarks of aging. Cell. 2013; 153: 1194‑1217. | Crossref
- Wysoczańska B. Maintaining telomere length [in Polish]. Postepy Hig Med Dosw (online). 2013; 67: 1319‑1330. | Crossref
- Von Zglinicki T, Martin‑Ruiz CM, Saretzki G. Telomeres, cell senescence and human ageing. Signal Transduct. 2005; 5: 103‑114. | Crossref
- Bhayadia R, Schmidt BMW, Melk A, Hömme M. Senescence‑induced oxidative stress causes endothelial dysfunction. J Gerontol A Biol Sci Med Sci. 2016; 71: 161‑169. | Crossref
ARTICLE INFORMATION