Progression of interstitial fibrosis in apical segments in hypertrophic cardiomyopathy: a longitudinal magnetic resonance study

 CC BY 4.0
Progression of interstitial fibrosis in apical segments in hypertrophic cardiomyopathy: a longitudinal magnetic resonance study
Introduction
Hypertrophic cardiomyopathy (HCM) is the most prevalent type of cardiomyopathy.1 In more than half of HCM cases, pathogenic or likely pathogenic variants in sarcomere protein genes can be identified, whereas in minority of patients HCM results from congenital malformation syndromes or inborn errors of metabolism.2-4 The pathology of HCM involves myocyte hypertrophy and disarray, ischemia due to perfusion defects and microvascular dysfunction, and fibrosis, which is a proven substrate for arrythmias.5 While the assumption that fibrosis in HCM follows a progressive course is widely accepted, it is only recently that empirical support for this idea, at least with respect to replacement fibrosis, has materialized, through a limited number of mid‑size retrospective studies involving varying time intervals between 2 successive cardiac magnetic resonance (CMR) scans.6-10 However, a more comprehensive investigation into the so‑called “natural history” of interstitial (diffuse) fibrosis in HCM has not hitherto been undertaken. Therefore, the aim of this study was to examine the trajectory of interstitial fibrosis over 1‑year follow‑up in individuals with HCM.
Patients and methods
This prospective, single‑center observational study involved 50 stable HCM patients enrolled between December 2019 and April 2020.11 HCM was diagnosed according to the guidelines12, and exclusion criteria comprised cardiac devices, reduced kidney function (glomerular filtration rate <30 ml/min/1.73 m2), or HCM phenocopies, such as amyloidosis, Fabry disease, etc.1,12 The study protocol involved acquisition of a baseline (CMR‑1) image followed by another 1 year later (CMR‑2). The study was conducted according to the Declaration of Helsinki. Approval for the protocol was obtained from the Jagiellonian University (1072.6120.237.2019), and all participants provided their written informed consent.
The CMR examinations were performed with a 3.0‑T scanner (Magnetom Skyra, Siemens, Erlangen, Germany). Sequential short‑axis slices encompassing the entire left ventricle (LV) and 3 long‑axis slices (2-, 3-, and 4‑chamber views) were obtained via steady‑state free precession cine imaging. The CMR images were analyzed based on the guidelines of the Society of Cardiovascular Magnetic Resonance.13 The CMR protocol included cine CMR, native and post‑contrast T1 mapping, and late gadolinium enhancement (LGE) imaging.11,13 The analyses were conducted with Syngo.VIA software, version VB 40 (Siemens, Erlangen, Germany). The LV was divided into a 16‑segment American Heart Association (AHA) model. Cardiac volumetric and functional parameters were quantified based on manual delineation of the endocardial and epicardial boundaries, employing a contiguous stack of short‑axis slice cine images. Consecutive short‑axis LGE images encompassing the entire LV were acquired 15 minutes following intravenous administration of a gadolinium‑based contrast agent (0.1 mmol/kg of body weight). Confirmation of replacement fibrosis was contingent on the presence of LGE in both short- and orthogonal long‑axis images. Quantitative LGE assessments were performed utilizing the 3SD technique, with LGE extent calculated as the ratio of LV to LGE mass, expressed as a percentage. Determination of LGE presence was adjudicated by 2 CMR‑certified radiologists (MU‑Z and MK) blinded to the patient identifiers. T1 mapping was performed using the modified look‑locker inversion‑recovery sequence, employing the following sequence: breath‑hold repetition time / time to echo of 281/1.1 milliseconds, slice thickness of 8 mm, field of vision (FOV) from 320 × 260 mm2, matrix of 144 × 256 pixels, and a flip angle of 35 °. Native and postcontrast T1 times were measured within each segment and the central LV cavity for the blood pools. The global native and postcontrast T1 times were computed as a mean across all 16 AHA segments (assessments carried out in a blinded fashion by a CMR‑certified medical physicist, PB). The global values of native and postcontrast T1 times were computed as a mean of all segments. Extracellular volume (ECV) was calculated with the formula: ECV = (1/[postcontrast T1] − 1/[native T1])/(1/[blood postcontrast T1] − 1/[blood native T1]) × (1 − hematocrit).
Statistical analysis
Normal distribution was assessed with the Shapiro–Wilk test. All values are presented as mean (SD), median (interquartile range [IQR]) or percentages (counts). Statistical comparisons between CMR‑1 and CMR‑2 parameters were carried out through paired t tests and the Wilcoxon signed‑rank tests. The χ2 test was used for qualitative parameters. Significance was established when the P value was below 0.05, and the statistical analysis was performed with the Statistica package, version 13.3 (StatSoft, TIBCO Software Inc., Palo Alto, California, United States).
Results
Fifty HCM patients (mean [SD] age, 51.7 [14.3] years; 35 men; New York Health Association class, 1.6 [1.04]; maximal wall thickness, 19.7 [4.9] mm; maximal outflow tract gradient, 41.2 [20.7] mm Hg; N‑terminal pro–Btype natriuretic peptide, 967.2 [1268.9] pg/ml; HCM‑SCD risk‑score, 3.65 [3.07]%; 44 on β-blockers) underwent consecutive CMR at a mean (SD) time difference of 12.3 (1.4) months. Baseline and follow‑up hematocrit values were similar (41.8 [4.5]% vs 41.3 [5.2]%; P = 0.78; reference range, 40%–54%). LV end‑systolic and end‑diastolic volumes (54.1 [23.6] vs 51.5 [18.2] ml; P = 0.33 and 156.3 [35.1] vs 157.4 [33.7] ml; P = 0.67; respectively), ejection fraction (66.1 [12.2]% vs 67.4 [8.7]%; P = 0.13), and LV mass (195.3 [54.5] vs 199.9 [55] g; P = 0.29) showed no differences between CMR‑1 and CMR‑2. Similarly, mean (SD) LGE presence (37 [74]% vs 38 [76]%; P = 0.82), LGE mass (8.7 [9.1] vs 10.3 [11.3] g; P = 0.19), and LGE extent (6.4 [5.1]% vs 7.2 [5.7]%; P = 0.34) remained stable.
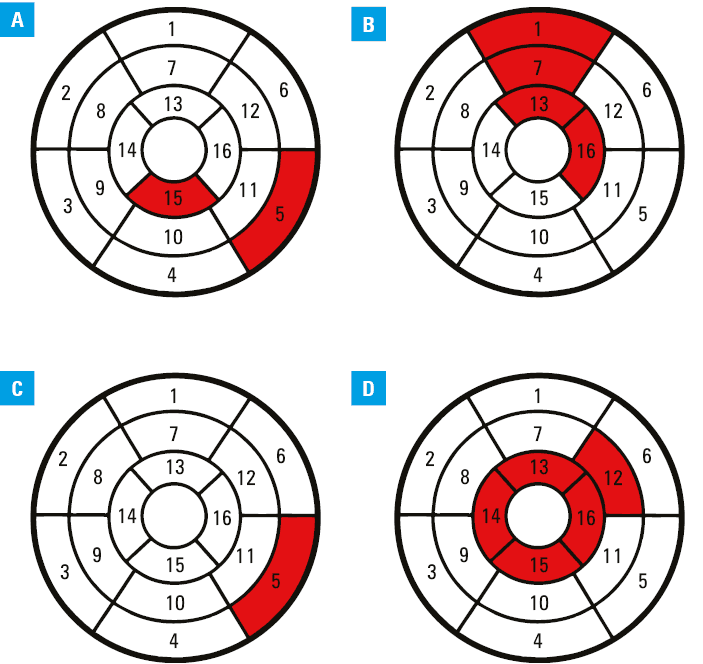
The median (IRQ) or mean (SD) values from 16 AHA segments of native and postcontrast myocardial T1 times (1260.4 [1235.1–1306.4] vs 1289.2 [1232–1400] ms; P = 0.49 and 469.1 [56.5] vs 452.7 [47.2] ms; P = 0.08), T2 times (45.1 [28.3] vs 40 [12.3] ms; P = 0.26), native and postcontrast blood T1 times (1846.3 [1804–1919.3] vs 1893.5 [1813.5–1949.3] ms; P = 0.73 and 300.1 [60.6] vs 308.1 [38.5] ms; P = 0.44), and ECV (28.9 [6.1]% vs 29.7 [5.1]%; P = 0.12) remained unchanged. However, changes were observed in certain segments, namely: median (IQR) native T1 time in the basal inferolateral and apical inferior segment (1285.5 [1227–1363.8] vs 1376.5 [1303–1490] ms; P <0.001 and 1259 [1207–1314] vs 1345 [1278–1450] ms; P <0.001), mean (SD) postcontrast T1 time in the basal‑anterior, midanterior, apical‑anterior, and apical‑lateral segments (451.6 [97.3] vs 422.4 [75.4] ms; P = 0.042; 451.9 [84.8] vs 427.8 [72.2] ms; P = 0.043; 456.8 [69.7] vs 432.2 [63.4] ms; P = 0.046, and 468.4 [72.1] vs 447.7 [54.5] ms; P = 0.048, respectively), T2 time in the basal inferolateral segment (42.3 [3.6] vs 40.8 [4.2] ms; P = 0.045), and ECV in the midantero‑lateral segment (26.4 [5.7]% vs 28.2 [6.5]%; P = 0.044), and all apical segments: anterior, septal, inferior, and lateral (27.7 [24.3–30.7]% vs 29.1 [24.8–45]%; P = 0.045; 28.6 [6.9]% vs 29.9 [5.2]%; P = 0.043; 25.8 [24–28.4]% vs 27.8 [24.7–40.6]%; P = 0.043, and 29.5 [10.2]% vs 33.6 [4.9]%; P = 0.032, respectively). Finally, the mean (SD) from baseline and follow‑up image of the 4 apical segments also showed a difference (28.8 [7.7]% vs 30.9 [4.8]%; P = 0.02; Figure 1). Of note, median (IQR) wall thickness of the 4 apical segments did not change during the observation period (anterior, 6.7 [6.5–8.2] vs 7.3 [6.6–9.05] mm; P = 0.11; septal, 8.7 [6.9–12.3] vs 9.3 [7.1–13.6] mm; P = 0.72; inferior, 7.3 [6.7–8.8] vs 8.2 [7–8.5] mm; P = 0.72; and lateral, 6.5 [5.8–6.7] vs 6.7 [6.5–9] mm; P = 0.24).
Discussion
Although not strictly concentrated on fibrosis, Habib et al14 reported on significant progression of LV mass and wall thickness in 214 patients with nonapical HCM who underwent 2 sequential CMR scans separated by a mean (SD) interval of 4.8 (2.1) years, clearly showing that HCM is a dynamic disease. Previously published studies on the course of fibrosis, involving populations ranging from 31 to 105 patients, uniformly reported progression of replacement fibrosis, expressed as LGE mass or extent.6-10 While we identified only 1 patient with development of new LGE, likely attributable to a shorter study duration, we did not observe progression of LGE mass or extent. Interestingly, Todiere et al8 reported a more substantial increase in LGE extent in the apical segments, whereas Choi et al9 observed greater LGE progression in nonapical HCM (0.15% per month) vs apical HCM (0.025% per month). Our study confirmed progression of interstitial fibrosis, expressed as ECV, solely in the apical segments. Based on these preliminary data, it is plausible to speculate that both replacement and interstitial fibrosis progression are nonhomogeneous throughout the hypertrophied myocardium. The retrospective design of previous studies somewhat limits their scientific robustness, as only the patients who, for various reasons, underwent follow‑up CMR, were enrolled. Contrary to that, our study included the entire group of recruited patients who had undergone control CMR, independent of any clinical indications, at equal time intervals (SD of only 1.4 months vs 174 days to 2.8 years in the referenced studies). As fibrosis is considered a new therapeutic target, it seems reasonable to take these findings into account in designing trials examining novel antifibrotic compounds, as relative “failure” of previous trials could have partially stemmed from the underappreciation of the “natural history” of fibrosis.15
Limitations of our study, including its single‑center nature, a modest sample size, and a brief observation period, warrant acknowledgment. Owing to a low number of events, typical of HCM, no outcome analyses were performed.16
In conclusion, while global indices of interstitial fibrosis exhibited stability, a noteworthy progression of diffuse fibrosis was identified in the apical segments, indicating potential heterogeneity in the course of interstitial fibrosis in HCM. Subsequent confirmation of these findings necessitates more extensive longitudinal studies.
- Arbelo E, Protonotarios A, Gimeno JR, et al. 2023 ESC Guidelines for the management of cardiomyopathies. Eur Heart J. 2023; 44: 3503‑3626.
- Lipari M, Wypasek E, Karpiński M, et al. Identification of a variant hotspot in MYBPC3 and of a novel CSRP3 autosomal recessive alteration in a cohort of Polish patients with hypertrophic cardiomyopathy. Pol Arch Intern Med. 2020; 130: 89‑99. | Crossref
- Osadnik T, Frycz‑Kurek A, Lejawa M, et al. Genotype‑phenotype correlations in Polish patients with hypertrophic cardiomyopathy: preliminary report. Kardiol Pol. 2022; 80: 482‑484. | Crossref
- Susuł M, Petkow‑Dimitrow P, Rajtar‑Salwa R. Genetically confirmed transthyretin amyloidosis primarily diagnosed as hypertrophic cardiomyopathy. Pol Arch Intern Med. 2022; 132: 16163. | Crossref
- Borodzicz‑Jazdzyk S, de Mooij GW, van Loon RB, et al. Microvascular dysfunction in hypertrophic cardiomyopathy: diagnostic role of noninvasive, fully automated quantitative perfusion cardiovascular magnetic resonance imaging. Pol Arch Intern Med. 2024; 134: 16603. | Crossref
ARTICLE INFORMATION