High-dose atorvastatin and rosuvastatin reduce the levels of neutrophil extracellular trap–related proteins in coronary artery disease: association with prothrombotic state
Key words: coronary artery disease, fibrin clot, neutrophil extracellular traps, statin, thrombin generation

 CC BY 4.0
High-dose atorvastatin and rosuvastatin reduce the levels of neutrophil extracellular trap–related proteins in coronary artery disease: association with prothrombotic state
Introduction: Neutrophil extracellular trap (NET) formation is involved in atherothrombosis.
Objectives: We sought to investigate whether statins affect neutrophil extracellular traps activation and release (NETosis) in coronary artery disease (CAD), and whether such changes show associations with statin‑induced additional effects.
Patients and methods: We studied 130 patients with advanced CAD before and at least 6 months after initiation of high‑dose statin therapy with rosuvastatin 40 mg/d or atorvastatin 80 mg/d. The levels of circulating citrullinated histone H3 (H3cit), myeloperoxidase (MPO), and neutrophil elastase (NE) were assessed as proteins associated with NETosis along with thrombin generation, plasma clot permeability (Ks), clot lysis time (CLT), and fibrinolysis inhibitors.
Results: Following statin therapy intensification, we observed reduced accumulation of H3cit (–30.4%), MPO (–28.1%), and NE (–25.5%; all P <0.001), all not associated with low‑density lipoprotein cholesterol (LDL‑C) lowering (–25%). However, H3cit level was lower in 50 patients (38.5%) who achieved the target LDL‑C below 1.8 mmol/l (–16.5%; P = 0.004), and in 19 patients (14.6%) with LDL‑C below 1.4 mmol/l (–25.5%; P = 0.001), as compared with the remaining individuals. The reductions in H3cit and MPO levels were associated with a 42.9% decrease in C‑reactive protein (CRP) level on high‑dose statins (R = 0.855; P <0.001 and R = 0.25; P = 0.004, respectively), along with increases in Ks and reduction in thrombin activatable fibrinolysis inhibitor (TAFI) activity, but not with CLT or thrombin generation (all |R|, 0.24–0.4; P <0.01). In multivariable analysis, changes in CRP (β = 0.771; P <0.001), TAFI activity (β = 0.125; P = 0.013), and fibrinogen level (β = 0.106; P = 0.034) were independently associated with a decrease in H3cit concentration.
Conclusions: We showed for the first time that high‑dose statins can reduce the level of NET‑related proteins in association with anti‑inflammatory and antithrombotic actions in CAD patients.
What's new?
Neutrophil extracellular trap (NET) formation has not been explored in patients on statins and with coronary artery disease. We have demonstrated for the first time that high‑dose statin treatment can decrease neutrophil extracellular traps activation and release (NETosis)-related proteins, and this phenomenon shows no direct associations with cholesterol‑lowering effects, but with anti‑inflammatory activity of these medications. Reduced accumulation of NET‑related proteins was linked with formation of looser fibrin networks displaying higher susceptibility to lysis, with a particular impact on reduced thrombin activatable fibrinolysis inhibitor activity on high‑dose statins. Our results suggest a novel NETosis‑associated action of high‑dose statins, which might contribute to their beneficial properties.
Introduction
Formation of neutrophil extracellular traps (NETs) is an additional mechanism, apart from phagocytosis, degranulation, and reactive oxygen species generation, by which neutrophils fight microorganisms.1,2 In 2004, Brinkmann et al3 showed for the first time that activation of neutrophils can induce DNA release. Apart from extracellular chromatin, NETs include citrullinated histone H3 (H3cit), myeloperoxidase (MPO), neutrophil elastase (NE), cathepsin G, and peptidyl arginine deaminase 4 (PAD4) responsible for citrullination of histones.4
NET formation is considered an important mediator of the innate immunity contributing to atherosclerosis and atherothrombosis, with robust evidence for its role in coronary artery disease (CAD).4 In 2012, Megens et al5 reported the presence of NE in the luminal region of the atherosclerotic plaques obtained by endarterectomy. Borissoff et al6 provided convincing evidence that NETs contribute to the progression of atherosclerosis by showing associations between NET‑related proteins (NET‑related structures, nucleosomes, MPO‑DNA complexes) and CAD advancement, prothrombotic state, and adverse cardiac events. NETs have also been reported to be present in intracoronary thrombi.7 NETs have been demonstrated to be positively related with the no‑reflow phenomenon, infarct size, and negatively with ST‑segment resolution in acute myocardial infarction (AMI).7 Less is known about clinical relevance of NETs in chronic coronary syndromes.4
The additional effects of statins, traditionally defined as independent of cholesterol‑lowering actions, encompass reduced inflammatory response, improved endothelial function and nitric oxide bioavailability, regulation of angiogenesis, suppression of blood coagulation, or enhancement of fibrinolysis.8 To the best of our knowledge, the effect of statins on the levels of NET‑related proteins in patients with atherosclerotic vascular disease has not been demonstrated so far. In their preclinical study conducted on postburn mice, Al‑Ghoul et al9 demonstrated that simvastatin 0.2 mg/kg reduced MPO level in circulating blood, peritoneal lavage, the ileum, and colon mucosa. In addition, simvastatin lowered in vitro NET formation by isolated neutrophils. Chen et al10 have shown that simvastatin reduces the levels of H3cit, PAD4, and PAD4 mRNA in a murine model of severe asthma. In a randomized controlled trial, simvastatin 80 mg administrated for 7 days in 32 patients with community‑acquired pneumonia and sepsis has been reported to significantly reduce neutrophil migration, apoptosis, and NE activity, which was associated with clinical improvement.11 It is unknown whether similar effects could be observed in patients with CAD.12
We sought to assess whether in high‑risk stable CAD patients the use of high‑dose statins can lower the levels of circulating NET‑related proteins, and if such changes are associated with alterations of the prothrombotic state.
Patients and methods
Patients
This cohort study evaluated 130 consecutive patients with CAD who did not achieve the therapeutic goals of hypercholesterolemia therapy. This group was described in our previous work.13 In brief, from January 2015 to February 2016, we enrolled 130 patients with prior ST‑segment elevation MI or non–ST‑segment elevation MI, coronary artery bypass grafting surgery or stenosis of more than 50% in at least 2 epicardial coronary arteries on coronary angiography.8 All patients were initially treated with statins (simvastatin 20 mg/d, atorvastatin 10 mg/d or 20 mg/d, or rosuvastatin 10 mg/d). The eligible patients had low‑density lipoprotein cholesterol (LDL‑C) level above 1.8 mmol/l or below 50% reduction in LDL‑C, if its baseline level was between 1.8 and 3.5 mmol/l, as recommended in the 2016 European guidelines14. The exclusion criteria were: AMI or percutaneous coronary intervention within preceding 6 months, end‑stage renal disease, active cancer, signs of acute infection, chronic inflammatory disease, and treatment with other lipid‑lowering agents, for example, ezetimibe or fibrates.15
Intervention
All patients were switched to high‑dose statin therapy (atorvastatin 80 mg/d or rosuvastatin 40 mg/d at the discretion of the investigators) and were treated for a minimum of 6 months (up to 12 months). The study protocol was approved by the Jagiellonian University Medical College Ethical Committee (1072.6120.59.2018), and the participants provided their informed written consent in accordance with the Declaration of Helsinki.
Laboratory investigations
At enrollment and after 6‑month therapy with high‑dose statins, blood was drawn after the overnight fast from the antecubital vein into either citrated tubes and centrifuged at 2500 g at 20 °C for 20 minutes or into serum tubes and centrifuged at 1600 g at 4 °C for 10 minutes. Serum total cholesterol (TC), LDL‑C, high‑density lipoprotein cholesterol (HDL‑C), and triglycerides were assayed using a biochemical analyzer Cobas 6000 (Roche Diagnostics GmbH, Mannheim, Germany). Non–HDL‑C was calculated as TC minus HDL‑C. C‑reactive protein (CRP) was measured by immunoturbidimetry (Roche Diagnostics GmbH) and D‑dimer with the Innovance D‑dimer assay (Siemens Healthcare, Marburg, Germany). Fibrinogen was determined using the von Clauss method.
Neutrophil extracellular trap–related proteins
Immunoenzymatic assays were used to determine serum levels of H3cit, MPO, and NE according to the manufacturer’s protocols (Cayman Chemical, Ann Arbor, Michigan, United States). The reference ranges for H3cit and MPO in our laboratory were 0.5–1.7 ng/ml and 0.13–0.43 ng/ml, respectively.16
Fibrin clot analysis
Fibrin clot permeability was measured as described previously.17 Briefly, citrated plasma was mixed with 20 mmol/l calcium chloride and 1 U/ml human thrombin (Sigma‑Aldrich, St. Louis, Missouri, United States). The buffer volume flowing through the clots was measured within 60 minutes. The Ks, which indicates the average pore size in fibrin networks (lower values indicate more compact fibrin structure), was calculated. The reference range of Ks established in our laboratory is 7.7–9.7 × 10⁻⁹ cm2.
Fibrinolysis
Clot lysis time (CLT) was measured as previously described.17 Briefly, citrated plasma was mixed with calcium chloride (15 mM), human tissue factor (0.6 pM; Innovin, Siemens Healthcare), phospholipid vesicles (12 µM), and recombinant tissue type plasminogen activator (rtPA, 60 ng/ml; Boehringer Ingelheim, Ingelheim, Germany). CLT was defined as the time from the midpoint of the clear‑to‑maximum‑turbid transition, which represents a clot formation, to the midpoint of the maximum‑turbid‑to‑clear transition (representing the clot lysis). The reference range of CLT established in our laboratory for 50 apparently healthy subjects is 61–80 minutes.
Moreover, thrombin activatable fibrinolysis inhibitor (TAFI) activity (Hyphen‑Biomed, Neuville‑Sur‑Oise, France) and α2‑antiplasmin (Berichrom, Siemens Healthcare Diagnostics, Marburg, Germany) were measured.17
Thrombin generation potential
Plasma thrombogenic potential was assessed using calibrated automated thrombography (CAT; Thrombinoscope BV, Maastricht, the Netherlands), using dedicated reagents (Stago, Asnieres sur Seine, France) in a 96‑well plate fluorometer (Ascent Reader, Thermolab Systems OY, Helsinki, Finland).17 The area under the curve represented the endogenous thrombin potential (ETP).16
Statistical analysis
Based on the previous data,9-11 this study was powered to have an 80% chance to detect a 20% reduction in H3cit level at a P value of 0.05. To show such a difference or greater, at least 64 patients were required.
Depending on the variable type, they were presented as numbers and percentages or median and interquartile range (IQR). Normality was assessed by the Shapiro–Wilk test. Differences between the groups were compared using the t test for normally distributed variables or the Mann–Whitney test for non‑normally distributed variables. Categorical variables were compared with the Pearson χ2 test or the Fisher exact test. Associations between nonparametric variables were assessed by the Spearman rank correlation coefficient. All independent variables potentially associated with the change of NET‑related protein level or with achievement of final LDL‑C concentration following statin therapy intensification were included in the multivariable linear or logistic regression model, respectively, to identify their independent determinants. Comorbidities, pharmacological treatment, D‑dimer, ETP, Ks, CLT as well as platelet and neutrophil levels were selected as potentially important confounding factors. A 2‑sided P value below 0.05 was considered significant. All statistical analyses were performed using Statistica software, version 13.3 (StatSoft, Kraków, Poland) or IBM SPSS Statistics, version 26.0 (IBM Corp, Armonk, New York, United States).
Results
We studied 130 advanced CAD patients (48.5% men) at a median (IQR) age of 64 (59–70) years who presented a typical distribution of classic cardiovascular risk factors and pharmacological treatment (Table 1).
Parameter | Before high‑dose statin treatment (n = 130) | After high‑dose statin treatment (n = 130) | P value |
Abbreviations: ACEI, angiotensin‑converting enzyme inhibitor; ASA, acetylsalicylic acid; CABG, coronary artery bypass graft; CLT, plasma clot lysis time; CRP, C‑reactive protein; ETP, endogenous thrombin potential; H3cit, citrullinated histone H3; HDL‑C, high‑density lipoprotein cholesterol; Ks, plasma fibrin clot permeability; LDL‑C, low‑density lipoprotein cholesterol; MPO, myeloperoxidase; TAFI, thrombin activatable fibrinolysis inhibitor | |||
Age, y | 64 (59–70) | – | |
Men, n (%) | 63 (48.5) | – | |
Comorbidities, n (%) | |||
Prior myocardial infarction | 97 (74.6) | – | |
Prior CABG | 32 (24.6) | – | |
Arterial hypertension | 77 (59.2) | – | |
Diabetes mellitus | 33 (25.4) | – | |
Obesity | 44 (33.8) | – | |
Current smoking | 43 (33.1) | – | |
Treatment, n (%) | |||
ASA | 119 (91.5) | – | |
Statin | 130 (100) | – | |
ACEI | 52 (40) | – | |
β-Blocker | 56 (43.1) | – | |
Lipid profile, mmol/l | |||
Total cholesterol | 5 (4.5–5.7) | 4.3 (3.3–5.2) | <0.001 |
LDL‑C | 3.2 (2.7–3.7) | 2.4 (1.5–3.3) | <0.001 |
HDL‑C | 1.5 (1.3–1.8) | 1.3 (1–1.7) | <0.001 |
Non–HDL‑C | 3.4 (2.9–3.9) | 2.8 (1.8–3.8) | <0.001 |
Triglycerides | 1.1 (0.8–1.4) | 1.1 (0.8–1.5) | 0.54 |
Coagulation and fibrinolysis variables | |||
Fibrinogen, g/l | 3 (2.5–3.7) | 2.8 (2.4–3.2) | 0.01 |
D‑dimer, ng/ml | 310 (236–411) | 240 (205–298) | <0.001 |
ETP, nM × min | 1591 (129) | 1560 (138) | 0.07 |
α2‑antiplasmin, % | 105 (96–114) | 106 (96–113) | 0.94 |
TAFI activity, % | 100 (90–111) | 92 (85–99) | <0.001 |
Ks, 10–9 cm2 | 7 (6.3–7.8) | 7.9 (7–9.3) | <0.001 |
CLT, min | 90 (78–102) | 80 (67–92) | <0.001 |
Other parameters | |||
CRP, mg/l | 2.8 (2.0–3.6) | 1.6 (1.2–2.3) | <0.001 |
Platelets, 103/µl | 239 (205–292) | 234 (202–305) | 0.9 |
Neutrophils, 103/µl | 3.7 (3.1–4.1) | 3.5 (2.9–4) | 0.11 |
H3cit, ng/ml | 2.63 (2.05–3.31) | 1.83 (1.43–2.45) | <0.001 |
MPO, ng/ml | 24.93 (20.99–28.26) | 17.93 (15.38–20.35) | <0.001 |
Neutrophil elastase, ng/ml | 39.75 (37.6–41.4) | 29.6 (28–31.3) | <0.001 |
At baseline, a median (IQR) LDL‑C level was 3.2 (2.7–3.7) mmol/l (Table 1). Twenty‑one patients (16.2%) were on simvastatin 20 mg/d, 23 (17.7%) on atorvastatin 20 mg/d, and 17 (13.1%) on atorvastatin 10 mg/d. Rosuvastatin 10 mg/d and 5 mg/d was used in 62 (47.7%) and 7 (5.4%) patients, respectively. There were no differences related to the type or dose of statins with regard to lipid profile at baseline (all P >0.05).
Baseline
As compared with our reference ranges, 120 CAD patients (92.3%) had elevated H3cit with a median (IQR) concentration of 2.63 ng/ml (2.05–3.31). H3cit level positively correlated with MPO (R = 0.543; P <0.001) but not with NE. The concentration of NETosis‑related proteins did not differ in relation to demographics, cardiovascular risk factors, the type and daily dose of statins, lipid profile, or neutrophil count. Moreover, the levels of the NETosis‑related proteins were similar in patients with LDL‑C above 3 mmol/l and those with its lower concentrations. H3cit was positively associated with CRP (R = 0.54; P <0.001), but not with fibrinogen.
An analysis of fibrin clot variables showed that all 3 NETosis‑related proteins inversely and weakly correlated with Ks (H3cit, R = –0.251; P = 0.004; MPO, R = –0.492; P <0.001; NE, R = –0.214; P = 0.014), but not with CLT, thrombin generation, or fibrinolysis inhibitors.
High‑dose statin treatment
After high‑dose statin treatment, we observed a 14% reduction in TC, a 25% decrease in LDL‑C, along with a decrease in CRP (–42.9%; P <0.001), D‑dimer (–22.6%; P <0.001), and fibrinogen levels (–6.7%; P = 0.014) (Table 1). High‑dose statin therapy resulted in by 12.9% higher Ks (P <0.001) and improved susceptibility to fibrinolysis, reflected by 11.1% shorter CLT (P <0.001) and 8% lower TAFI activity (P <0.001).
Intensification of statin treatment markedly reduced the level of H3cit (30.4%), MPO (28.1%), and NE (25.5%), as compared with baseline (Figure 1), while neutrophil count remained unchanged (Table 1). Of note, in 53 patients (40.8%) the on‑treatment H3cit concentrations were within the reference range. H3cit and MPO levels correlated with each other (R = 0.526; P <0.001), similarly as at baseline, and showed associations with residual plasma CRP (R = 0.68; P <0.001 and R = 0.253; P = 0.004, respectively). The ΔH3cit and ΔMPO were associated with each other (R = 0.413; P <0.001), but neither of them was associated with ΔNE.
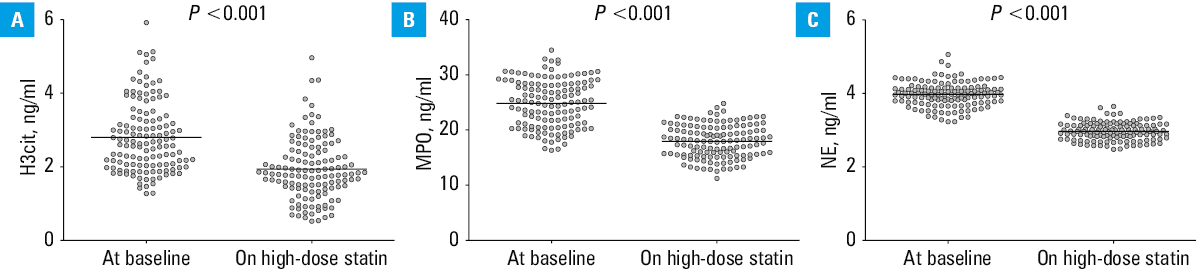
Abbreviations: NE, neutrophil elastase; others, see Table 1
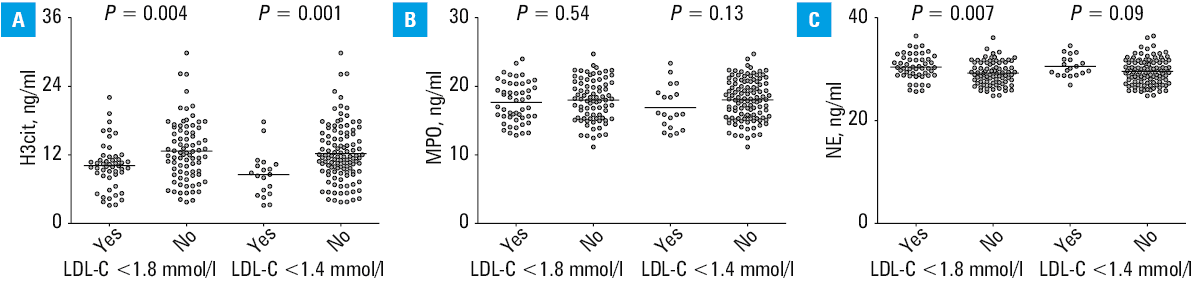
ΔLDL‑C, ΔTC, and Δnon–HDL‑C did not correlate with the magnitude of changes in NETosis‑related proteins. However, H3cit level was lower by 16.5% (P = 0.004) in the patients who achieved the target LDL‑C below 1.8 mmol/l (n = 50; 38.5%), and the reduction was even greater (by 25.5%; P = 0.001) in the patients with LDL‑C below 1.4 mmol/l (n = 19; 14.6%), as compared with the remaining participants (Figure 2A). No similar observations were made for MPO (Figure 2B), while NE was slightly, though significantly, higher in the patients with LDL‑C below 1.8 mmol/l (Figure 2C). Baseline levels of H3cit, MPO, and NE did not identify the individuals who achieved LDL‑C below 1.4 mmol/l or below 1.8 mmol/l after therapy intensification. The best discriminative value in the prediction of LDL‑C below 1.4 mmol/l was provided by H3cit concentrations measured at 6‑month high‑dose statin therapy, with sensitivity of 55%, specificity of 80%, and Youden index of 0.444 (Figure 3).
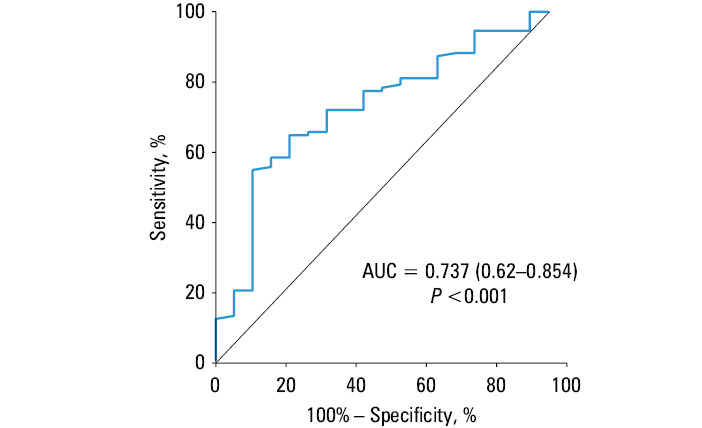
Abbreviations: AUC, area under the curve
ΔH3cit was strongly associated with ΔCRP and weakly with ΔMPO (Figure 4A and 4B). Interestingly, ΔH3cit and ΔMPO, in contrast to ΔNE, positively correlated with ΔTAFI (Figure 4C and 4D), but not with ΔCLT, and inversely correlated with an increase in Ks (Figure 4E and 4F).
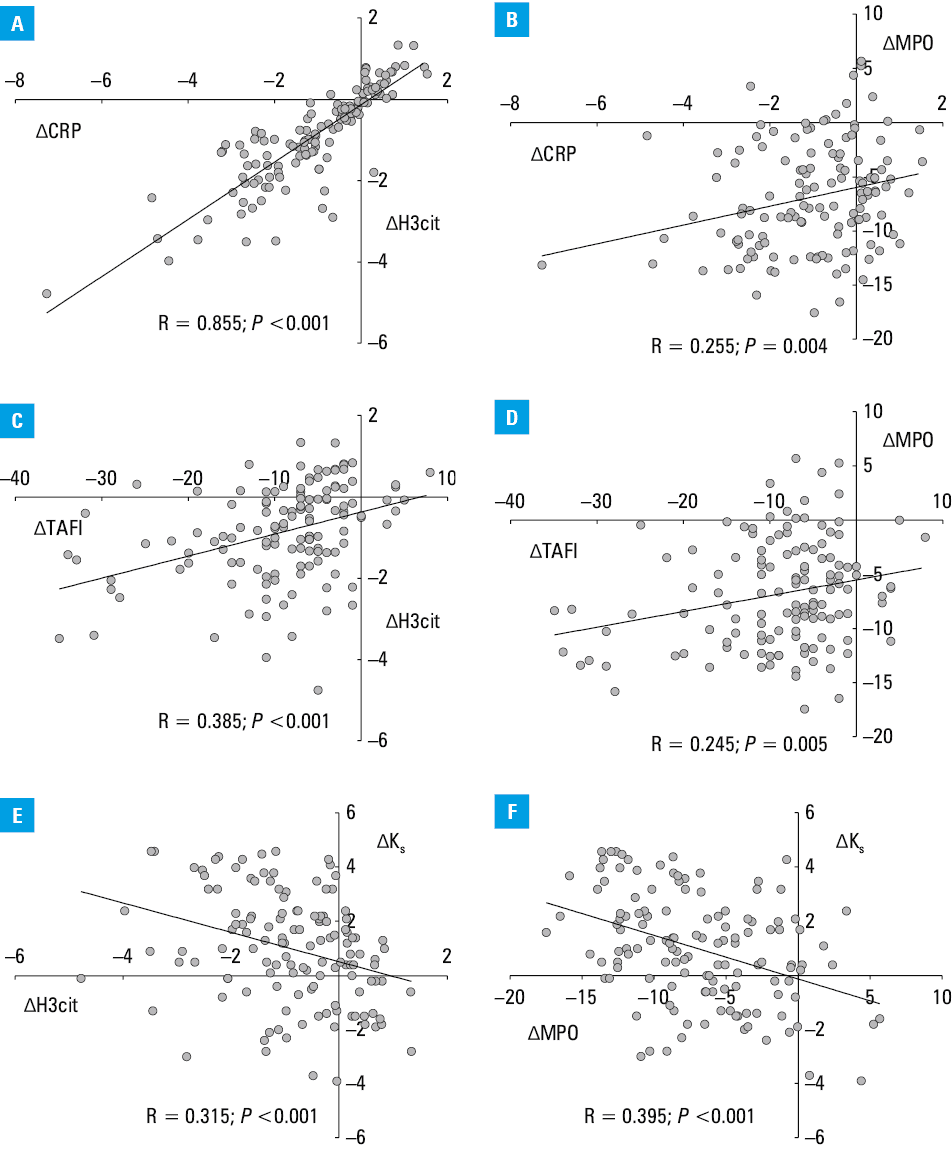
Abbreviations: see Table 1
Multivariable analyses
The best multivariable model among all that incorporated NET‑related proteins was created for H3cit (R2 = 0.75; P <0.001; Table 2). We found that a decrease in H3cit level on high‑dose statins was independently associated with ΔCRP (β = 0.771; P <0.001), ΔTAFI (β = 0.125; P = 0.013), and Δfibrinogen (β = 0.106; P = 0.034) but not with ΔLDL‑C (Table 2).
Moreover, in the multivariable logistic regression analysis, male sex, diabetes mellitus, smoking, lower baseline CRP level, and lower H3cit level at 6 months of intensive statin therapy were independently associated with the final LDL‑C below 1.4 mmol/l (R2 = 0.463; Table 3).
Parametera | Univariable model | Multivariable model | ||||
OR | 95% CI | P value | OR | 95% CI | P value | |
Abbreviations: OR, odds ratio; others, see Table 1
a R2 =0.463 | ||||||
Age, y | 0.91 | 0.842–0.984 | 0.02 | 0.952 | 0.867–1.046 | 0.31 |
Men, 0/1 | 4.922 | 1.535–15.781 | 0.007 | 14.499 | 3.12–67.381 | <0.001 |
Diabetes mellitus, 0/1 | 2.502 | 0.908–6.895 | 0.08 | 4.383 | 3.12–17.016 | 0.03 |
Smoking, 0/1 | 2.626 | 0.978–7.056 | 0.055 | 6.18 | 1.528–25.003 | 0.01 |
CRP, mg/l | 0.803 | 0.505–1.277 | 0.35 | 0.504 | 0.268–0.949 | 0.03 |
Residual H3cit, ng/ml | 0.304 | 0.135–0.685 | 0.004 | 0.13 | 0.037–0.455 | 0.001 |
Discussion
We have demonstrated for the first time that in stable patients with advanced CAD the currently recommended high‑dose statin treatment can decrease circulating levels of NETosis‑related proteins, and this phenomenon shows no direct associations with cholesterol‑lowering effects, but with anti‑inflammatory actions of these medications. Noteworthy, reduced levels of NET‑related proteins were linked with looser fibrin network structure with higher susceptibility to lysis mediated by the reduced TAFI activity. Our results suggest a novel NETosis‑associated action of statins, providing additional argument for their use at appropriate daily doses.
There is a promising evidence for an important role of NETosis in atherosclerosis and atherothrombosis.4 The main reason for a persistent presence of NET‑related proteins in blood is a direct activation of neutrophils within atherosclerotic plaques by cholesterol microcrystals,4,18 despite no association with the neutrophil count. Major factors promoting the formation of cholesterol microcrystals in the arterial walls represent high blood cholesterol levels and enhanced oxidative stress.18 Warnatsch et al19 have demonstrated that there is a relationship between NETosis and cholesterol microcrystal formation in mice. NETs were required for enhanced interleukin‑1β production by macrophages in the presence of cholesterol crystals that activated Th17 cells.19 However, data on statin‑mediated modulation of those complex processes are sparse. It has been shown that statins can alter cholesterol crystallization, and thus lead to plaque stabilization.20 Moreover, high‑dose statin treatment reduced oxidized phospholipid levels, which are the main inducers of NETosis, as demonstrated in the MIRACL (Myocardial Ischemia Reduction with Aggressive Cholesterol Lowering) trial.21,22 Our results are particularly interesting in this aspect, showing that the anti‑inflammatory role of statins, expressed by a marked decrease in CRP levels, is associated with the reduction of circulating NETosis‑related proteins. So far, several mechanisms underlying multiple anti‑inflammatory actions of statins have been reported, including some related at least indirectly with NETosis.23-25 Interestingly, also proprotein convertase subtilisin / kexin 9 inhibitors, potent cholesterol‑lowering agents, enhance macrophage autophagy in mice, which might suggest that these drugs could suppress NETosis.26 However, this hypothesis requires further studies in human patients. Therefore, taking into account the above data and the known relationship between NETosis and platelets,27 the currently recommended treatment in CAD based on antiplatelet drugs and statins affecting inflammatory processes could be beneficial also in terms of NETosis inhibition.
A novel observation is that high‑dose statin‑induced changes in fibrin clot features might be partly related to lower levels of NETosis‑related proteins in CAD patients. In the in vitro study by Longstaff et al,28 the structure of fibrin clots formed in the presence of NETs was denser and more resistant to lysis, which corresponds with observations from other diseases in which increased levels of NETosis‑related proteins were associated with unfavorably altered fibrin clot properties.29,30 Moreover, as demonstrated recently, the fibrinogen structure is modified through citrullination by PAD derived from stimulated neutrophils.31
TAFI activity and its association with NET‑related proteins following high‑dose statins deserve a comment. It has been demonstrated by several research groups that high‑dose statins reduce TAFI activity.8,32,33 We not only observed lower TAFI activity on high‑dose statins, but also its reduction on high‑dose statins was independently associated with a reduction in H3cit levels, but not with changes in MPO or NE concentrations. It is unclear why reduction in NETosis might affect TAFI activity on statins. It is well known that statins increase endothelial thrombomodulin expression, which might affect TAFI activation.13,34 Moreover, TAFI has an additional anti‑inflammatory role.35 It has been recently reported in mice that statins reduce the levels of activated TAFI, which correlated with the levels of CRP, circulating T cells, and monocytes, but not with ΔTC.36 Given the data on downregulation of activated TAFI and CPB2 gene expression in HepG2 cells mediated by fenofibrate, a peroxisome proliferator‑activated receptor α (PPARα) agonist, PPARα-related mechanism was suggested.36-38 PPARα receptors are expressed in human macrophages, where they exert cholesterol removal, and the anti‑inflammatory effects could be considered as a link between reduced TAFI activity and changes in NET‑related proteins we observed in this study.39 It might be hypothesized that TAFI, through its regulation of fibrinolysis, may affect NET stability via cleaving fibrin lysine residues that are essential for tPA and plasminogen binding to fibrin, attenuating fibrinolysis34 and stabilizing NETs, holding them for a longer period of time at the site of inflammation. However, mechanistic studies on statin‑mediated changes in TAFI activity in diseases associated with enhanced NETosis, such as atherosclerosis, are needed.
Limitations
Our study has several limitations. First, even though it was adequately powered, the number of enrolled CAD patients was limited. Moreover, CAD progression evaluated using invasive and noninvasive diagnostic methods was not assessed during follow‑up; however, clinically evident events were not reported.40 Second, we did not include a control group treated with other statin doses or presenting a different lipid profile, but it is highly unlikely that factors other than implementation of high‑dose statins were responsible for the changes reported at 6 months. Third, it should be recognized that H3cit is not entirely specific to NETosis, since other stimuli or cell types can also lead to histone citrullination.4 MPO‑DNA would be a more specific NETosis marker, however, there are no standardized diagnostic tools to detect such complexes, and the results of the in‑house methods are poorly comparable.16 The associations between NET‑related proteins and prothrombotic markers do not necessarily mean the cause‑effect relationship. In order to understand the mechanism underlying the statin‑induced NET‑related protein reduction and its relationship with coagulation along with fibrinolysis, in vitro studies and animal models should be conducted,19 but our hypothesis‑generating study indicates that such research is worth efforts. Finally, we analyzed only high‑risk CAD patients, and it is unknown whether our observations could be extrapolated to the entire CAD population with less advanced disease, and those treated with other lipid‑lowering agents with anti‑inflammatory properties.41
Conclusions
We demonstrated that high‑dose statin therapy in CAD patients results in decreased levels of circulating NETosis‑related proteins linked with a reduction of CRP and favorable modification of fibrin clot properties. Our study provides evidence for a novel effect of statins, which might contribute to clinical efficacy of cholesterol‑lowering therapy in CAD patients. It remains to be established in large cohort studies whether NETosis reduction can contribute to beneficial effects of high‑dose statins in terms of clinical outcomes in atherosclerotic vascular disease.
- Döring Y, Libby P, Soehnlein O. Neutrophil extracellular traps participate in cardiovascular diseases: recent experimental and clinical insights. Circ Res. 2020; 126: 1228‑1241. | Crossref
- Hidalgo A, Libby P, Soehnlein O, et al. Neutrophil extracellular traps: from physiology to pathology. Cardiovasc Res. 2022; 118: 2737‑2753. | Crossref
- Brinkmann V, Reichard U, Goosmann C, et al. Neutrophil extracellular traps kill bacteria. Science. 2004; 303: 1532‑1535. | Crossref
- Natorska J, Ząbczyk M, Undas A. Neutrophil extracellular traps (NETs) in cardiovascular diseases: from molecular mechanisms to therapeutic interventions. Kardiol Pol. 2023; 81: 1205‑1216. | Crossref
- Megens RT, Vijayan S, Lievens D, et al. Presence of luminal neutrophil extracellular traps in atherosclerosis. Thromb Haemost. 2012; 107: 597‑598. | Crossref
ARTICLE INFORMATION