Prevalence of hyperlipoproteinemia(a) in individuals of European ancestry treated at outpatient cardiology clinics: results from a cross-sectional STAR-Lp(a) study
Key words: cardiovascular risk, epidemiology, hyperlipoproteinemia(a), lipoprotein(a)

 CC BY 4.0
Prevalence of hyperlipoproteinemia(a) in individuals of European ancestry treated at outpatient cardiology clinics: results from a cross-sectional STAR-Lp(a) study
Introduction: Elevated levels of lipoprotein(a) (Lp[a]) are independently associated with an increased risk of cardiovascular disease (CVD).
Objectives: We aimed to evaluate the levels of Lp(a) among patients of European ancestry referred to outpatient cardiology clinics.
Patients and methods: We analyzed 2475 consecutive patients referred to 2 outpatient cardiology clinics between March 2022 and January 2024. Individuals with atherosclerotic CVD, heart failure, significant valve disease, and aortic aneurysm were excluded.
Results: A majority of the study population were women (n = 1724 [69.7%]). The median (interquartile range) age of the participants was 66 (53–73) years. An Lp(a) level greater than or equal to 30 mg/dl (≥75 nmol/l) was recorded in 21.5% and a level greater than or equal to 50 mg/dl (≥125 nmol/l) was recorded in 13.5% of the patients. In univariable analysis, the Lp(a) level was significantly associated with hypertension, sleep apnea, migraine, polycystic ovary syndrome, physical activity level, as well as fasting blood glucose, glycated hemoglobin A1c (HbA1c), low‑density lipoprotein cholesterol (LDL‑C), and non–high‑density lipoprotein cholesterol concentrations. Female sex (β [SE] = 0.06 [0.02]), atrial fibrillation (β [SE] = 0.05 [0.02]), and the levels of HbA1c (β [SE] = 0.14 [0.02]) and LDL‑C (β [SE] = 0.09 [0.02]) were independently related to the level of Lp(a). Atrial fibrillation (odds ratio [OR], 1.8; 95% CI, 1.01–3.19), migraine (OR, 0.51; 95% CI, 0.32–0.83), and hyperlipidemia (OR, 1.56; 95% CI, 1.22–1.99) were related to the Lp(a) level of 30 mg/dl or above (≥75 nmol/l), while female sex (OR, 1.46; 95% CI, 1.10–1.92), hyperlipidemia (OR, 1.49; 95% CI, 1.12–1.97), hypertension (OR, 1.42; 95% CI, 1.1–1.84) and HbA1c concentration (OR, 0.84; 95% CI, 0.72–0.96) were significantly associated with the Lp(a) level greater than or equal to 50 mg/dl (≥125 nmol/l).
Conclusions: The observed prevalence of increased Lp(a) concentration among patients of European ancestry treated at outpatient cardiology clinics was 21.5%. Female sex, hypertension, atrial fibrillation, migraine, and concentrations of LDL‑C and HbA1c were independently related to the level of Lp(a) in this population.
What's new?
This study is the first to assess the level of lipoprotein(a) (Lp[a]) solely among outpatients consulted by cardiologists. Elevated levels of Lp(a) were recorded in 21.5% of the study population, with a median value of 8.5 mg/dl (21.25 nmol/l). The factors independently related to a higher level of Lp(a) were hypertension, atrial fibrillation, glycated hemoglobin A1c concentration, and female sex. Migraine was related to lower levels of Lp(a). Knowledge of factors determining Lp(a) levels in cardiology clinic outpatients is limited. Therefore, our findings have practical implications and fill the research gap in this area from the perspective of cardiovascular risk assessment. The results can assist policymakers in both clinical medicine and evidence‑based health care.
Introduction
Lipoprotein(a) (Lp[a]) is a lipid‑protein complex composed of apolipoprotein B‑100, a molecule similar to low‑density lipoprotein cholesterol (LDL‑C), and apolipoprotein(a).1 Lp(a) is produced in the liver and is responsible for cholesterol and triglyceride transport in the body. Due to its proven atherogenic and proinflammatory properties, Lp(a) contributes to the accumulation of fat in blood vessels, leading to atherosclerosis and increased cardiovascular risk.2,3 Determination of the Lp(a) level is especially helpful in patients with familial hypercholesterolemia, a family history of hyperlipoproteinemia(a), and recurrent cardiovascular events.4-6 It is also recommended in pregnant women as an element of prevention of pre‑eclampsia, miscarriage, recurrent pregnancy loss, and intrauterine growth restriction.7 The optimal Lp(a) level is below 30 mg/dl (<75 nmol/l). Patients who exceed this threshold, and especially those who exceed the level of 50 mg/dl (125 nmol/l), may require appropriate clinical interventions.4,7 Recent research has shed new light on the importance of assessing Lp(a) concentration for cardiovascular health, and scientists are working to improve the understanding of how to lower blood levels of this molecule with targeted therapies.8
In an analysis of the general population of the United States, median levels of Lp(a) among individuals of Black, White, and Mexican American ethnicity were 35 mg/dl (87.5 nmol/l), 12 mg/dl (30 nmol/l), and 8 mg/dl (20 nmol/l), respectively.9 The prevalence of an Lp(a) level greater than or equal to 50 mg/dl (≥125 nmol/l) in the entire study group was 14.7%. Guan et al10 studied 4 ethnic groups in the MESA (Multi‑Ethnic Study of Atherosclerosis) cohort, and reported that the median Lp(a) level among the Whites was 12.9 mg/dl (32.25 nmol/l), with a significantly higher level among the Blacks. The prevalence of the Lp(a) level of 30 mg/dl or above (≥75 nmol/l) and 50 mg/dl or above (≥125 nmol/l) was 24.8% and 14.9% among the Whites and 57.5% and 33% among the Blacks, respectively. Interestingly, the prevalence of the Lp(a) level greater than or equal to 30 mg/dl (≥75 nmol/l) and greater than or equal to 50 mg/dl (≥125 nmol/l) among the patients referred for an assay of the Lp(a) concentration was 35% to 39% and 24% to 29%, respectively.11 Based on the still limited data, the prevalence of the Lp(a) level above 50 mg/dl (>125 nmol/l) in German and Polish patients amounted to 18%, while in Finland, it only reached 6%.12-14 In a small study involving patients with cardiovascular risk factors (the Polish arm of the EUROASPIRE V survey15), the median level of Lp(a) was 9.2 mg/dl (23 nmol/l).
It has been suggested that the level of Lp(a) is predominantly (>90%) determined by genetic factors; however, several other risk factors and conditions, including age, sex, menopause, lifestyle behaviors, and medication, can also be of significant importance.4,14,16 Most patients belonging to the high cardiovascular risk group, including those with high Lp(a) concentrations, are managed in outpatient clinics by cardiologists. However, although the prevalence of hyperlipoproteinemia(a) among outpatients has been previously analyzed, none of these studies was intended to assess the level of Lp(a) solely in patients referred to cardiologists.17,18 In addition, knowledge of factors influencing the levels of Lp(a) in this population is limited. Therefore, this study was designed to evaluate Lp(a) levels in primary prevention patients referred to outpatient cardiology clinics, and to investigate the association between elevated levels of Lp(a) and sociodemographic and health‑related factors. The specific objective was to assess whether sex, age, lifestyle factors, comorbidities, and biochemical parameters had any impact on the level of Lp(a), which, according to the existing data, seems to be mainly genetically determined. However, attention should be focused on in‑depth research on lifestyle changes and control of comorbidities as factors directly or indirectly related to Lp(a) levels.
Patients and methods
The study population comprised the participants of a cross‑sectional STAR (Specialist Care Patients)-Lp(a) study. We prospectively enrolled consecutive primary prevention patients referred to 2 outpatient cardiology clinics. Individuals with atherosclerotic cardiovascular disease (ASCVD), heart failure (HF), valve disease, and aortic aneurysm were excluded.
Hyperlipoproteinemia(a) was defined based on the European guidelines7,8 as the Lp(a) level greater than or equal to 30 mg/dl (≥75 nmol/l). We additionally analyzed the prevalence of the Lp(a) level greater than or equal to 50 mg/dl (≥125 nmol/l). The Lp(a) concentration was determined using enzyme‑linked immunosorbent assay.
The following quantitative variables were analyzed: age, body mass index, total cholesterol (TC), LDL‑C, high‑density lipoprotein cholesterol (HDL‑C), non–HDL‑C, triglyceride (TG), TG/HDL‑C ratio, fasting blood glucose, glycated hemoglobin A1c (HbA1c), homocysteine, creatinine, estimated glomerular filtration rate, thyroid stimulating hormone, systolic and diastolic blood pressure, and heart rate. Qualitative variables included sex and chosen comorbidities, that is, hypertension, hyperlipidemia, asthma, chronic obstructive pulmonary disease, rheumatoid arthritis, anxiety disorders according to the Generalized Anxiety Disorders‑2 scale, depressive disorders established with the Patient Health Questionnaire‑2, sleep apnea, sleep disorders with sleep disturbances scale according to the European Society of Cardiology (ESC) guidelines,19 migraine, polycystic ovary syndrome (PCOS), erectile dysfunction, and atrial fibrillation (AF). Comorbidities were defined according to current guidelines.20-23 Lifestyle parameters included: smoking, use of e‑cigarettes or heated tobacco, and regular physical activity (defined as at least 150–300 min per week of moderate‑intensity activity or 75–150 min per week of high‑intensity activity in the preceding 3 months).
The study was approved by the Bioethics Committee of the Lodz Regional Medical Chamber (K.B.-0115/2021). Informed consent was obtained from all patients.
Statistical analysis
Structure indicators (percentages) were calculated for qualitative variables. Descriptive statistics (mean with SD, median with interquartile range [IQR], minimum and maximum values) were used to analyze quantitative variables. To assess the relationship between qualitative variables, the χ2 test was used. The Shapiro–Wilk test was applied to check the normality of distribution. For quantitative variables, the nonparametric Mann–Whitney test and the Kruskal–Wallis test were used, as appropriate. The Spearman correlation coefficient was used to measure the strength of correlation between quantitative variables. To determine the factors independently related to the probability of an elevated Lp(a) level, a stepwise backward multivariable logistic regression was performed, while the variables independently related to the concentration of Lp(a) were evaluated using the stepwise backward multivariable linear regression analysis. In the stepwise backward regression, all variables were included in the basal model, and subsequently, the least significant ones were eliminated in a stepwise approach. The final model consisted of a set of variables that passed the selection process and were significantly related to the Lp(a) level. Due to the fact that Lp(a) is a lipid parameter, 2 separate models were built. The first model initially included all factors, both demographic and behavioral, as well as health‑related parameters, including lipids. The second analysis excluded lipid parameters. This allowed for a better understanding of how different groups of variables influence Lp(a) levels, and for assessment of the importance of lipid factors in relation to other variables. A 2‑tailed P value below 0.05 was considered significant. Statistical analysis was performed using Statistica 13.1 software (TIBCO Software Inc., Palo Alto, California, United States).
Results
Out of 3536 screened individuals, 30% met the exclusion criteria. Finally, we analyzed data of 2475 patients, of whom 1724 were women (69.7%). The median (IQR) age of the patients was 66 (53–73) years, with a range of 19 to 95 years.
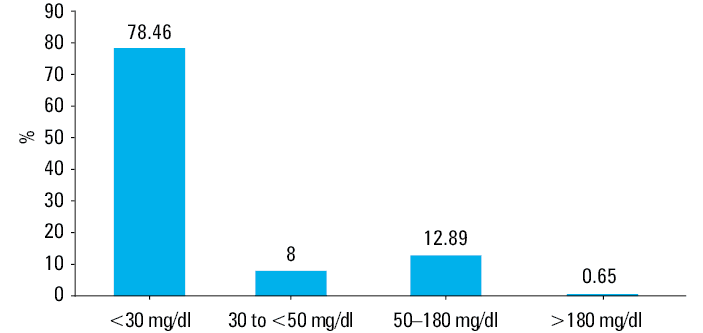
Characteristics of the study population are presented in Table 1. The median (IQR) level of Lp(a) was 8.5 (4–23) mg/dl (21.25 [10–57.7] nmol/l). The prevalence of the Lp(a) level greater than or equal to 30 mg/dl was 21.54%, with 13.54% of the patients having the Lp(a) level of 50 mg/dl or greater (Figure 1). The patients with the elevated Lp(a) level were more likely women, more often had hypertension and hyperlipidemia, and less often had migraines. The prevalence of AF was borderline significant in this group (Table 1). The patients with the Lp(a) level greater than or equal to 50 mg/dl more often had hypertension, hyperlipidemia, and hypothyroidism. There were also more women in this group.
Variable | Lp(a) <30 mg/dl (n = 1942) | Lp(a) ≥30 mg/dl (n = 533) | P valuea | Total (n = 2475) | |
Data are shown as number (percentage) or median (interquartile range).
a P value refers to the comparison between groups with Lp(a) <30 mg/dl and Lp(a) ≥30 mg/dl.
SI conversion factors: to convert TC, LDL‑C, HDL‑C, and non–HDL‑C to mmol/l, multiply by 0.0259; TG to mmol/l, by 0.0113; glucose to mmol/l, by 0.0555; creatinine to µmol/l, by 88.4; eGFR to ml/s, by 0.0167; TSH to pmol/l, by 0.0141.
Abbreviations: AF, atrial fibrillation; BMI, body mass index; COPD, chronic obstructive pulmonary disease; eGFR, estimated glomerular filtration rate; HbA1c, glycated hemoglobin A1c; HDL‑C, high‑density lipoprotein cholesterol; Lp(a), lipoprotein(a); LDL‑C, low‑density lipoprotein cholesterol; PCOS, polycystic ovary syndrome; RA, rheumatoid arthritis; TC, total cholesterol; TG, triglyceride; TSH, thyroid‑stimulating hormone | |||||
Sex | Men | 607 (31.3) | 144 (27) | 0.06 | 751 (30.3) |
Women | 1335 (68.7) | 389 (73) | 1724 (69.7) | ||
Age, y | <40 | 161 (8.3) | 31 (5.8) | <0.001 | 192 (7.8) |
41–54 | 387 (20) | 95 (17.8) | 482 (19.5) | ||
55–64 | 375 (19.3) | 103 (19.3) | 478 (19.3) | ||
≥65 | 1019 (52.5) | 304 (57) | 1323 (53.4) | ||
Hypertension | 1103 (56.8) | 334 (62.6) | 0.02 | 1437 (58.1) | |
Hyperlipidemia | 341 (17.6) | 129 (24.2) | <0.001 | 470 (19) | |
Diabetes | 316 (16.3) | 74 (13.9) | 0.18 | 390 (15.8) | |
Hypothyroidism | 316 (16.3) | 94 (17.6) | 0.45 | 410 (16.6) | |
Asthma | 169 (8.7) | 45 (8.4) | 0.85 | 214 (8.7) | |
COPD | 57 (2.9) | 20 (3.8) | 0.37 | 77 (3.1) | |
RA | 67 (3.5) | 20 (3.8) | 0.74 | 87 (3.5) | |
Anxiety disorders | 205 (10.6) | 66 (12.4) | 0.23 | 271 (11) | |
Depression | 256 (13.2) | 81 (15.2) | 0.23 | 337 (13.6) | |
Sleep disorders | 755 (38.9) | 200 (37.5) | 0.57 | 955 (38.6) | |
Smoking | 173 (8.9) | 48 (9) | 0.94 | 221 (8.9) | |
e‑Cigarette use | 33 (1.7) | 4 (0.8) | 0.11 | 37 (1.5) | |
Heated tobacco use | 21 (1.1) | 1 (0.2) | 0.05 | 22 (0.9) | |
Sleep apnea | 308 (15.9) | 71 (13.3) | 0.15 | 379 (15.3) | |
Migraine | 167 (8.6) | 30 (5.6) | 0.03 | 197 (8) | |
PCOS | 17 (1.3) | 3 (0.8) | 0.42 | 20 (1.2) | |
Erectile dysfunction | 58 (9.6) | 13 (9) | 0.85 | 71 (9.5) | |
Regular physical activity | 561 (28.9) | 136 (25.5) | 0.13 | 697 (28.2) | |
AF | 38 (2.3) | 18 (3.9) | 0.05 | 56 (2.6) | |
BMI, kg/m2 | 27.6 (24.3–31) | 27.24 (24.7–31.1) | 0.56 | 27.43 (24.4–31) | |
TC, mg/dl | 186 (159–216) | 192 (164–226) | <0.001 | 187 (160–217) | |
LDL‑C, mg/dl | 105 (79–131) | 110 (84–140) | <0.001 | 106 (80–134) | |
HDL‑C, mg/dl | 55 (46–65) | 55 (46–65) | 0.9 | 55 (46–65) | |
Non–HDL‑C, mg/dl | 128 (102–157) | 134 (106–169) | <0.001 | 130 (103–159) | |
TG, mg/dl | 107 (80–145) | 113 (85–144) | 0.06 | 108.5 (81–145) | |
TG/HDL‑C ratio | 2 (1.3–2.9) | 2.03 (1.36–3) | 0.16 | 1.98 (1.3–3) | |
Glucose, mg/dl | 99 (90–111) | 100 (90–113) | 0.26 | 99 (90–111) | |
HbA1c, % | 5.5 (5.2–5.9) | 5.52 (5.3–5.9) | 0.02 | 5.5 (5.2–5.9) | |
Homocysteine, µmol/l | 11.5 (9.6–14) | 11.6 (9.6–14.2) | 0.81 | 11.55 (9.6–14) | |
Creatinine, mg/dl | 0.8 (0.7–0.9) | 0.77 (0.7–0.9) | 0.69 | 0.78 (0.7–0.9) | |
eGFR, ml/min/1.73 m2 | 81.8 (71–96.5) | 79.61 (69.9–95.1) | 0.07 | 81.29 (70.7–96.3) | |
TSH, µU/ml | 1.5 (0.9–2.3) | 1.5 (0.96–2.3) | 0.38 | 1.5 (0.9–2.3) | |
Systolic blood pressure, mm Hg | 124 (116–134) | 124.8 (116–134) | 0.79 | 124 (116–134) | |
Diastolic blood pressure, mm Hg | 73 (68–79.7) | 73 (67–78.2) | 0.19 | 73 (68–79.1) | |
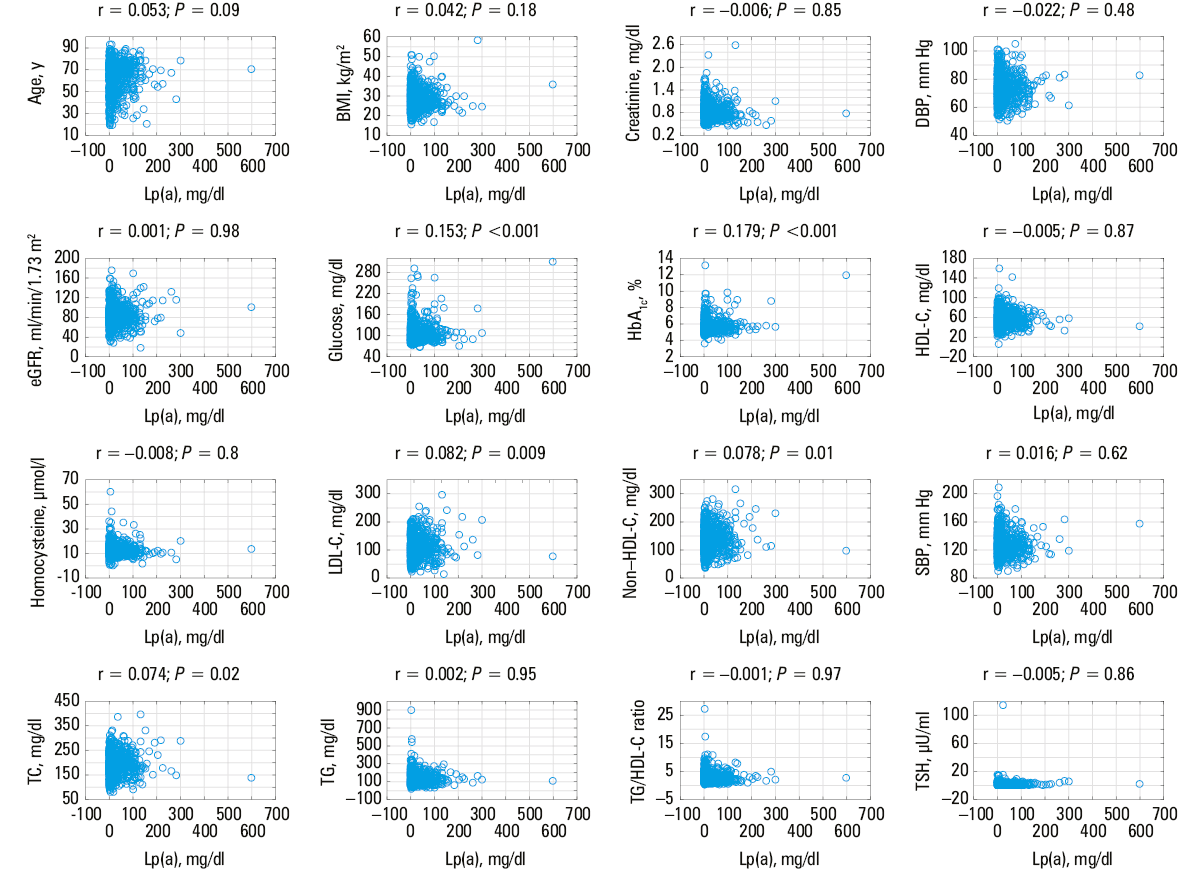
Significant differences in the prevalence of the Lp(a) level greater than or equal to 30 mg/dl were found among patients with hypertension, hyperlipidemia, and migraine. In the group with the Lp(a) level of 50 mg/dl or greater, significant differences were observed with respect to sex, and the prevalence of hypertension, hyperlipidemia, and hypothyroidism (Figure 2). Results of univariable analysis are shown in Table 2. Age, hypertension, hyperlipidemia, migraine, PCOS, physical activity level, TC and LDL‑C concentrations, and TG/HDL‑C ratio were identified to correlate with the level of Lp(a). Multivariable logistic analysis was performed for Lp(a) cutoff points of 30 mg/dl (75 nmol/l) and 50 mg/dl (125 nmol/l) (Table 3). Hyperlipidemia and AF were related to higher odds of having the Lp(a) level greater than or equal to 30 mg/dl (≥75 nmol/l), while migraine was associated with a lower probability of an increased Lp(a) concentration. Female sex, hyperlipidemia, and hypertension were related to higher odds of having an Lp(a) level greater than or equal to 50 mg/dl (≥125 nmol/l), while elevated HbA1c values correlated with lower odds of exceeding this cutoff. After exclusion of all lipid factors from the analysis, migraine was shown to be related to the Lp(a) level of 30 mg/dl or above (≥75 nmol/l), while female sex was related to the Lp(a) level greater than or equal to 50 mg/dl (≥125 nmol/l). Scatterplots illustrating the relation between the level of Lp(a) and continuous variables are presented in Figure 3. When the Lp(a) level was evaluated as a continuous variable, female sex and AF, along with HbA1c and LDL‑C concentrations were independently related to its higher levels (Table 4).
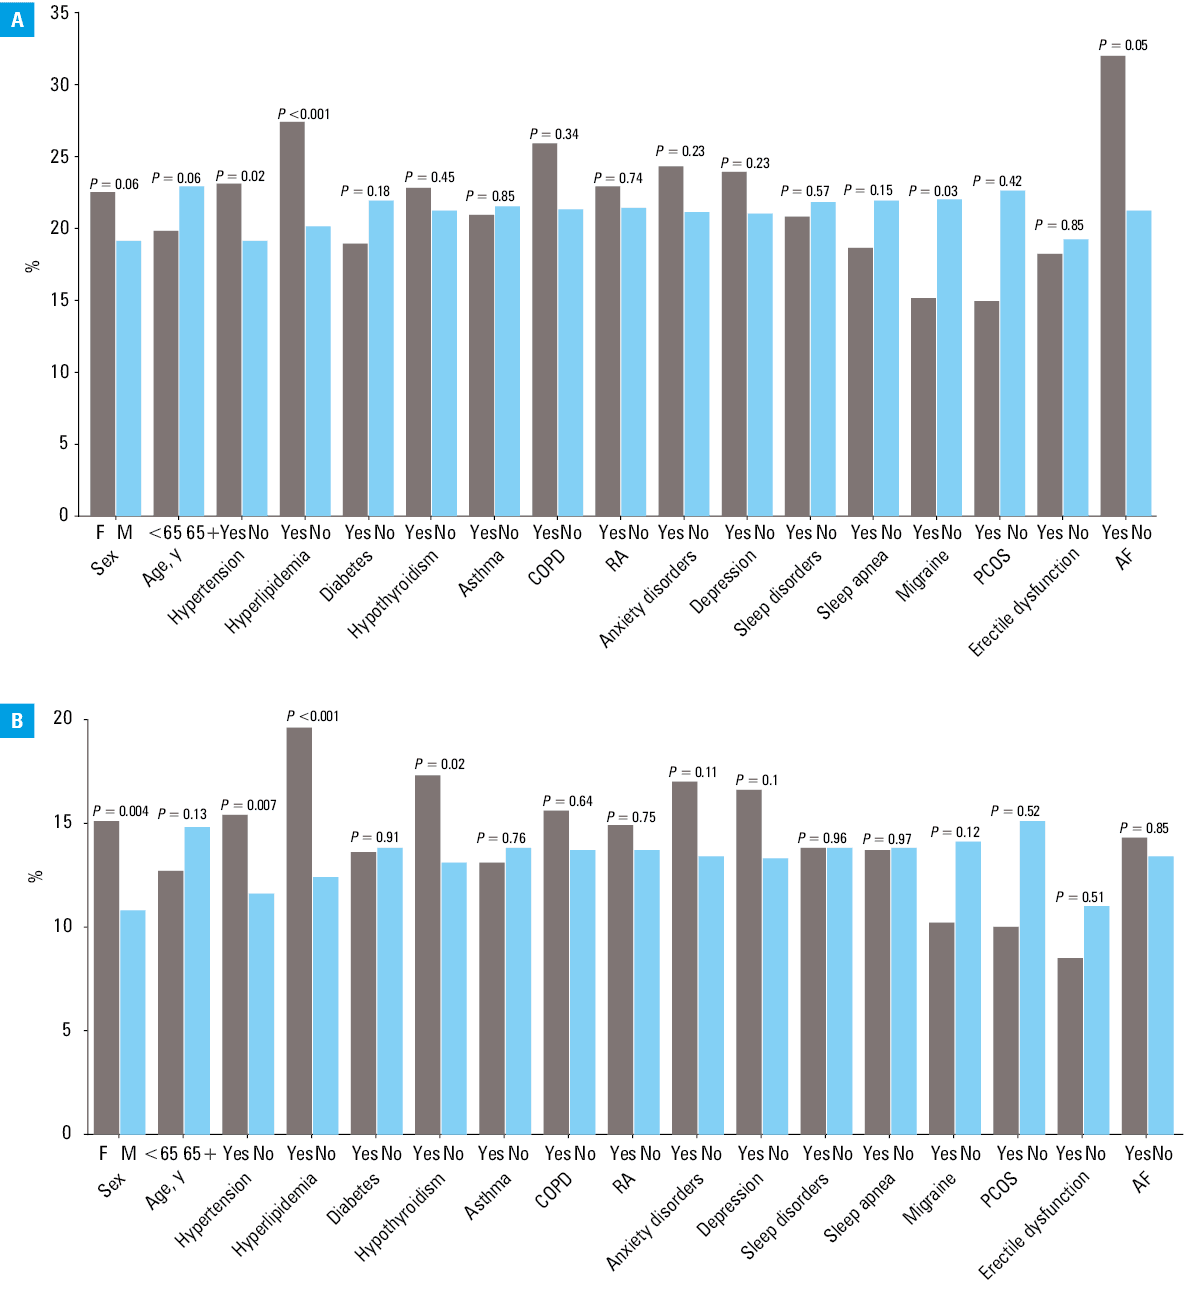
Abbreviations: F, female; M, male; others, see Table 1
Variable | Lp(a), mg/dl, median (IQR) | P value | |
P value <0.05 was considered significant.
SI conversion factors: see Table 1
Abbreviations: see Table 1 | |||
Sex | Men | 7.3 (4–24.3) | 0.07 |
Women | 9 (4–20) | ||
Age, y | <40 | 6.3 (3.75–19) | <0.001 |
41–54 | 7 (4–18.5) | ||
55–64 | 9 (4–23) | ||
≥65 | 9.1 (4.2–25) | ||
Hypertension | Yes | 9 (4.1–25) | 0.002 |
No | 7.4 (4–20.6) | ||
Hyperlipidemia | Yes | 10 (4.2–36) | 0.004 |
No | 8 (4–21) | ||
Diabetes | Yes | 8 (4–18.6) | 0.28 |
No | 8.9 (4–24) | ||
Hypothyroidism | Yes | 8.15 (4.1–26) | 0.33 |
No | 8.6 (4–22) | ||
Asthma | Yes | 7.6 (3.9–22) | 0.59 |
No | 8.6 (4–23) | ||
COPD | Yes | 9.8 (4.9–30) | 0.3 |
No | 8.5 (4–23) | ||
RA | Yes | 8.4 (4.6–26) | 0.75 |
No | 8.6 (4–23) | ||
Anxiety disorders | Yes | 8 (3.9–29) | 0.49 |
No | 8.65 (4–22.5) | ||
Depression | Yes | 7 (4–26) | 0.45 |
No | 8.7 (4–22.4) | ||
Sleep disorders | Yes | 8 (4–22) | 0.22 |
No | 9 (4–23) | ||
Smoking | Yes | 9 (4–21.3) | 0.99 |
No | 8.5 (4–23) | ||
e‑Cigarette use | Yes | 6.8 (4–14.4) | 0.33 |
No | 8.6 (4–23) | ||
Heated tobacco use | Yes | 5.15 (3.9–14.2) | 0.08 |
No | 8.7 (4–23) | ||
Sleep apnea | Yes | 7 (4–18) | 0.05 |
No | 9 (4–24) | ||
Migraine | Yes | 6.9 (3.6–15) | 0.008 |
No | 9 (4–24) | ||
PCOS | Yes | 4.5 (2.55–7.05) | 0.01 |
No | 9 (4–24.8) | ||
Erectile dysfunction | Yes | 7.25 (4–20) | 0.46 |
No | 7.6 (3.1–15) | ||
Regular physical activity | Yes | 7 (3.6–19) | 0.005 |
No | 9 (4.1–24) | ||
Sinus rhythm / AF | Sinus rhythm | 8.7 (4–23) | 0.97 |
AF | 6.8 (3.3–37) | ||
BMI category | Underweight | 9 (4.4–18) | 0.7 |
Normal | 7.9 (4–21) | ||
Overweight | 9 (4–24.8) | ||
Obesity | 8.7 (4–22) | ||
TC, mg/dl | <180 | 8 (4–20.8) | 0.005 |
180–199 | 9.25 (4.4–24.1) | ||
200–249 | 8.5 (4–23) | ||
>250 | 12.5 (4.5–40) | ||
LDL‑C, mg/dl | <135 | 8 (4–21.3) | 0.003 |
135–155 | 8.8 (4–25) | ||
>155 | 11.7 (4.9–40) | ||
HDL‑C, mg/dl | <35 | 9 (4.6–25) | 0.55 |
35–70 | 8.4 (4–23) | ||
>70 | 9 (4.1–24) | ||
Non–HDL‑C, mg/dl | ≤100 | 8 (4–21) | 0.35 |
101–130 | 8 (4–23) | ||
131–145 | 9 (4.3–19.4) | ||
>145 | 9 (4–29) | ||
TG, mg/dl | <150 | 9 (4.2–23) | 0.06 |
150–199 | 8.3 (4–23) | ||
200–499 | 6.9 (3.2–24.5) | ||
≥500 | 5.5 (3.7–6) | ||
TG/HDL‑C ratio | <2 | 9 (4.3–24) | 0.03 |
2–4 | 8.5 (4–24.5) | ||
>4 | 6.8 (3.5–21) | ||
Glucose, mg/dl | <70 | 31.5 (13.5–40.5) | 0.28 |
70–99 | 9 (4–23) | ||
100–125 | 8.7 (4.5–24) | ||
>125 | 9 (4.6–24) | ||
HbA1c, % | <5 | 7 (4–17.3) | 0.17 |
5–6 | 9 (4–24.2) | ||
6.01–7 | 8 (4.2–22) | ||
7.01–8 | 8 (4–17.4) | ||
>8 | 9.8 (4.9–40) | ||
Homocysteine, µmol/l | <10 | 8.9 (4–26) | 0.26 |
10–20 | 8 (4–21) | ||
21–30 | 11 (4.3–32) | ||
>30 | 10.8 (6.9–23) | ||
Creatinine, mg/dl | <0.9 | 8.95 (4.1–23) | 0.91 |
0.9–1.19 | 8 (4.6–24.8) | ||
≥1.2 | 9 (4–21) | ||
eGFR, ml/min/1.73 m2 | <90 | 9 (4.3–24.2) | 0.11 |
90–130 | 7.6 (4–21) | ||
>130 | 10 (5.1–23) | ||
TSH, µU/ml | <0.4 | 11.8 (5–36) | 0.15 |
0.4–4 | 8.45 (4–22) | ||
>4 | 9.05 (4.25–27.5) | ||
Systolic blood pressure, mm Hg | <120 | 8 (4.1–23) | 0.66 |
120–129 | 9 (4–25) | ||
130–139 | 9 (4.2–22.2) | ||
140–149 | 7.3 (4–16.5) | ||
>150 | 9.1 (4–26) | ||
Diastolic blood pressure, mm Hg | <70 | 9 (4.1–29) | 0.53 |
70–79 | 8 (4–23) | ||
>80 | 8.65 (4.15–18.7) | ||
81–100 | 9 (4–23) | ||
101–120 | 7.4 (4–18) | ||
121–155 | 8 (4–20.7) | ||
>155 | 8.7 (3.9–42.3) | ||
Variable | Lp(a) ≥30 mg/dl | Lp(a) ≥50 mg/dl |
Data are presented as odds ratios with 95% CIs.
Abbreviations: see Table 1 | ||
Lipid parameters included in the analysis | ||
Model performance | χ2 =22.93; P <0.001 | χ2 =29.99; P <0.001 |
Sex (female) | – | 1.46 (1.10–1.92) |
AF | 1.80 (1.01–3.19) | – |
Hyperlipidemia | 1.56 (1.22–1.99) | 1.49 (1.12–1.97) |
Hypertension | – | 1.42 (1.1–1.84) |
Migraine | 0.51 (0.32–0.83) | – |
HbA1c, per 1% | – | 0.84 (0.72–0.96) |
Lipid parameters excluded from the analysis | ||
Model performance | χ2 =5.43; P <0.001 | χ2 =3.61; P <0.001 |
Sex (female) | – | 1.47 (1.13–1.92) |
Migraine | 0.63 (0.42–0.95) | – |
Abbreviations: DBP, diastolic blood pressure; SBP, systolic blood pressure; others, see Table 1
Variable | Standardized regression coefficient ß (SE) |
Abbreviations: see Table 1 | |
Lipid parameters included in the analysis (R2 =0.03; P <0.001) | |
Sex (female) | 0.06 (0.02) |
AF | 0.05 (0.02) |
HbA1c | 0.14 (0.02) |
LDL‑C | 0.09 (0.02) |
Lipid parameters excluded from the analysis (R2 =0.01; P <0.001) | |
Sex (female) | 0.06 (0.02) |
HbA1c | 0.11 (0.02) |
Discussion
To the best of our knowledge, this is the first study focused on evaluating Lp(a) levels in individuals referred to outpatient cardiology clinics. The prevalence of Lp(a) levels greater than or equal to 30 mg/dl (≥75 nmol/l) in the general European population is estimated to range from 7% to 26%,24,25 which aligns with our study findings. Individuals of African and Asian descent are known to have higher and lower Lp(a) levels, respectively.9,10 Interestingly, no difference with respect to increased risk of CVD for an equal Lp(a) increment was found across various ethnic groups.26
Regional variations in the prevalence of elevated Lp(a) levels are observed within the European population. Northern European cohorts show a median Lp(a) level of 4.9 mg/dl (12.25 nmol/l), while in Central and Southern European cohorts, the median values are 7.9 mg/dl (19.75 nmol/l) and 10.9 mg/dl (27.25 nmol/l), respectively.27 In our study, the median level of Lp(a) was 8.5 mg/dl. Similarly, in a recent Zabrze‑Lip(a)R study,28 the median level of Lp(a) was 6.6 mg/dl (16.5 nmol/l) in patients with ASCVD.28
Our results align with previous studies showing a correlation between Lp(a) and age in both women and men.29 However, this association was no longer significant when adjusted for cofactors. Moreover, we observed a significantly higher median Lp(a) level in women than in men. Similar findings have been reported elsewhere. The available data demonstrate that in women over 50 years of age, a greater increase in the level of Lp(a) is observed, and that menopause may contribute to further Lp(a) level elevation.30 Aljawini et al31 found high‑risk levels of Lp(a) in 57.1% of postmenopausal women and 19.1% of premenopausal women.
Another important finding is the co‑occurrence of elevated Lp(a) levels and hypertension. An association between Lp(a) and atherosclerosis has been previously established; however, limited data suggest a possible link between Lp(a) and hypertension. Evidence shows that approximately 30% of hypertensive patients in at‑risk groups have elevated levels of Lp(a), and that measurement of Lp(a) may be useful for risk stratification.32 However, further research is needed to understand the associations between Lp(a), hypertension, and CVD,33 especially considering other reports. For example, in patients with ASCVD, no significant association with Lp(a) was found, and the prevalence of elevated levels of Lp(a) in individuals with hypertension and in the whole cohort was the same (27%).28
Interaction between a high plasma content of Lp(a) and plasma levels of other lipoproteins has been a subject of numerous studies. Together with other factors, it may substantially increase the risk of premature coronary heart disease.34 A study of 170 patients with early familial coronary artery disease (compared with 165 controls) found that almost all the risk associated with elevated levels of Lp(a) was confined to the individuals with a history of elevated plasma TC levels (≥260 mg/dl) or those with a TC/HDL‑C ratio above 5.8. Nonlipid risk factors have been found to at least multiply the risk associated with hyperlipoproteinemia(a). When 2 or more risk factors (including but not limited to hypertension and diabetes) were present, the relative risk also increased.35 Our study demonstrated a similar pattern, with significantly higher median levels of TC, LDL‑C, and non–HDL‑C in the patients with a high Lp(a) concentration.
In‑depth research in this area is recommended, also focusing on a relationship between elevated levels of Lp(a) and diabetes. Evidence from prospective studies suggests an inverse association between diabetes and Lp(a), with lower Lp(a) levels observed in diabetic patients.36 Our study, however, demonstrated an opposite correlation, with levels of Lp(a) rising along with an increase in glucose and HbA1c concentrations. Optimal treatment of diabetes may be reflected by reduced levels of Lp(a). Indeed, reduction of Lp(a) levels combined with a decrease in HbA1c concentration may lower the risk of CVD in diabetic patients.37 A recent study using Mendelian randomization, based on the data from the UK Biobank and Finn Gen consortia, has confirmed a lack of a significant causal relationship between the Lp(a) level and diabetes.38 Our results suggest that although HbA1c (a marker of undiagnosed or not well‑controlled diabetes) is related to a somewhat increased concentration of Lp(a), this is not the case for very high Lp(a) levels (eg, >50 mg/dl). It is also possible that the opposite directions of effects were due to different statistical methods used in the 2 studies. Logistic regression treats the dependent variable as a categorical (binary) one, while linear regression treats it as a continuous one. Since these 2 models have different objective functions (minimizing squared differences for linear regression vs maximizing log‑likelihood function for logistic regression), different results can be obtained even for the same data, a phenomenon known as the Simpson’s paradox.39 Of note, type 2 diabetes mellitus is commonly associated with lipid abnormalities that define “diabetic dyslipidemia.” Simultaneously, new clinical effects of antidiabetic drugs are emerging over time—beyond lowering glucose level, they also influence lipid metabolism. Indeed, some studies suggested that sodium‑glucose cotransporter 2 inhibitors could also modulate lipid metabolism, thereby preventing or improving dyslipidemia, independently of their glucose‑lowering effects,40 which may partially explain the relationship between the Lp(a) level and diabetes treatment. In their recent study, Lejawa et al41 evaluated the causal relationship between genetically predicted Lp(a) concentration and insulin levels. They confirmed that high insulin levels and insulin resistance might be associated with lower Lp(a) levels; however, reverse causality was not observed.
The present study also assessed the association between Lp(a) and the TG/HDL‑C ratio, which is an important CVD risk factor.42 In the univariable analysis, the relationship between these parameters was inversely proportional; however, the association became nonsignificant after adjustment for covariables. This suggests that the TG/HDL‑C ratio might not be independently related to the Lp(a) level.
The influence of thyroid hormone levels on the Lp(a) concentration is also a complex issue, depending on the degree of gland dysfunction, the type of hypothyroidism, and treatment duration.43 There is insufficient evidence to allow for a definitive conclusion. Kaliaperumal et al44 observed elevated levels of Lp(a) in individuals with hypothyroidism. In a recent study presenting results from the Polish Mother’s Memorial Hospital Research Institute‑Lp(a) Registry,45 after dividing the investigated population according to an Lp(a) cutoff value of 30 mg/dl, differences in hyperlipoproteinemia(a) prevalence were noted for familial hypercholesterolemia diagnosis, myocardial infarction prevalence, thyroid disease diagnosis, and ezetimibe treatment as part of lipid‑lowering combination therapy. Interestingly, when the participants were divided according to an Lp(a) cutoff value of 50 mg/dl, a diagnosis of thyroid disease was no longer significant. Although we found a higher prevalence of the Lp(a) level greater than or equal to 50 mg/dl among the patients with hypothyroidism, the association lost its significance after adjustment for covariables. Lee et al46 also failed to demonstrate a clear link between these 2 factors.
Previous reports on the relationship between AF and Lp(a) have yielded conflicting results. A Spanish case‑control study found no association between Lp(a) levels and AF.47 Similar findings were reported in patients with ASCVD.29 Another study showed no association between Lp(a) levels and AF recurrence after electrical cardioversion during 2‑year follow‑up.48 Conversely, a multivariable Mendelian randomization study suggested a positive causal association between high Lp(a) levels and an increased risk of AF.49 Our results support this association, but further research is needed to identify the underlying mechanism.
The emerging evidence that the risk of CVD may increase significantly in patients with migraine has caused allocation of clinical and economic resources to studies on migraine. In a systematic review of 4 cross‑sectional studies presenting data on the relationship between Lp(a) and migraine, only 1 was found to report that the level of Lp(a) was higher in individuals with migraine than in the control group. The remaining 3 studies reported no difference in the levels of Lp(a) between migraine patients and controls.50 Our findings suggest that if an epidemiological and clinical association between migraine and cardiovascular disease exists, a direct involvement of Lp(a) seems unlikely.
The level of Lp(a) is under strong genetic influence.4,51 Population and cross‑sectional studies have consistently shown a lack of association between Lp(a) levels and lifestyle parameters, such as regular physical activity. Our results indicated that the individuals who engaged in regular physical activity had a significantly lower median Lp(a) level than those who did not exercise (7 mg/dl vs 9 mg/dl, respectively). However, regular physical activity is associated with favorable changes in some blood lipids and lipoproteins, in particular increased plasma HDL‑C and decreased plasma TG concentrations. Since elevation of both LDL‑C and Lp(a) levels in blood exerts a synergistic effect on CVD risk, attention should focus on changing lifestyle factors to decrease LDL‑C and increase HDL‑C levels in blood. Therefore, physical activity may have an indirect effect on Lp(a) levels.52,53 Importantly, the current analysis did not confirm an independent relation between physical activity and Lp(a) levels.
Limitations
The main limitation of the study is the fact that patients with ASCVD, HF, valve disease, and aortic aneurysm were excluded; therefore, the results are not representative of the general population and of all patients treated at cardiology outpatient clinics. The design of the present study precludes any claims on cause‑and‑effect relations. Indeed, we could only confirm statistical associations between the analyzed variables, rather than a causal relationship.
Conclusions
We found that 21.5% of patients of European ancestry treated at outpatient cardiology clinics had elevated levels of Lp(a). Sex, hypertension, AF, migraine, and HbA1c concentration were independently associated with the levels of Lp(a) in this population.
- Kostner KM, Kostner GM. Lipoprotein (a): a historical appraisal. J Lipid Res. 2017; 58: 1‑14. | Crossref
- Patel AP, Wang M, Pirruccello JP, et al. Lp(a) (Lipoprotein[a]) concentrations and incident atherosclerotic cardiovascular disease: new insights from a Large National Biobank. Arterioscler Thromb Vasc Biol. 2021; 41: 465‑474. | Crossref
- Owczarek J, Rychlik‑Sych M, Barańska M, Dudarewicz M. The importance of APOB gene expression as a marker of atherosclerosis severity in coronary vessels. Pol Arch Intern Med. 2023; 133: 16540. | Crossref
- Kronenberg F, Mora S, Stroes ESG, et al. Lipoprotein(a) in atherosclerotic cardiovascular disease and aortic stenosis: a European Atherosclerosis Society consensus statement. Eur Heart J. 2022; 43: 3925‑3946. | Crossref
- Totoń-Żurańska J, Wołkow P, Kapusta M, et al. Targeted sequencing of a gene panel in patients with familial hypercholesterolemia from Southern Poland. Pol Arch Intern Med. 2023; 133: 16417. | Crossref
ARTICLE INFORMATION