Expression of NEAT1, PACERR, and GAS5 circulating long noncoding RNAs can be associated with disease activity in rheumatoid arthritis patients
Key words: epigenetic, long noncoding RNA, molecular marker, rheumatoid arthritis

 CC BY 4.0
Expression of NEAT1, PACERR, and GAS5 circulating long noncoding RNAs can be associated with disease activity in rheumatoid arthritis patients
Introduction: Long noncoding RNAs (lncRNAs) have long been considered molecular noise within the transcriptome, but over time it has been shown that they perform many important biological functions and are associated with various inflammatory and autoimmune diseases, including rheumatoid arthritis (RA).
Objectives: The aim of this study was to evaluate the association between the circulating lncRNAs and RA activity.
Patients and methods: The study included 63 patients with well‑established RA (median disease duration of 12 years), at a mean (SD) age of 51.7 (13) years, 88.9% women, and 25 healthy controls (HCs) at a mean (SD) age 51.8 (8.2) years, 80% women. Quantitative real‑time polymerase chain reaction was used to evaluate the plasma concentration levels of 6 lncRNAs: PACERR, NEAT1, HOTTIP, GAS5, MALAT1, and HIX003209.
Results: Among the tested molecules, 5 targets (PACERR, NEAT1, HOTTIP, GAS5, and HIX003209) had lower concentrations in the RA patients than in the HCs. LncRNAs for NEAT1, PACERR, and GAS5 showed differences between the severe disease activity group (the 28 joint disease activity score [DAS28] / erythrocyte sedimentation rate >5.1) and HCs (P = 0.02, P = 0.003, and P = 0.04, respectively). The multiple linear regression analysis indicated that GAS5 had the greatest impact on the disease activity based on DAS28 (P = 0.01).
Conclusions: Circulating plasma lncRNAs may be considered as supporting molecular markers associated with RA activity and may be useful in identifying the disease exacerbation.
What's new?
This study represents the first investigation into the clinical utility of circulating long noncoding RNAs (lncRNAs) as potential markers of disease activity in well‑established rheumatoid arthritis (RA). The plasma level of lncRNAs for NEAT1, PACERR, and GAS5 differed in the severe disease activity group (the 28 joint disease activity score / erythrocyte sedimentation rate >5.1) and healthy controls. LncRNAs may be considered as additional molecules useful in the assessment of RA activity and disease exacerbation.
Introduction
Rheumatoid arthritis (RA) can be divided into seropositive and seronegative subtypes depending on the presence or absence of specific serum antibodies, especially rheumatoid factor (RF) and / or anticitrullinated peptide / protein antibody (ACPA). It is estimated that the antibodies are not detected in up to one‑third of patients, which presents a significant diagnostic challenge.1 Misdiagnosed and untreated RA leads to progressive disability and premature mortality.2 For this reason, new markers or auxiliary indicators are needed to facilitate early diagnosis of the disease or to assess its increased severity.
Genes encoding protein products constitute about 2% of the human genome, and the remaining 98% have been for many years considered junk, unnecessary DNA. This view has changed significantly over time.3 Messenger RNA (mRNA), which is responsible for encoding information on a polypeptide chain, forms the basis of the central dogma of molecular biology, in which information flows from DNA through mRNA to proteins. In contrast, noncoding RNAs (ncRNAs) may be responsible for regulating gene expression at both transcriptional and post‑transcriptional levels.4 Among them, long ncRNAs (lncRNAs) constitute the ncRNA fraction longer than 200 nucleotides, and their expression is associated with many biological functions.5 LncRNAs are also responsible for sponging of micro‑RNA (miRNA) molecules. It is well known that mRNA expression may be regulated by miRNAs, therefore establishing the lncRNA‑miRNA‑mRNA axis is important to understand etiopathogenesis of various diseases.6,7 Their relationship with inflammatory and autoimmune diseases has been demonstrated, for example, in RA, systemic lupus erythematosus (SLE), multiple sclerosis, psoriasis, and Sjögren syndrome (SjS).7 LncRNAs can promote secretion of inflammatory molecules, such as tumor necrosis factor alpha (TNF-α), interleukin (IL)-6, and IL‑1β.8,9 Previous studies have shown that lncRNAs are common in biological fluids, for example, blood cell cytoplasm, urine, plasma, or serum, which makes them easily available markers for the presence of disease or effectiveness of its treatment.5,10-14 Separation of RNA from cellular nuclease activity makes plasma samples a stable material for measuring circulating nucleic acids.15
The purpose of this study was to evaluate the association between the concentration of selected plasma lncRNAs and RA activity.
Patients and methods
A total of 63 patients with RA and 25 healthy individuals in the control group were included in this study. The diagnosis of RA was made according to the 2010 American College of Rheumatology (ACR) / European Alliance of Associations for Rheumatology or 1987 ACR criteria for classification related to the time of diagnosis. Infection, severe illness during hospitalization, or the presence of other immune diseases or cancer were the exclusion criteria. The study was carried out according to the Declaration of Helsinki, and the protocol was approved by the Bioethics Committee of the Medical University of Lublin (KE‑0254/7/2016). Detailed characteristics of the RA patients and controls are presented in Tables 1 and 2.
Parameter | RA (n = 63) | HCs (n = 25) | P value |
Data are presented as number (percentage) or median (interquartile range) unless indicated otherwise.
SI conversion factors: to convert CRP to mg/l, multiply by 10.
Abbreviations: ACPA, anticitrullinated protein antibodies; bDMARDs, biologic disease‑modifying antirheumatic drugs; csDMARDs, classic synthetic disease‑modifying antirheumatic drugs; CRP, C‑reactive protein; DAS28, the 28 joint disease activity score; ESR, erythrocyte sedimentation rate; GS, glucocorticosteroid; HCs, healthy controls; IL, interleukin; PGA, patient global assessment; PhGA, physician global assessment; RA, rheumatoid arthritis; RF, rheumatoid factor; VAS, visual analog scale | |||
Age, y, mean (SD) | 51.71 (12.98) | 51.8 (8.15) | 0.98 |
Women | 56 (88.9) | 20 (80) | 0.45 |
Duration of the disease, y | 12 (7–18) | – | – |
RF‑positive | 41 (65.1) | 0 | – |
ACPA‑positive | 54 (85.7) | 0 | – |
Double negative RF/ACPA | 8 (12.7) | 0 | – |
ESR, mm/h | 27 (11–43) | 11 (7–20) | 0.001 |
CRP, mg/dl | 5.11 (0.63–15.48) | 0.58 (0.19–1.93) | <0.001 |
DAS28, mean (SD) | 3.97 (1.63) | – | – |
Swollen joints, n | 1 (0–5) | – | – |
Tender joints, n | 4 (1–7) | – | – |
VAS PGA | 27 (9–53) | – | – |
VAS PhGA | 20 (7–50) | – | – |
IL‑6, pg/ml | 5.28 (1.79–17.84) | 0.64 (0.35–1.09) | <0.001 |
IL‑8, pg/ml | 7.462 (3.96–14.9) | 2.37 (1.69–2.98) | <0.001 |
IL‑16, pg/ml | 57.46 (40.97–77.93) | 56.3 (47.66–72.74) | 0.78 |
IL‑17A, pg/ml | 0.1 (0.05–0.3) | 0 (0–0.06) | <0.001 |
IL‑18, pg/ml | 37.62 (24.39–59.99) | 20.22 (11.87–29.78) | <0.001 |
IL‑20, pg/ml | 11.07 (4.16–33.53) | 1.64 (0.71–2.47) | <0.001 |
IL‑21, pg/ml | 1.73 (0–9.05) | 0.06 (0–1.58) | 0.02 |
IL‑22, pg/ml | 8.69 (0–26.9) | 0.7 (0–9.58) | 0.04 |
RA treatment | 63 (100) | – | – |
Single‑line therapy | 13 (20.6) | – | – |
csDMARDs | 12 (19) | – | – |
bDMARDs | 0 | – | – |
GS | 1 (1.6) | – | – |
Double‑line therapy | 33 (52.4) | – | – |
csDMARDs + GS | 21 (33.3) | – | – |
csDMARDs + bDMARDs | 11 (17.5) | – | – |
GS + bDMARDs | 1 (1.6) | – | – |
Triple‑line therapy: csDMARDs + GS + bDMARDs | 17 (27) | – | – |
Characteristics | RF‑positive (n = 41) | RF‑negative (n = 22) | P value |
Data are presented as number (percentage) or median (interquartile range) unless indicated otherwise.
Abbreviations: see Table 1 | |||
Age, y, mean (SD) | 54.24 (12.2) | 47 (13.38) | 0.03 |
Women | 36 (87.8) | 20 (90.9) | 0.96 |
Duration of the disease, y | 13 (8–19) | 10.5 (4–14) | 0.25 |
ACPA‑positive | 40 (97.6) | 14 (63.6) | 0.001 |
ESR, mm/h | 27 (13–57) | 22 (5–31) | 0.07 |
CRP, mg/dl | 8.5 (1.39–16.61) | 2.5 (0.39–12.96) | 0.17 |
DAS28, mean (SD) | 4.22 (1.52) | 3.51 (1.78) | 0.1 |
Swollen joints, n | 2 (0–6) | 0.5 (0–4) | 0.2 |
Tender joints, n | 4 (1–7) | 3 (1–7) | 0.52 |
VAS PGA | 29 (9–55) | 20 (9–36) | 0.51 |
VAS PhGA | 20 (7–51) | 19 (10–40) | 0.96 |
IL‑6, pg/ml | 8.13 (1.87–18.84) | 3.14 (1.49–16.09) | 0.25 |
IL‑8, pg/ml | 9.73 (5.88–18.15) | 3.64 (2.23–7.95) | <0.001 |
IL‑16, pg/ml | 59.6 (45.97–85.9) | 57.01 (40.97–73.5) | 0.46 |
IL‑17A, pg/ml | 0.12 (0.06–0.42) | 0.07 (0.05–0.13) | 0.03 |
IL‑18, pg/ml | 40.69 (29.17–61.96) | 32.17 (21.54–51.4) | 0.29 |
IL‑20, pg/ml | 17.82 (5.84–62.86) | 4.07 (1.69–12.12) | <0.001 |
IL‑21, pg/ml | 3.86 (0.87–16.75) | 0 (0–2.21) | <0.001 |
IL‑22, pg/ml | 16.81 (3.32–42.45) | 0 (0–5.18) | <0.001 |
LncRNAs were selected based on the current literature. We selected 6 molecules with a proven link to inflammation and expression in blood: PACERR, NEAT1, HOTTIP, GAS5, MALAT1, and HIX003209 according to the LNCipedia database: lnc‑ANKRD34B.16 Quantitative real‑time polymerase chain reaction was used to evaluate the concentration of circulating plasma lncRNAs. The glyceraldehyde‑3‑phosphate dehydrogenase (GAPDH) gene was used for expression normalization. All primers, except those previously used for GAPDH17 and HIX003209,18 were designed using the Primer‑BLAST online tool.19 Detailed characterization of the primers is presented in Supplementary material, Table S1.
Statistical analysis
Statistical calculations were performed with Statistica software version 13.1 (Dell Inc. 2016, Tulsa, Oklahoma, United States), and a P value below 0.05 was considered significant. Detailed methodology is included in Supplementary material, Methods section.
Results
Patients with rheumatoid arthritis vs healthy controls
Median (interquartile range [IQR]) plasma concentrations of 5 lncRNAs was lower in the patients with RA than in the HCs: PACERR decreased by 68.18% (P = 0.02), NEAT1 by 61.29% (P = 0.04), HOTTIP by 71.88% (P = 0.002), GAS5 by 47.11% (P = 0.002), and HIX003209 by 53.59% (P = 0.005). Detailed data are presented in Table 3. Also, all mentioned targets showed differences between the patients divided into disease activity groups based on the 28 joint disease activity score (DAS28) calculated using erythrocyte sedimentation rate (ESR), and HCs (Supplementary material, Table S2). Among the relationships found, 3 molecules (NEAT1, PACERR, and GAS5) showed differences in plasma concentration between the severe disease activity group (n = 20; DAS28‑ESR >5.1) and HCs (n = 25; P = 0.02, P = 0.003, and P = 0.04, respectively). Furthermore, NEAT1 levels decreased in the severe disease activity group vs the patients in remission (n = 13; DAS28‑ESR <2.6; P = 0.04).
Target | RA (n = 58a) | HCs (n = 25) | P value |
a In 5 samples from the RA group we were unable to determine the concentrations of lncRNA, and they were excluded from the analysis. Data are presented as relative quantification and are given as median (interquartile range).
Abbreviations: see Table 1 | |||
PACERR | 0.28 (0.07–0.82) | 0.88 (0.38–1.75) | 0.002 |
NEAT1 | 0.36 (0.17–1.4) | 0.93 (0.44–1.75) | 0.04 |
HOTTIP | 0.36 (0.17–0.79) | 1.28 (0.43–1.73) | 0.002 |
GAS5 | 0.64 (0.39–1.2) | 1.21 (0.71–2.81) | 0.002 |
MALAT1 | 0.29 (0.12–1.02) | 0.93 (0.27–1.61) | 0.06 |
HIX003209 | 2.65 (1.34–4.33) | 5.71 (2.51–8.55) | 0.005 |
For the molecules that showed differences in the plasma levels between the patients with RA and HCs, we examined correlations between their concentrations and the following clinical variables: ESR, C‑reactive protein (CRP), number of swollen joints (SJN), number of tender joints (TJN), DAS28, ACPA, RF, and interleukin concentration. Details are presented in Supplementary material, Table S3.
Multiple linear regression was performed using the concentrations of 6 lncRNAs mentioned above. As an outcome parameter, the occurrence of the disease was used, that is, patients with RA vs controls. The results showed that GAS5 (P = 0.02) may be the most helpful transcript for distinguishing the patients with well‑established RA from the HCs (Supplementary material, Table S4). Furthermore, in the RA patient group, multiple linear regression was applied to evaluate the relationship between DAS28‑ESR and the concentration of lncRNAs. Of all the targets tested, GAS5 (P = 0.01; Supplementary material, Table S5) also showed an association with the disease activity score.
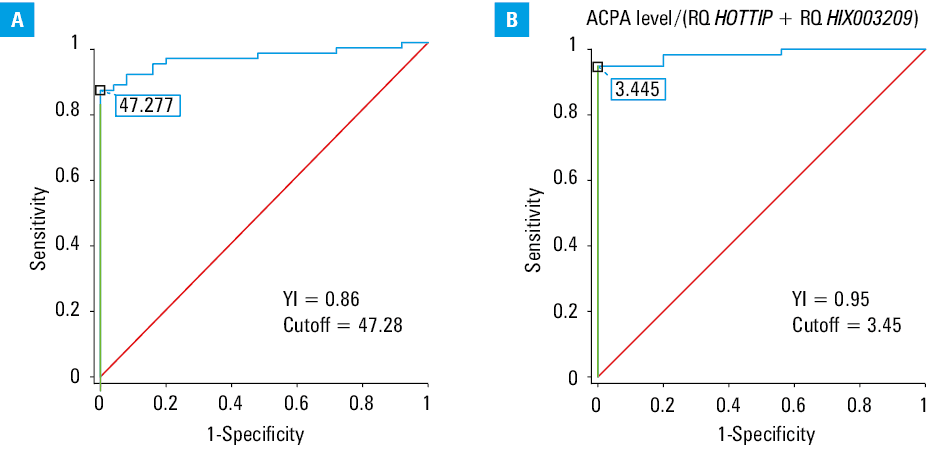
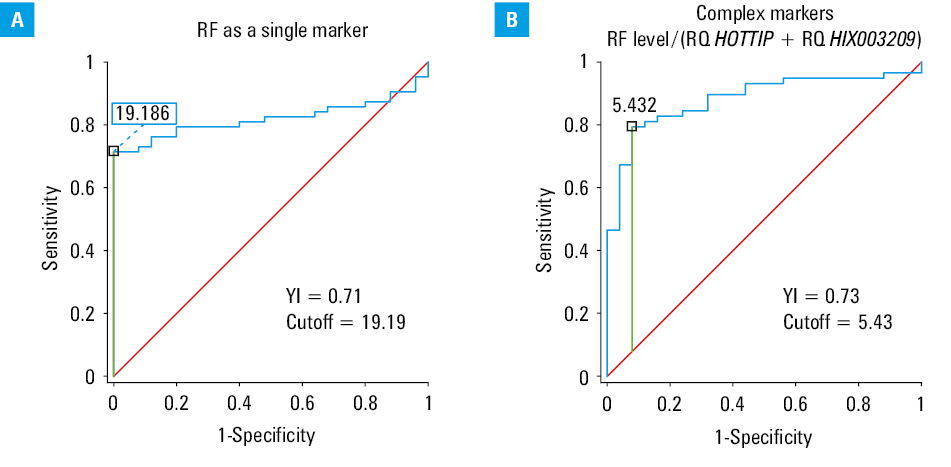
Receiver operating characteristic (ROC) curves were analyzed for ACPA (Youden index [YI], 0.86; sensitivity, 86%; specificity, 100%) and RF (YI, 0.71; sensitivity, 71%; specificity, 100%), which confirmed their general usefulness as serological markers in our study group. Contrary to these results, the ROC curves showed limited usefulness of single lncRNAs as markers helpful in differentiating patients with well‑established RA from healthy individuals (Table 4).
LncRNA name | Youden index | Cutoff point | Sensitivity, % | Specificity, % |
Abbreviations: lncRNA, long noncoding RNA | ||||
PACERR | 0.37 | 1.227 | 93 | 56 |
NEAT1 | 0.33 | 0.426 | 57 | 25 |
HOTTIP | 0.39 | 1.054 | 79 | 40 |
GAS5 | 0.35 | 1.945 | 95 | 60 |
MALAT1 | 0.26 | 1.063 | 78 | 52 |
HIX003209 | 0.39 | 5.198 | 83 | 44 |
As a next step, we analyzed the effectiveness of a combination of classic serological markers (ACPA/RF) and lncRNAs to increase the effectiveness of RA detection. With respect to ACPA antibodies and lncRNA, the best results were achieved for a combination of variables calculated from the following formula: ACPA antibody level / (relative quantification of transcript concentration [RQ] HOTTIP + RQ HIX003209). The YI related to this formula increased from 0.86 for a single ACPA as a serological marker to 0.95 (sensitivity, 95%; specificity, 100%). In relation to RF, the best results were obtained with a similar equation: RF antibody level / (RQ HOTTIP + RQ HIX003209). The YI slightly increased from 0.71 to 0.73 (sensitivity, 79%; specificity, 92%). The ROC curves associated with ACPA and RF are presented in Figure 1 and Figure 2, respectively.
Abbreviations: RQ, relative quantification of transcript concentration; YI, Youden index
Abbreviations: see Figure 1
To confirm the validity of the applied formulas, 3‑dimensional (3D) surface charts were used to determine general trends in the levels of the tested transcripts (HIX003209 and HOTTIP) and the level of evaluated antibodies for both ACPA and RF (Figure 3A–3D) in all patients with RA and HCs, as well as only RA patients.
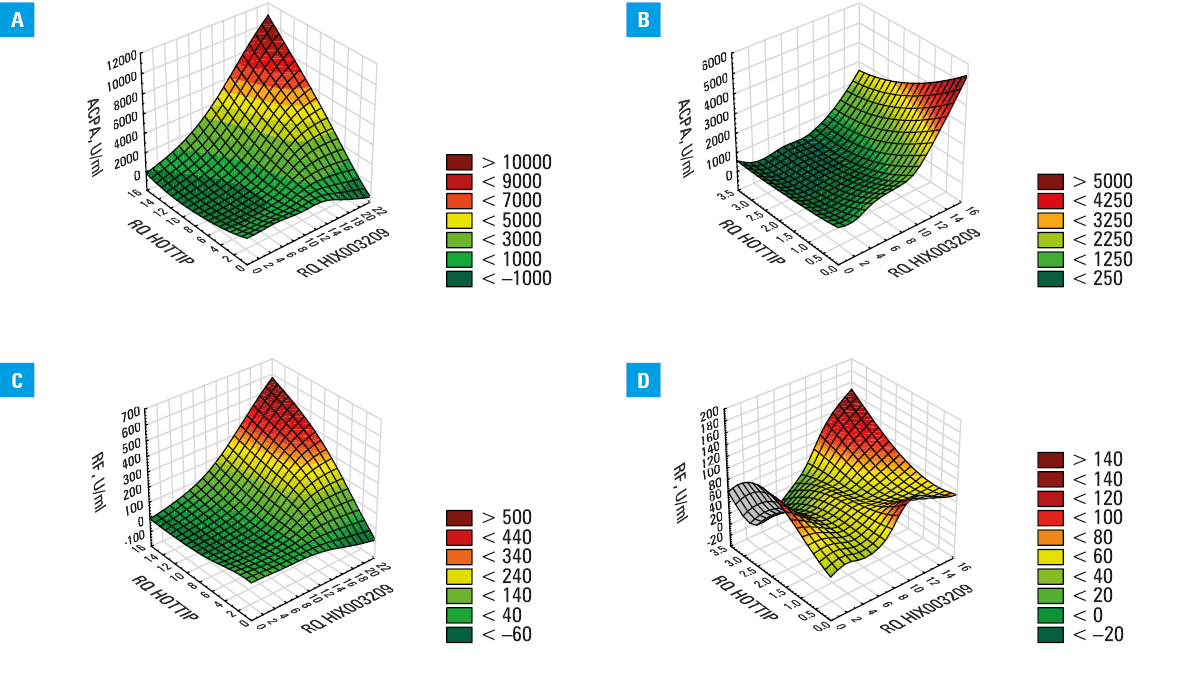
An analysis of the RF distribution with reference to the HOTTIP and HIX003209 transcripts, from both patients and control participants (Figure 3C), yielded a plot nearly identical to that obtained for ACPA. Two subpopulations with similar transcript distribution were also identified. However, the shape of the RF surface plot for the data only from RA patients (Figure 3D) differed significantly from that for ACPA. The patients with RA with low levels of RF formed 2 subpopulations: low RF / high HOTTIP / moderate HIX003209 and low RF / low HOTTIP / low‑to‑moderate HIX003209. An analysis of these graphs suggests that the population of RF‑negative patients is heterogeneous and requires a more complex approach to analysis.
Patients with positive and negative rheumatoid factor
After the 3D plot analysis for RF, all selected lncRNAs were also evaluated in detail in the patients divided by RF positivity and compared with the control group. The results are presented in Supplementary material, Table S6 and Figure S1. Four out of 6 targets showed decreased plasma concentrations in the patients with RA. Median concentration of HOTTIP lncRNA was at the same level in both the RA RF‑positive and RA RF‑negative group, and dropped by nearly 72% vs the HCs. Both PACERR and GAS5 lncRNAs showed lower expression in the plasma of the RA RF‑positive group than in the HCs. Only HIX003209 lncRNA was detected in lower amounts in the patients with negative RF, as compared with the HCs.
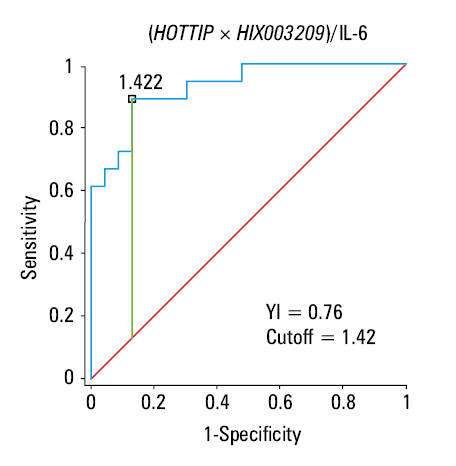
The ROC analysis was performed to identify RF‑negative RA patients. The purpose of this part of the analysis was to select the sets of markers that would allow for identification of patients with RA when RF antibodies are present, but a patient is classified as seronegative (RF titer below the specified cutoff level). After analyzing the Youden coefficients for individual markers, as well as 3D plots, a final formula was derived using the concentration of HOTTIP and HIX003209 transcripts and the concentration of IL‑6: ([HOTTIP × HIX003209] / IL‑6). The ROC analysis of the seropositive and seronegative RA patients showed that the YI was 0.76 with sensitivity 89% and specificity 87%, and cutoff of 1.42 (Figure 4). The algorithm presented above identified 16 out of 19 patients in the RF‑negative RA group. In the RF‑negative group, there were 3 samples excluded from the analysis, thus 19 samples were included in the molecular evaluation, as stated in the patient characteristics. Among these 3 missed samples, there were 2 ACPA/RF double‑negative patients. From 6 tested ACPA/RF double‑negative samples, only 1 patient could not be identified, because the IL‑6 titer was zero, and the obtained formula could not be used. In the HCs group (n = 25), 20 individuals (80%) were identified as RF‑negative, 3 participants were positive, and in 2 samples the algorithm could not be used, because the IL‑6 levels were undetectable. We also evaluated the usefulness of CRP, but the data obtained showed less diagnostic usefulness (YI, 0.55) than those for IL‑6.
Patients in remission (severe disease activity group DAS28 <2.6)
Selected lncRNAs, cytokines, and clinical variables were also evaluated in detail in the patients in remission (n = 13; DAS28 <2.6). The patients were divided according to the Boolean‑based remission criteria20 into 2 groups: active RA (n = 8) and remission RA (n = 5). The Boolean criteria for remission include patients in whom TJN and SJN are below or equal to 1, CRP is below or equal to 1 mg/dl, and Patient Global Assessment is below or equal to 10 cm or 20 cm for the Boolean 1 and 2 values, respectively. Detailed results are presented in Supplementary material, Table S7. The patients with RA in remission, as compared with those with active disease, were characterized by a higher level of IL‑22 (median [IQR], 8.69 [3.32–26.9] pg/ml vs 0 [0–2.94]; P = 0.03) and a higher level of GAS5 expression (median [IQR], 1.23 [0.77–2.98] vs 0.63 [0.45–1.1]; P = 0.048). When comparing median (IQR) GAS5 expression results with the data from the control group (1.21 [0.71–2.81]), it can be seen that the patients in remission according to the Boolean criteria had a very similar median level of lncRNA. In turn, patients with active disease had results similar to the groups with moderate (0.63 [0.41–0.98]) and low activity (0.66 [0.39–1.22]) of the disease, both provided in Supplementary material, Table S2.
Discussion
In this study, we show for the first time that patients with RA have different levels of lncRNAs depending on the disease activity or autoantibody levels. The 2 common laboratory markers routinely used for the diagnosis of RA and evaluation of the disease severity are CRP and ESR. A previous study21 showed that both markers were normal in up to 45% of patients with RA. Both CRP and ESR are the components of the DAS28 scale. However, DAS28 has been reported to be ineffective in determining remission in RA patients. This may be due to the conversion factors used, which underestimate the SJN, as they are given half the weight of painful joints (0.28 vs 0.56, respectively), and their importance relative to CRP/ESR is underestimated (natural logarithm of CRP/ESR multiplied by 0.7).22 Moreover, a previous study in the Polish population found that only 9% and 35% of RA patients treated outside biologic care centers achieved remission after 3 and 6 months of treatment, respectively.23 For these reasons, it is justified to look for new laboratory markers or auxiliary indicators that can facilitate the diagnosis or provide information on the disease activity. In this study, we found a positive correlation between HIX003209 transcript level and ESR, as well as a negative correlation between NEAT1 transcript level and CRP. The lack of more correlations may nonetheless be interesting, as it could indicate that the tested markers do not behave similarly to routinely used laboratory parameters. Furthermore, we found a negative correlation between DAS28 and PACERR, NEAT1, and MALAT1 lncRNAs. They were therefore excluded from further analysis, and we focused on the remaining transcripts. By comparing the transcript levels in the groups of patients divided by the disease activity and the control group, we expected to find a trend, where the patients with active disease would have different transcript levels than the control group, while the patients in remission would be similar to the control group. In most of the lncRNA targets tested, this assumption was not confirmed when comparing the remission patients with the HCs. The level of HIX003209 was the lowest in the patients in remission, as compared with the HCs and the other patients stratified according to the disease activity. This was surprising, as we expected an upward trend, with the transcript levels increasing as seen in the individuals without the disease. To verify this, the Boolean‑based remission criterion was implemented, and the majority of the patients (8 out of 13) in this group still qualified to the group with active form of the disease. Furthermore, we found that plasma levels of GAS5 were significantly different in the patients with active disease and those in remission. In the patients in the Boolean‑based remission, the concentration of this transcript was at a level similar to that in the control group. A previous study24 showed that GAS5 had lower expression in peripheral blood mononuclear cells (PBMCs) and demonstrated a diagnostic potential with sensitivity and specificity of 90% and 80%, respectively. Furthermore, GAS5 negatively correlated with clinical variables, such as CRP, ESR, DAS28, and IL‑6 and IL‑17. However, we did not observe these associations. We confirmed that GAS5 was downregulated in plasma, especially in the patients with high disease activity, and established it as a potential indicator of the disease exacerbation. Another study reported a decrease in serum GAS5 levels, which may be considered a diagnostic and prognostic marker, and included it as a therapeutic target related to the disease exacerbation.25 GAS5 participates in the activation of adenosine monophosphate‑activated protein kinase, which in turn reduces the expression of the proinflammatory cytokines IL‑6 and IL‑17. We did not find an association between GAS5 transcript level and the levels of these cytokines. Other biological conditions related to GAS5 activity are the regulation of proliferation, inflammation, and apoptosis in fibroblast‑like synoviocytes (FLSs) from RA patients via the miR‑222‑3p/SIRT1 axis. Furthermore, elevated levels of the GAS5 transcript were found in circulating T cells of RA patients, and T cell lymphocytes infiltrating the synovium contribute to development of the disease.26 GAS5 may bind to miR‑128‑3p, causing HDAC4 overexpression and leading to modification of FLS proliferation, migration, invasion, and apoptosis in patients with RA. GAS5 may inhibit inflammation via the miR‑128‑3p/HDAC4 pathway, which makes it an important molecule in the pathogenesis of RA. In our study, GAS5 had sensitivity and specificity of 95% and 60%, respectively, which were the best results for the tested transcripts. However, the calculated YI was low, indicating that a single transcript may not suffice as a disease marker, leading us to combine the diagnostic value of classic serological markers (ACPA, RF) and the tested molecular targets. The routinely used serological markers, such as ACPA and RF, also have limited diagnostic usefulness. The sensitivity of the RF test varies depending on the duration of the disease, and increases with the course of RA. At an early stage of the disease, the sensitivity ranges from 42% to 62%, and in the established phase, it ranges from 62% to 87%; however, overall sensitivity is about 65%–69% with specificity about 88%–89%.27,28 The sensitivity and specificity of ACPA for the diagnosis of RA are in the range of 60%–91% and 74%–99%, respectively. In general, the latest third‑generation assay has a sensitivity of about 82% and a specificity of up to 97%.28 In this study, the sensitivity and specificity we obtained for ACPA were 86% and 100%, respectively, and for RF, they were 71% and 100%. Among all tested transcripts, the best YIs were obtained by combining ACPA or RF with HOTTIP and HIX003209 concentrations. When both transcripts were combined with ACPA, sensitivity increased from 86% to 95% with the same level of specificity. When RF was combined with both lncRNAs, sensitivity increased slightly from 71% to 79% and specificity decreased from 100% to 92%. Increasing sensitivity of the markers is desirable from a diagnostic perspective, even if it means an increased rate of false positives, which is less important at the screening stage. On the other hand, the ratio of antibody seroconversion is limited. Serum ACPA levels are stable during the disease development, as the antibodies are generated by long‑lived plasma cells and mainly consist of the immunoglobulin (Ig) G isoform. We propose a quantitative use of the antibodies, not only their qualitative evaluation. The cutoff level for determining seropositivity can differ significantly between laboratory assays, ranging from 5 to 35 U/ml.29 Our proposed solution may be useful for patients with antibody titers close to but below the determined cutoff value; however, this approach must be validated.
The situation is different for RF, which is mainly produced by short‑lived plasma cells and primarily consists of the IgM fraction, and sometimes IgA.30 Therefore, patients with low RF titers due to fluctuations in their levels throughout the diagnostic process may go undetected or be misdiagnosed. We proposed a formula to better identify RF‑negative patients by considering the concentrations of IL‑6 and both HOTTIP and HIX003209 transcripts. A previous study31 indicated a significant increase in the use of biological disease‑modifying antirheumatic drugs (bDMARDs) in the treatment of RA. Over the last few years (2016–2022) in Poland, the percentage of patients with RA treated with IL‑6 inhibitors among bDMARDs / Janus kinase inhibitors increased from 22% to 31%. In our group of RF‑negative patients, there were 3 patients cotreated with tocilizumab, but the proposed formula correctly identified them to the seronegative group. Given that the RA patients had an average disease duration of approximately 12 years and received treatment with various drug groups, the proposed formula appears to be universal. However, it requires further investigation and potential validation in a larger patient cohort, including newly‑diagnosed RA patients.
A previous report32 has shown that HOTTIP is upregulated in FLS and is associated with increased inflammation in RA via the miR‑1908‑5p/STAT3 pathway. In a cell line model of osteoarthritis, silencing HOTTIP has been reported to decrease proliferation and increase apoptosis through regulation of the miR‑663a/Fyn‑related kinase axis.33 A study by Shao et al34 showed elevated serum levels of HOTTIP in patients with acute gouty arthritis, promoting inflammation by miR‑101‑3p/BRD4 regulation. Furthermore, in THP‑1‑derived macrophages, a correlation was shown between lncRNA and levels of inflammatory molecules, such as IL‑1β and IL‑8. In this study, we did not find a correlation between HOTTIP and inflammatory cytokines for the reasons described for GAS5 and ILs.34
HIX003209 lncRNA has previously been reported as upregulated in the serum of RA patients, and positively correlated with RF, ACPA, ESR, and the disease duration. Contrary to these results, we found that HIX003209 lncRNA was downregulated and showed only a positive correlation with ESR. These differences may be due to the duration of the disease, with patients in our study having a median (IQR) disease duration of 12 (7–18) years vs 2.5 years in the study conducted by Xu et al.35 Another difference is the sex ratio of the individuals included in the study, with 89% and 80% women in the RA and HC groups, respectively, as compared with 70% and 63%, respectively, in the study by Xu et al.35 In our study, we identified the subpopulation of RA patients with high levels of RF or ACPA and HIX003209, as shown in Figure 3. There appears to be a group of patients with high transcript levels and high antibody titers, but their identification requires further research. The mentioned study35 did not provide information on the percentage of patients positive for RF and ACPA, only indicating the average level of these antibodies, making it difficult to compare the results. Another publication by this research team18 focused on expression of HIX003209 in PBMCs and its biological role, similarly observing increased transcript expression in PBMCs and macrophages. Furthermore, a positive correlation was reported between HIX003209 and ESR, CRP, RF, and the disease activity. The lack of information on some clinical data in that study makes it difficult to perform a comparative analysis with our results. The authors suggested a relationship between the evaluated lncRNA and the stimulation of proliferation, as well as the production of inflammatory cytokines, such as TNF-α, IL‑6, and IL‑1β in macrophages through activation of IκBα/NF-βB signaling pathway.
Altered lncRNA expression has also been described in autoimmune diseases other than RA. Among the molecules examined in this study, NEAT1, GAS5, and MALAT1 were shown to be associated with the pathogenesis of SLE. Decreased GAS5 expression has been reported in PBMCs from SLE patients, which was associated with increased apoptosis. Moreover, in SLE patients, an increased expression of MALAT1 was observed, especially in monocytes, which was associated with dysregulation of the SIRT1 pathway in both primary monocytes and the THP‑1 cell line. Increased expression of NEAT1 in SLE was associated with dysregulation of Toll‑like receptor 4 pathway and expression of proinflammatory molecules, such as chemokines and cytokines.36,37 NEAT1 and MALAT1 lncRNAs have also been shown to be associated with pathogenesis of SjS. NEAT1 was upregulated in peripheral T‑cells from SjS patients, and was related to elevated expression of CXCL8 and TNF-α molecules.38 MALAT1 was upregulated in PBMCs in primary SjS after interferon alpha (IFN-α) stimulation. This in turn was related with increased levels of IFN‑regulated chemokines, such as macrophage inflammatory protein‑1α, IFN-γ-inducible protein 10, and B‑lymphocyte chemoattractant.39
Our study has some limitations. The main one is the small group size, especially of the Boolean‑based remission group. The obtained results should be considered as preliminary, and may inspire other researchers to search for new molecular markers as indicators of RA exacerbation or its diagnosis. Therefore, our results require confirmation in a larger number of patients. The second limitation is long disease duration in the patients included in the study. The presented calculations were performed in a group of patients with established RA. The proposed calculations should be considered as preliminary assumptions. Therefore, our results should be compared with newly‑diagnosed untreated RA patients and the pre‑RA group, in which the antibodies may already be present before clinical symptoms appear. Moreover, RF‑positive and RF‑negative patients differed in age, which means that additional validation of these results should be considered. This difference is due to the fact that the primary objective of the study was to determine the association of the tested molecules with the disease exacerbation, and the secondary objective was to find an association with the antibody titer. The results presented concern only patients with RA. Additionally, the expression of the studied lncRNAs should be compared in other autoimmune diseases, for example, SLE or SjS.
In conclusion, plasma lncRNA levels can be considered as supportive molecular markers of RA exacerbation as well as the disease activity.
This study was not aimed at establishing new specific diagnostic markers of RA, but at drawing attention to the possible use of a combination of several variables to improve monitoring of the disease activity in the future, and to point out that RA is a heterogeneous disease also in terms of the molecular targets. Further studies are needed to determine whether combining lncRNAs with classical serologic markers (ACPA, RF) can increase the precision of RA diagnosis.
- Wu C‑Y, Yang H‑Y, Luo S‑F, Lai J‑H. From rheumatoid factor to anti‑citrullinated protein antibodies and anti‑carbamylated protein antibodies for diagnosis and prognosis prediction in patients with rheumatoid arthritis. Int J Mol Sci. 2021; 22: 686. | Crossref
- Aletaha D, Neogi T, Silman AJ, et al. 2010 Rheumatoid arthritis classification criteria: an American College of Rheumatology / European League Against Rheumatism collaborative initiative. Arthritis Rheum. 2010; 62: 2569‑2581.
- Yao Q, He T, Liao J‑Y, et al. Noncoding RNAs in skeletal development and disorders. Biol Res. 2024; 57: 16. | Crossref
- Wei Z, Li H, Lv S, Yang J. Current situation and trend of non‑coding RNA in rheumatoid arthritis: a review and bibliometric analysis. Front Immunol. 2024; 14: 1301545. | Crossref
- Loganathan T, Doss C GP. Non‑coding RNAs in human health and disease: potential function as biomarkers and therapeutic targets. Funct Integr Genomics. 2023; 23: 33. | Crossref
SUPPLEMENTARY MATERIAL
ARTICLE INFORMATION