Does Epstein-Barr virus and intracellular Toll-like receptors affect the course of Hashimoto disease? Findings from studies on newly-diagnosed patients
Key words: autoimmune response, Epstein-Barr virus reactivation, Hashimoto thyroiditis, Toll-like receptors

 CC BY 4.0
Does Epstein-Barr virus and intracellular Toll-like receptors affect the course of Hashimoto disease? Findings from studies on newly-diagnosed patients
Introduction: Epstein‑Barr virus (EBV) reactivation is increasingly recognized as a potential exacerbator of autoimmune diseases, including Hashimoto thyroiditis (HT).
Objectives: This study examined the association between EBV reactivation and intracellular Toll‑like receptor (TLR) expression in newly‑diagnosed, untreated HT patients. Its aim was to determine whether EBV reactivation and expression of specific TLRs (TLR3, TLR7, TLR8, and TLR9) contribute to the pathogenesis and progression of HT.
Patients and methods: The study involved a cohort was 54 newly‑diagnosed, untreated patients with HT and 20 healthy volunteers (HVs) matched for age and sex. Blood samples were collected to assess EBV viral load and intracellular expression levels of TLR3, TLR7, TLR8, and TLR9 using flow cytometry. The levels of specific anti‑EBV antibodies (eg, viral capsid A [VCA] immunoglobulin [Ig] M, VCA IgG, Epstein‑Barr nuclear antigen 1 [EBNA‑1] IgM, EBNA‑1 IgG) were measured to identify signs of EBV reactivation, while soluble TLRs (sTLR3, sTLR7, sTLR8, and sTLR9) were quantified in serum using enzyme‑linked immunosorbent assay. Notably, our HT patients were not euthyroid, as they exhibited significantly lower thyroid‑stimulating hormone levels and elevated free triiodothyronine and free thyroxine levels in comparison with the HVs.
Results: The study showed a significant increase in EBV reactivation among the HT patients, with 26 of 54 (48.1%) testing positive for EBV DNA, as compared with none of the HVs. The HT patients with reactivated EBV showed significantly higher intracellular expression of TLR3, TLR7, and TLR9, with TLR3+ cells constituting an average of 4.72% of CD4+ lymphocytes (vs 0.69% in the HVs), suggesting a potential synergistic effect. In addition, sTLR levels increased in the HT patients with reactivated EBV, suggesting a possible role of these receptors in potentiating autoimmune responses.
Conclusions: These findings highlight the importance of considering both viral reactivation and TLR activity in the treatment of HT. Understanding the interplay between EBV and intracellular TLRs may lead to development of new therapeutic approaches to mitigate the impact of these factors on the disease progression. Further research is warranted to investigate the mechanisms underlying this interaction and its implications for treatment strategies.
What's new?
Our research has shown a novel connection between reactivation of Epstein‑Barr virus and higher expression of specific intracellular Toll‑like receptors (TLRs) in newly‑diagnosed, untreated patients with Hashimoto thyroiditis (HT). We observed a significant increase in the expression of TLR3, TLR7, TLR8, and TLR9 in these patients, indicating a potential role of these receptors in development and progression of the disease. This finding emphasizes the importance of considering both viral reactivation and the innate immune response when treating HT. Future research should aim to explain the mechanisms underlying these interactions and develop targeted therapies to mitigate their impact on HT progression.
Introduction
Epstein‑Barr virus (EBV), also known as human herpesvirus 4, is the most frequently transmitted virus worldwide.1 A key aspect of its survival strategy is its ability to persist in a latent form, primarily within B lymphocytes, and its high reactivation potential, which enables it to evade immune surveillance over long periods.2-6 Simultaneously, EBV is also recognized as an oncogenic virus associated with malignant tumors6-10 and various autoimmune diseases.10-14 One of these autoimmune conditions is Hashimoto thyroiditis (HT), also known as chronic lymphocytic thyroiditis, which is among the most common causes of hypothyroidism, particularly affecting women.6,15-18
In the pathogenesis of HT, thyroid cells are destroyed due to the loss of immune tolerance mechanisms toward thyroid autoantigens, ultimately leading to improper thyroid hormone production and hypothyroidism.19,20 Recent research suggests multifactorial development of HT, involving genetic, environmental, and even dietary factors.21,22 Viral infections, particularly EBV ones, are highlighted as a significant environmental trigger in genetically predisposed individuals, as EBV components such as EBV‑encoded RNAs (EBERs) may contribute to a breakdown of immune tolerance and activation of autoimmune processes.6,23
Additionally, disruptions in immune response regulation have been associated with deregulation of Toll‑like receptors (TLRs), part of the pattern recognition receptor family, which play a crucial role in immune surveillance.13 TLRs are surface and intracellular receptors, primarily in immune cells, which recognize a broad range of pathogen- and damage‑associated molecular patterns. They initiate defense mechanisms by influencing proinflammatory cytokine production, including interleukin 6, tumor necrosis factor α, and interferon γ.24 Among intracellular TLRs, TLR3, TLR7, TLR8, and TLR9 are of particular interest due to their ability to detect viral nucleic acids within endosomal membranes, potentially contributing to persistent inflammation in HT.6,24 TLR3 recognizes double‑stranded RNA, TLR7/TLR8 detect single‑stranded RNA, and TLR9 binds to deoxy‑cytidylate‑phosphate‑deoxy‑guanylate‑DNA (CpG‑DNA).25
Moreover, literature indicates that TLR pathways can be inappropriately activated by both endogenous and exogenous ligands, such as EBV‑related molecular patterns. For instance, EBV’s CpG DNA or EBERs may lead to excessive immune activation and inflammatory response.6,26
In light of recent findings and our observations, we conducted research to assess the expression of intracellular TLRs (TLR3, TLR7, TLR8, and TLR9) in specific immune cell subpopulations, including T helper (Th) lymphocytes, cytotoxic T (Tc) lymphocytes, and B lymphocytes, in newly‑diagnosed HT patients, with a particular emphasis on assessing the impact of EBV reactivation.
Patients and methods
The research material consisted of 10 ml of peripheral blood collected from the basilic vein. The study included 54 patients with newly‑diagnosed and untreated (HT) and 20 healthy volunteers (HVs) matched for age and sex.
Inclusion criteria were: HT confirmation, age at least 18 years, expected survival of at least 12 months, no immunosuppressive treatment within 3 months before entering the study, and written consent to participate in the study. Exclusion criteria involved: active viral, bacterial, or fungal infection, severe allergy, condition after allotransplantation of hematopoietic cells or internal organs, active malignancy or other autoimmune diseases during treatment, pregnancy or lactation, taking medications in a clinical trial, presence of cancer metastases within the central nervous system, and mental illness. The study was approved by the local bioethics committee at the Medical University of Lublin (KE‑0254/82/05/2024).
Immunophenotype assessment
Whole blood samples were incubated with monoclonal antibodies conjugated with fluorochromes directed against appropriate human antigens, that is, anti‑CD45 FITC, anti‑CD3B V510, anti‑CD4BV650, anti‑CD8 BV605, anti‑CD19 PERCP CY 5.5, anti‑CD16 +56 APC‑CY7, anti‑TLR2 APC, anti‑TLR4 PE, anti‑TLR7 PE, anti‑TLR8 APC, anti‑TLR3 PE, and anti‑TLR9 APC (Biolegend, San Diego, California, United States) and with Horizon Brilliant Stain Buffer (Becton Dickinson [BD], Franklin Lakes, New Jersey, United States), which was used to improve the quality of signal reading on a flow cytometer. Next, the samples were treated with a lysis buffer (BD) to remove erythrocytes. Then, the cells were washed with BD Pharmingen Stain Buffer (bovine serum albumin). To permeabilize the cells and label internal TLRs, we use BD Cytofix / Cytoperm fixation / permeabilization kit. The samples were analyzed using the CytoFLEX LX instrument (Beckman Coulter, Indianapolis, Indiana, United States). The data analysis utilized the Kaluza Analysis program version 2.1 (Beckman Coulter, Indianapolis, Indiana, United States; sample analysis is provided in Supplementary material, Figure S1). To ensure data quality and consistency, the device was checked using CytoFLEX Ready to Use Daily QC Fluorosphere reagents (Beckman Coulter).
Serum concentration of soluble Toll‑like receptors 3, 7, 8, and 9
Commercial enzyme‑linked immunosorbent assay (ELISA) kits were used to assess serum concentrations of soluble TLR (sTLR) forms. The following commercial ELISA kits were used: human TLR3 (sensitivity, 10 pg/ml; range, 156–10 000 pg/ml; Abcam, Cambridge, United Kingdom), human TLR7 (sensitivity, 32.6 pg/ml; range, 78.1–5000 pg/ml), human TLR8 (sensitivity, 0.06 ng/ml; range, 20–0.312 ng/ml), human TLR9 (sensitivity, 0.06 ng/ml; range, 20–0.312 ng/ml) (MyBiosource, San Diego, California, United States). All analyses were performed in accordance with the manufacturer’s instructions. The results were read on a VictorTM3 reader (Perkin Elmer, Waltham, Massachusetts, United States).
Assessment of Epstein‑Barr virus genomic copies in DNA derived from peripheral blood mononuclear cells
Using the 7300 real‑time polymerase chain reaction (PCR) system (Applied Biosystems, Foster City, California, United States) and the ISEX EBV PCR kit protocol, we amplified a conserved DNA sequence specific for the EBV EBNA1 gene. The ISEX variant of the EBV PCR assay from GeneProof (Brno, Czech Republic) enabled quantification of EBV genome copies. Each sample was evaluated in duplicate, with a negative control containing DNA elution buffer. Final concentration of the viral DNA, expressed per microgram of isolated DNA, was normalized by considering the efficiency of DNA isolation. Ten EBV DNA copies/μl were considered the detection level, and samples below this value were considered EBV negative.
Statistical analysis
The statistical analyses were conducted using Tibco Statistica 13.3 package (Palo Alto, California, United States). Data distribution was assessed for normality using the Shapiro–Wilk test. Since none of the variables followed a normal distribution, quantitative data are presented as median values with interquartile range. Group differences were analyzed using the Kruskal–Wallis test with the Bonferroni correction for non‑normally distributed data. This allowed for nonparametric comparisons across multiple groups, while minimizing the risk of type I error in multiple comparisons.
The Kruskal–Wallis test was chosen for its flexibility in analyzing data. It it was applied to parameters treated as ordinal, such as categorized levels of TLR expression or grouped laboratory markers, which is particularly useful in assessing frequencies and proportions across groups with differing distributions. The Spearman correlation coefficients were used to evaluate relationships between the variables. The diagnostic performance of the laboratory parameters was assessed using the receiver operating characteristic (ROC) curves to identify potential biomarkers in HT patients.
The data thus obtained were graphically processed using GraphPad Prism software, v. 9.4.1 (687) (Boston, Massachusetts, United States).
Results
Assessment of morphology, biochemistry, and immunophenotype in patients and healthy volunteers, focusing on Toll‑like receptor 3, 7, 8, and 9 percentages and serum concentration of their soluble forms
At first, we analyzed selected parameters of peripheral blood morphology and biochemistry, with particular emphasis on assessing the degree of thyroid function in both groups of patients. The analyses presented in Table 1 showed significant differences for the number of lymphocytes present in peripheral blood (higher in HVs), platelets (higher in HT); thyroid‑stimulating hormone (TSH) levels (higher and HVs), as well as free triiodothyronine (fT3), free thyroxine (fT4), anti‑thyroid peroxidase (TPO), and anti‑thyroglobulin (TG), which were significantly higher in patients with HT than in the controls. We also decided to analyze the percentage of occurrence of particular lymphocyte subpopulations in the peripheral blood. The analyses showed that the percentage of CD45+, CD3+, and CD4+ were significantly lower in the patients with HT, while the percentage of CD8+ T lymphocytes was significantly higher. Next, we carried out an immunophenotypic assessment of the peripheral blood to assess the percentage of the tested TLRs (3, 7, 8, and 9) on selected subpopulations of T lymphocytes (CD4+ and CD8+) as well as B lymphocytes (CD19+) in the patients with HT and HVs. Detailed analysis of the observed changes in the percentage of individual TLRs is presented in Table 2. Next, we checked serum concentrations of sTLRs. The highest average values were recorded for sTLR9, followed by sTLR3, sTLR7, and sTLR8. Moreover, their comparison with the average values in HVs showed a 6.8‑fold increase for sTLR8 and sTLR3, 6.86‑fold rise for sTLR9, and 7.09‑fold gain for sTLR7.
Parameter | HT (n = 54) | HVs (n = 20) | P value | |
Data are presented as median and interquartile range.
Abbreviations: BAS, basophils; CD, cluster of differentiation; CRP, C‑reactive protein; EOS, eosinophils; fT3, free triiodothyronine; fT4, free thyroxine; Hb, hemoglobin; HT, Hashimoto thyroiditis; HV, healthy volunteer; LYM, lymphocyte; MON, monocyte; NA, not applicable, NEU, neutrophil; PLT, platelet; RBC, red blood cell; Th, T helper lymphocytes; anti‑TG, antithyroglobulin antibodies; anti‑TPO, antithyroid peroxidase antibodies; TSH, thyroid‑stimulating hormone; WBC, white blood cells | ||||
Age, y | 53.5 (49–59) | 54 (51–57.5) | 0.99 | |
Morphology and biochemistry of peripheral blood | WBC, 103/µl | 6.69 (4.58–7.89) | 6.11 (4.74–7.78) | 0.74 |
LYM, 103/µl | 1.73 (1.31–2.1) | 2.29 (2.28–2.84) | <0.001 | |
MON, 103/µl | 0.53 (0.39–0.71) | 0.44 (0.4–0.62) | 0.32 | |
NEU, 103/µl | 3.76 (2.27–4.94) | 3.22 (2.58–4.34) | 0.46 | |
EOS, 103/µl | 0.13 (0.08–0.17) | 0.1 (0.06–0.15) | 0.18 | |
BAS, 103/µl | 0.03 (0.02–0.05) | 0.03 (0.03–0.05) | 0.75 | |
RBC, 106/µl | 4.67 (4.47–5.13) | 4.47 (4.08–4.59) | 0.4 | |
Hb, g/dl | 13.75 (13–14.8) | 13.2 (12.3–13.65) | 0.19 | |
PLT, 103/µl | 296.97 (238–361) | 246 (224.5–295.5) | 0.04 | |
TSH, mIU/l | 0.01 (0.01–0.01) | 2.71 (2.71–3.52) | <0.001 | |
fT3, ng/dl | 11.9 (7.94–15.74) | 4.97 (4.23–5.71) | <0.001 | |
fT4, ng/dl | 30.95 (25.19–40.93) | 17.16 (15.28–19.26) | <0.001 | |
Anti‑TPO, IU/ml | 1423.13 (1237.5–1696.6) | 0.61 (0.28–0.81) | <0.001 | |
Anti‑TG, IU/ml | 156.28 (129–355.95) | 0.71 (0.33–0.95) | <0.001 | |
Thyroid gland volume, ml | 20.35 (15.30–24.38) | NA | NA | |
CRP, mg/l | 7.81 (5.2–12.98) | 2.48 (0.42–4) | <0.001 | |
Peripheral blood immunophenotype | CD45+, % | 93.47 (91.21–96.06) | 96.85 (94–98.13) | 0.03 |
CD3+, % | 69.38 (65.94–71.42) | 73.09 (71.14–76.54) | <0.001 | |
CD19+, % | 11.95 (10.02–13.87) | 12.17 (10.34–13.11) | 0.9 | |
CD4+, % | 27.57 (23.81–31.07) | 44.93 (41.28–47.29) | <0.001 | |
CD8+, % | 40.38 (36.36–44.47) | 28.21 (25.89–30.74) | <0.001 | |
Parameter | HT (n = 54) | HVs (n = 20) | P value | |
Data are presented as median (interquartile range).
Abbreviations: sTLR, soluble Toll‑like receptor; others, see Table 1 | ||||
Percentage of occurrence of the tested TLRs on T and B lymphocyte subpopulations | CD4+TLR3+ | 5.23 (3.43–6.03) | 0.66 (0.52–0.84) | <0.001 |
CD8+TLR3+ | 5.13 (3.9–6.47) | 0.67 (0.54–0.85) | <0.001 | |
CD19+TLR3+ | 5.64 (4.29–6.92) | 0.7 (0.55–0.98) | <0.001 | |
CD4+TLR7+ | 3.37 (2.42–4.22) | 0.44 (0.36–0.56) | <0.001 | |
CD8+TLR7+ | 3.56 (2.47–4.4) | 0.47 (0.31–0.61) | <0.001 | |
CD19+TLR7+ | 4.2 (3.03–5.32) | 0.53 (0.43–0.73) | <0.001 | |
CD4TLR8+ | 2.79 (2.08–3.48) | 0.38 (0.31–0.45) | <0.001 | |
CD8+TLR8+ | 2.91 (2.12–3.49) | 0.38 (0.25–0.5) | <0.001 | |
CD19+TLR8+ | 3.3 (2.58–4.33) | 0.44 (0.37–0.59) | <0.001 | |
CD4TLR9+ | 8.04 (5.13–8.95) | 0.98 (0.78–1.2) | <0.001 | |
CD8+TLR9+ | 7.2 (5.55–9.04) | 0.99 (0.75–1.14) | <0.001 | |
CD19+TLR9+ | 9.50 (7.03–11.29) | 1.21 (1.04–1.41) | <0.001 | |
Serum concentration of soluble TLRs, ng/ml | sTLR3 | 15.2 (12.92–17.82) | 2.37 (1.96–2.58) | <0.001 |
sTLR7 | 9.53 (8.1–11.43) | 1.33 (1.11–1.58) | <0.001 | |
sTLR8 | 8.66 (7.16–10.32) | 1.33 (0.95–1.52) | <0.001 | |
sTLR9 | 21.75 (18.85–24.44) | 3.03 (2.61–3.44) | <0.001 | |
Assessment of Epstein‑Barr virus reactivation on intracellular Toll‑like receptors in lymphocytes and serum concentration of their soluble forms in Hashimoto thyroiditis patients and healthy volunteers
In a subsequent stage of the study, we analyzed all recruited patients regarding microbiology and virology. Using qualitative PCR‑based tests in a certified hospital diagnostic laboratory, we did not detect any genetic material from hepatitis A, B, C, D, and E viruses, enteroviruses, adenoviruses, HIV, herpes simplex virus 1 and 2, cytomegalovirus, human papilloma virus, parvovirus B19, influenza virus, Borrelia burgdorferi, Chlamydia trachomatis, Ch. pneumoniae, Mycobacterium tuberculosis, Toxoplasma gondii, Ureaplasma spp., or Listeria spp. The only positive result in 26 of all participants was the detection of the EBV genetic material. The evaluations were repeated in our laboratory, and extended to include the assessment of serological profiles indicating active infection or virus reactivation in the examined patients.
The genetic material analysis confirmed EBV presence in 26 patients with HT (13 women and 13 men), while in the remaining participants, including the HVs, the result was negative (ie, less than 10 copies of the virus per 1 µg of DNA). Serological assessment using ELISA to measure the level of specific antibodies directed at the VCA, early antigen, and Epstein‑Barr nuclear antigen 1 (EBNA‑1) showed that EBV was reactivated in these patients (Supplementary material, Tables S1–S3).
Next, we analyzed the results again, considering patients with EBV reactivation (EBV+) and patients without signs of reactivation (EBV–). First, we reanalyzed the results regarding the characteristics of the studied patients and, more specifically, the clinical parameters, which we summarized in Supplementary material, Table S2. In HT EBV+ patients, we observed a significant increase in almost all assessed parameters of peripheral blood morphology, except for the level of basophils, red blood cells (RBCs), or hemoglobin, as compared with the EBV– patients (Supplementary material, Table S1). The analysis of the percentage of occurrence of the tested TLRs showed a significant increase in the mean observed values in the HT EBV+ patients, as compared with HT EBV– ones and HVs (Supplementary material, Table S3). The highest values were noticed for TLR9 in all selected lymphocyte subpopulations in HT EBV+ patients. All observed changes were significant for the HT patients and HVs (Supplementary material, Figure S2). We observed similar trends when analyzing sTLR concentrations, where the values of all analyzed sTLRs were significantly higher in HT EBV+ individuals than in HT EBV– ones and HVs (Figure 1A–1D).
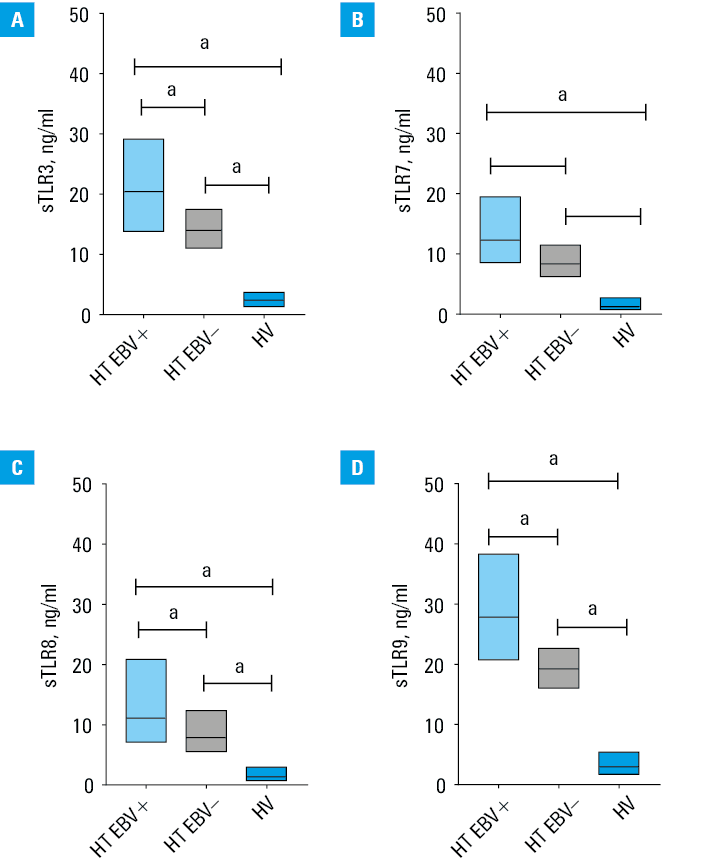
a Significant difference in comparison with the control group (P <0.05).
Abbreviations: EBV, Epstein‑Barr virus; others, see Tables 1 and 2
The Spearman rank correlation analysis of the results of immunophenotyping indicating the percentage of the tested TLRs and their soluble forms in the serum, as well as serological profiles and the number of EBV copies, confirmed 36 significant correlations in the entire investigated cohort (11 negative and 25 positive; Supplementary material, Table S4) and 62 correlations in the HT EBV– participants (2 negative and 60 positive; Supplementary material, Table S5).
The analysis of symptoms reported by patients and their medical history showed that HT EBV+ patients had a significantly higher percentage of individual symptoms than HT EBV– individuals. We recorded a 42.58% increase in the occurrence of goiter, a 36.54% increase in the patients with weight gain above 3 kg in the last year, a 48.63% increase in those who felt tired, weak, and deconcentrated, a 26.1% increase in the patients complaining of dry skin, a 51.92% increase in subcutaneous edema, a 48.9% increase in observed hair thinning, as well as a 41.21% increase in patients with tingling and numbness symptoms, and a 25.55% increase in those complaining of memory disorders. Additionally, in women, we recorded a 20.33% increase in reported menstrual disorders, while in men, there was a 12.36% increase in decreased libido (Figure 2). Libido was assessed based on self‑reported data in men only. Erectile dysfunctions were not specifically evaluated in this study.
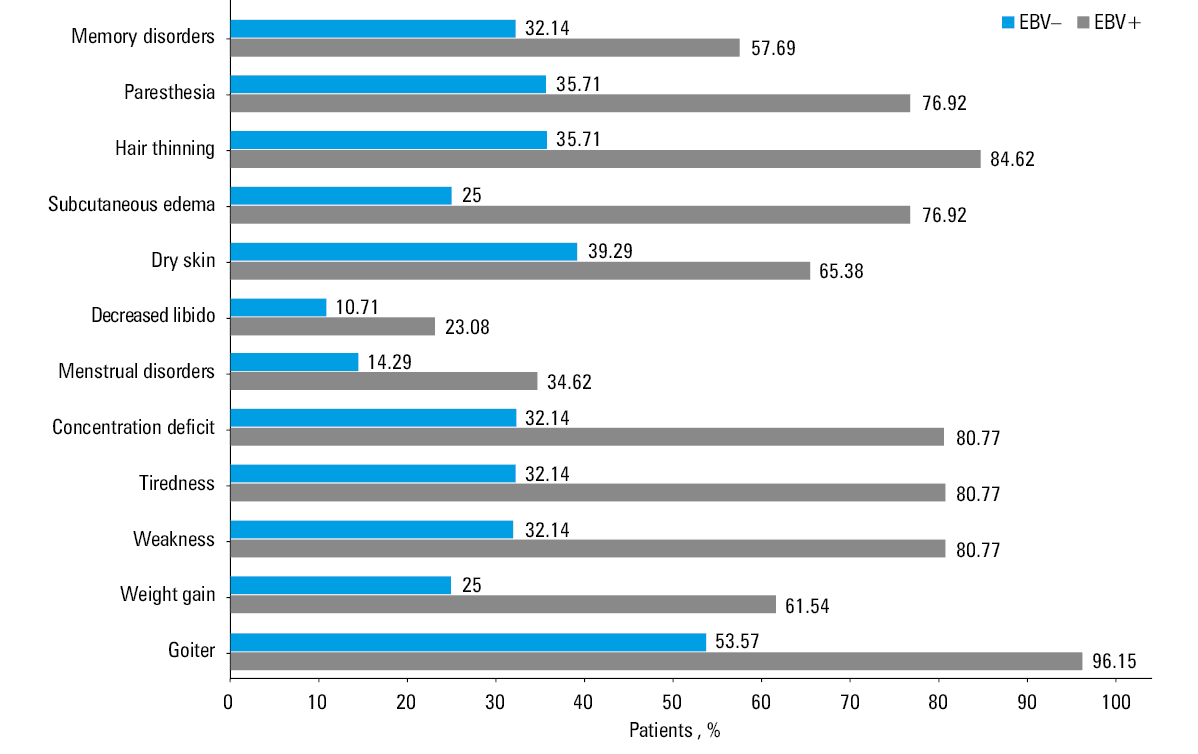
Abbreviations: see Figure 1
The aspect of changes observed in newly‑diagnosed patients with Hashimoto thyroiditis taking into account sex differences
Even though HT statistically occurs 8 times more often in women than in men, our research focused on multifactorial assessment of both sexes. The statistical analysis of morphological and biochemical blood parameters in men with diagnosed, untreated HT revealed that they had a significantly reduced TSH concentration, and by approximately 2 times higher fT3 and fT4 concentration than the HVs. The concentration of anti‑TPO antibodies was 2000‑fold higher and of anti‑TG antibodies 345 times higher than in the HVs, which was a basis of a differential diagnosis of HT. No significant differences were observed between morphological parameters in the group of men with HT and healthy men of the same age group (Supplementary material, Table S6). The phenotypic assessment of the main lymphocyte subpopulations from peripheral blood showed that the percentage of T lymphocyte subpopulations (CD3+), including CD8+ and CD4+, was significantly lower in the men with HT than in the healthy ones (Supplementary material, Table S6). However, both CD8+ and CD4+ lymphocytes and B lymphocytes showed a significantly higher percentage of cells with intracellular expression of TLR3, TLR7, TLR8, and TLR9. The most significant difference, as much as an 8‑fold higher percentage, was found for CD8+ and CD4+ lymphocytes and B lymphocytes with TLR9, which suggests a significant role of these cells in the pathogenesis of HT. The serum concentration of sTLR3, sTLR7, sTLR8, and sTLR9 determined by ELISA in HT men was higher than in the healthy men (P <0.001).
We paid a special attention to a significantly higher concentration of VCA IgM, VCA IgG, EBNA‑1 IgM, and EBNA‑1 IgG antibodies in the HT patients and HVs. The number of EBV copies in mononuclear cells of men with HT assessed by PCR was 200‑fold higher than in the group of healthy men. Therefore, we extended our analysis by differentiating men with HT into patients with and without EBV reactivation (Supplementary material, Table S7). Cytometric evaluation of leukocytes showed a significantly higher percentage of CD45+ cells, T lymphocytes (CD3+), including CD4+ and CD8+ lymphocytes, in HT EBV+ men than in HT EBV– ones. Therefore, we determined the intracellular expression of TLR3, TLR7, TLR8, and TLR9. In HT EBV+ men, the percentage of each of the examined subpopulations of T, Th, and Tc lymphocytes showed significantly higher expression of intracellular TLR3, TLR7, TLR8, and TLR9 than in HT EBV– men and healthy men volunteers. Interestingly, there were no significant differences in the percentage of Th, Tc, and B lymphocytes regarding intracellular expression of the examined TLRs among men with HT and healthy men. This suggests that the higher percentages of T lymphocytes (CD4+ and CD8+) and B lymphocytes expressing TLR3, TLR7, TLR8, and TLR9 in men are primarily influenced by EBV reactivation. This finding indicates that EBV reactivation, rather than mechanisms specific to the pathogenesis of HT, drives the observed upregulation of these TLRs (Supplementary material, Table S7).
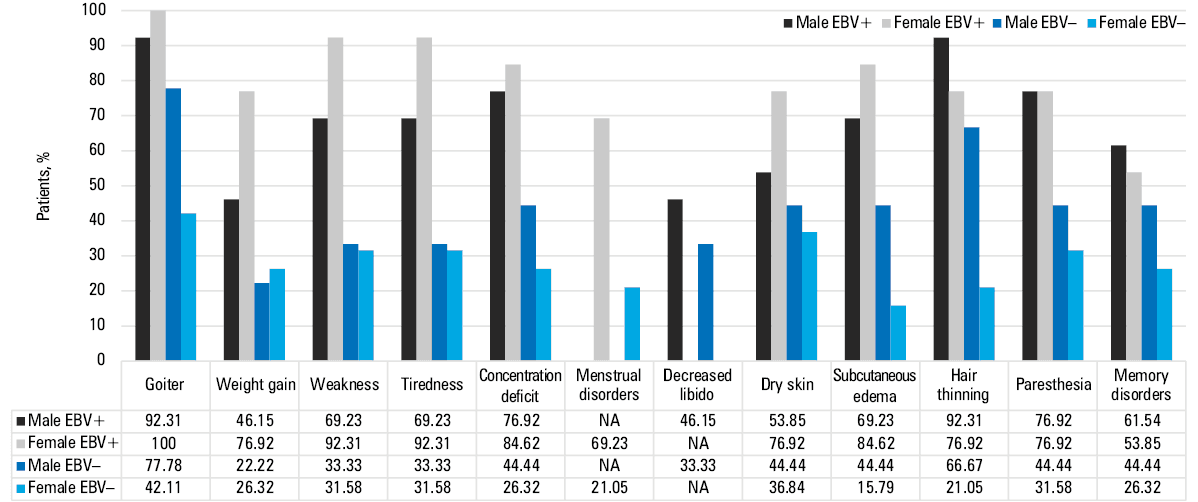
In the group of women with HT, we observed a significantly lower absolute number of lymphocytes, but a higher absolute number of eosinophils, RBCs, and platelets, as compared with healthy women. Only the percentage of CD8+ lymphocytes was significantly higher among women with HT than the healthy ones. There were no significant differences in the percentages of B lymphocytes (CD19+) between the examined women with HT and the healthy women. However, the percentage of CD4+ and CD8+ lymphocytes and B lymphocytes with intracellular expression of TLR3, TLR7, TLR8, and TLR9 was, on average, approximately 6–7 times higher in women with HT than in the healthy women, which may indicate the importance of TLR‑dependent interactions in the pathogenesis of HT. Serum levels of sTLRs were also found to be approximately 7‑fold higher in the women with HT than the healthy ones (Supplementary material, Table S8). Again, we focused on significantly higher concentration of VCA IgM, VCA IgG, EBNA‑1 IgM, and EBNA‑1 IgG antibodies in the group of women with HT vs the healthy women. The number of EBV copies in mononuclear cells of women with HT assessed by PCR was 100‑fold higher than in the group of healthy women. Similarly to men, women with HT were divided into EBV+ and EBV– subgroups. The absolute number of white blood cells, lymphocytes, monocytes, and neutrophils was approximately 2‑fold higher in the HT EBV+ women than HT EBV– ones. Regardless of EBV reactivation status, women with HT had significantly lower TSH levels, and higher levels of fT3, fT4, anti‑TPO, and anti‑TG antibodies than healthy controls. Cytometric evaluation of leukocyte subpopulations showed a significantly higher percentage of CD45+ cells and Tc lymphocytes (CD8+) in HT EBV+ than HT EBV– women. These results suggest that in the HT women the antiviral mechanisms during EBV reactivation mainly involve CD8+ lymphocytes. The serum concentrations of sTLR3, sTLR7, sTLR8, and sTLR9 in HT EBV+ women were significantly higher than in HT EBV– women and the healthy ones (Supplementary material, Table S9). Additionally, we analyzed the frequency of symptoms reported by patients, broken down not only by sex but also by EBV reactivation. Detailed data are summarized in Figure 3.
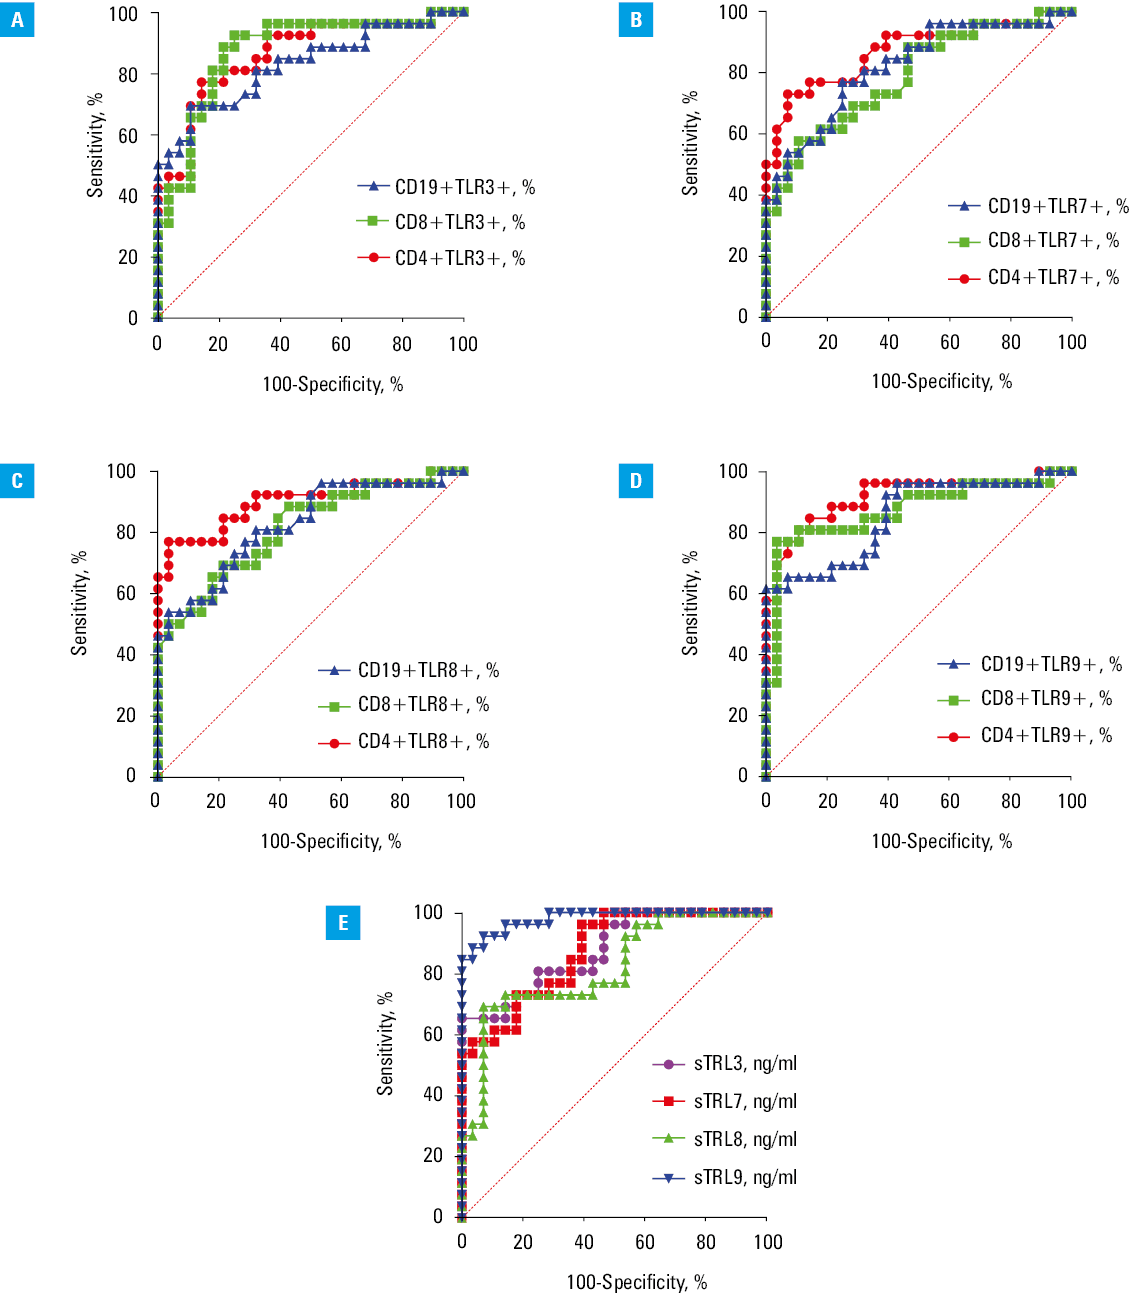
Receiver operating characteristic curve analysis
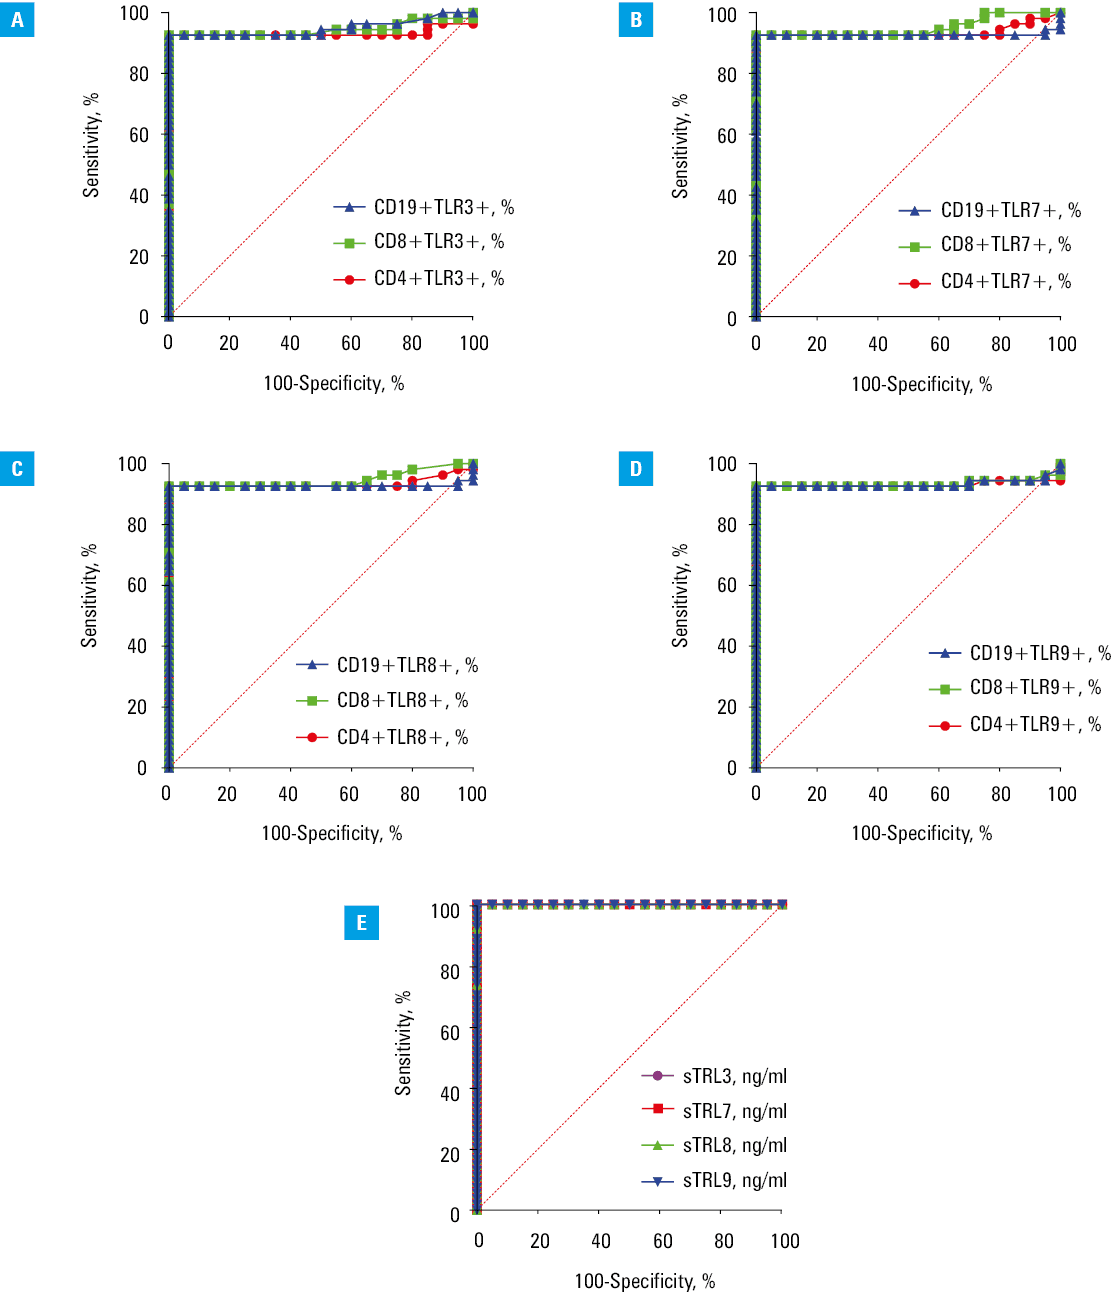
Due to significant changes in the occurrence rates and serum concentrations of the tested TLRs, we analyzed their potential as biomarker molecules for assessing immune activity in HT patients and their association with EBV reactivation.
We showed that the percentages of T and B lymphocytes with intracellular expression of TLR3 (Figure 4A), TLR7 (Figure 4B), TLR8 (Figure 4C), and TLR9 (Figure 4D) represented parameters with enough sensitivity and specificity for identifying HT patients vs HVs (P <0.001). Additionally, the concentrations of soluble TLR3, TLR7, TLR8, and TLR9 were efficient predictors of HT presence (P <0.001) (Figure 4; Supplementary material, Table S10). In the next stage, we assessed whether the obtained results could effectively differentiate patients with EBV reactivation. Using ROC curve analysis, we demonstrated that the percentage of T and B cells with intracellular expression of TLR3 (Figure 5A), TLR7 (Figure 5B), TLR8 (Figure 5C), and TLR9 (Figure 5D) provided enough sensitivity and specificity for distinguishing HT patients with a higher likelihood of EBV reactivation (P <0.001) (Supplementary material, Table S11). Additionally, serum concentration of the examined sTLRs in HT EBV+ patients may serve as a biomarker for EBV reactivation in HT patients (P <0.001) (Figure 5E).
Discussion
Recently, autoimmune thyroid diseases have been emerging as an increasing social problem, especially among the population of women of reproductive age.27 The clinical symptoms of these diseases result not only from hormonal disorders but, as it turns out, also from dysfunctions of key immune system components.28 Recent studies suggest that unexplained activation of innate immune response mechanisms may significantly impact the pathogenesis of HT. The results of this study showed that in the peripheral blood of patients with newly‑diagnosed HT, the percentage of T and B lymphocyte subpopulations with intracellular expression of TLR3, TLR7, TLR8, and TLR9 measured with flow cytometry was significantly higher than in the group of healthy people. Our research is consistent with the results of Peng et al,29 who used PCR to compare TLR1–TLR10 mRNA expression in autoimmune thyroid disease patients. Their study found that only TLR3 mRNA and TLR9 mRNA were significantly higher in HT patients than in healthy people, which coincides with the observations of our research team and indicates a significant role of the pathways dependent on TLR3 and TLR9 in the pathogenesis of HT.28 Differences in the expression of TLR7 and TLR8 at the mRNA and protein levels may be determined by the presence or absence of single nucleotide polymorphisms in a specific ethnic group.30 Recently, we have seen scientific reports highlighting the role of viral infections, including with parvovirus B19,31 hepatitis C virus,32 or SARS‑CoV‑2,33 in the pathogenesis of HT. However, few reports describe the impact of EBV reactivation on the occurrence or progression of this disease.34,35
One of such reports is a study by Nagata et al36 describing the role of EBV in the pathogenesis of Graves’ disease, suggesting that reactivation of EBV in thyrotropin receptor antibody (TRAb)-positive B cells stimulates their differentiation into CD138+ plasma cells and induces the production of TRAb autoantibodies, thus causing Graves’ disease.36 So far, it has been shown that EBV affects the activation of TLR receptors, among others TLR3, TLR7, TLR8, and TLR9.27,36 Our study showed that a significantly higher percentage of Th and Tc lymphocytes and B lymphocytes expressing TLR3, TLR7, TLR8, and TLR9 was present in the peripheral blood of HT EBV+ patients than in HT patients without EBV viremia. The coexpression of TLR3, TLR7, TLR8, and TLR9 in B lymphocytes, Th, and Tc lymphocytes in HT EBV+ patients may indicate their higher potential for mutual intracellular interactions. However, this raises concerns regarding the specificity of EBV ligands for these receptors in autoimmune thyroiditis. Perhaps CpG‑DNA for TLR9 can interact with TLR7 and TLR8 and control signaling in the pathways regulated by them.37,38 Additionally, our study showed higher serum concentrations of soluble forms of TLR3, TLR7, TLR8, and TLR9 in HT EBV+ patients as compared with HT EBV– individuals and HVs. These are among the first reports on the role of soluble forms of intracellular TLRs in the HT pathogenesis, including EBV reactivation.
Although this study provides valuable information on the relationship between EBV reactivation and intracellular TLR expression in patients with HT, several limitations should be considered when interpreting the results. First, the study cohort consisted of only 54 newly‑diagnosed, untreated patients with HT. Although this sample size is sufficient to observe significant trends, a larger cohort would provide more robust data and increase generalizability of the results. Also, while the study identified associations between EBV reactivation, TLR expression, and HT, it did not examine functional consequences of these interactions. To elucidate the mechanisms of EBV and TLR influence on the autoimmune processes, functional studies, including in vitro and in vivo experiments, are necessary.
Conclusions
Our study demonstrated a significant association between EBV reactivation and higher expression of intracellular TLRs, particularly TLR3, TLR7, TLR8, and TLR9, in newly‑diagnosed and untreated patients with HT. These findings suggest that both EBV reactivation and intracellular TLR activity may play critical role in the pathogenesis and progression of HT. The interplay between the virus reactivation and the innate immune response highlights the need for a comprehensive approach to treating HT. Clinicians should consider monitoring EBV status and TLR expression levels as part of the diagnostic and therapeutic process. Future research should focus on elucidating the precise mechanisms by which EBV and intracellular TLRs contribute to autoimmune processes in HT. Continued research in this area is critical to advancing our understanding of HT and its treatment, ultimately leading to better patient health outcomes.
- Wong Y, Meehan MT, Burrows SR, et al. Estimating the global burden of Epstein‑Barr virus‑related cancers. J Cancer Res Clin Oncol. 2022; 148: 31‑46. | Crossref
- Jha HC, Pei Y, Robertson ES. Epstein‑Barr virus: diseases linked to infection and transformation. Front Microbiol. 2016; 7: 1602. | Crossref
- Hislop AD, Taylor GS. T‑Cell responses to EBV. In: Münz C, editor. Epstein Barr Virus Volume 2: one herpes virus: many diseases. Cham: Springer International Publishing, 2015: 325‑353. | Crossref
- Yokota S, Okabayashi T, Fujii N. The battle between virus and host: modulation of toll‑like receptor signaling pathways by virus infection. Mediators Inflamma. 2010; 2 010: 184328. | Crossref
- Kempkes B, Robertson ES. Epstein‑Barr virus latency: current and future perspectives. Cur Opin Virol. 2015; 14: 138‑144. | Crossref
SUPPLEMENTARY MATERIAL
ARTICLE INFORMATION