Application of the TRI-SCORE to predict long-term mortality in acute heart failure patients with moderate-to-severe tricuspid regurgitation
Key words: acute heart failure, mortality, tricuspid regurgitation, TRI-SCORE


 CC BY-NC-SA 4.0
Application of the TRI-SCORE to predict long-term mortality in acute heart failure patients with moderate-to-severe tricuspid regurgitation
Introduction: Moderate‑to‑severe tricuspid regurgitation (TR) in the setting of acute heart failure (AHF) has been found to be associated with worse clinical outcomes. Recently, the TRI‑SCORE model was developed to predict clinical outcomes after isolated tricuspid surgery.
Objectives: Our aim was to determine whether this score could aid in risk stratification of AHF patients with moderate‑to‑severe TR.
Patients and methods: A total of 233 hospitalized patients with AHF and moderate‑to‑severe TR were included. We calculated the TRI‑SCORE for each patient, including the following parameters: age at least 70 years, New York Heart Association class at least III, right‑sided HF signs, daily furosemide dose at least 125 mg, glomerular filtration rate below 30 ml/min/1.73 m2, elevated total bilirubin concentration, left ventricular ejection fraction below 60%, and moderate‑to‑severe right ventricular dysfunction. The primary end point was all‑cause mortality during follow‑up.
Results: The median (interquartile range [IQR]) age was 74 (65–84) years, 129 patients (55.4%) were women. During median (IQR) follow‑up of 8 (2–21) months, 135 patients (57.9%) reached the primary end point. The patients with the primary end point had a higher median (IQR) TRI‑SCORE value than those without (8 [6–9] vs 6 [4–7]; P <0.001). The multivariable Cox regression analysis showed that a 1‑point increase in the TRI‑SCORE was a significant indicator of all‑cause mortality (hazard ratio, 1.25; 95% CI, 1.14–1.38; P <0.001). The Kaplan–Meier analysis showed early divergence of low (0–3), intermediate (4–5), and high (≥6) TRI‑SCORE curves (log‑rank; P <0.001).
Conclusions: The AHF patients with moderate‑to‑severe TR have a poor prognosis during follow‑up. TRI‑SCORE can predict all‑cause mortality in these patients.
What's new?
Patients with acute heart failure (AHF) and moderate‑to‑severe tricuspid regurgitation (TR) have a poor prognosis after hospital discharge. The TRI‑SCORE model was initially developed to predict in‑hospital mortality, specifically for patients undergoing isolated tricuspid valve surgery. However, its use beyond this intended patient group, such as for predicting all‑cause mortality in broader populations, remains relatively unexplored. This study investigates the applicability of the TRI‑SCORE model in patients with AHF and moderate‑to‑severe TR. High‑risk patients (TRI‑SCORE ≥6) had significantly poorer survival rates and clinical outcomes than those in the lower‑risk groups. In addition, the patients in the high TRI‑SCORE group required more intensive treatments during their hospital stay, such as inotropic support, paracentesis, and dialysis. These findings suggest that TRI‑SCORE may help clinicians identify high‑risk patients early and guide treatment decisions, potentially improving outcomes.
Introduction
Tricuspid regurgitation (TR) of moderate or advanced severity has a prevalence of 0.55% in the community setting,1 and it is higher in older individuals, in women, and heart failure (HF) patients.2 The vast majority of cases are secondary TR due to left‑sided heart disease, pulmonary hypertension, or right ventricular (RV) dysfunction, whereas primary TR due to valvular abnormalities is rare.
Secondary TR in both chronic and acute heart failure (AHF) has been associated with increased morbidity and mortality.3-8 In a recent study of 1176 patients with a primary diagnosis of AHF, Cocianni et al4 found that moderate‑to‑severe TR was common (approximately 30%), and was an independent contributor to worse clinical status. They reported that patients with moderate‑to‑severe TR were older, had more comorbidities, and had more severe HF than patients with trivial‑to‑mild TR.4
Recently, the TRI‑SCORE model, based on 8 clinical, laboratory, and echocardiographic parameters (age, New York Heart Association [NYHA] class, right‑sided HF signs, daily dose of furosemide, glomerular filtration rate [GFR], total bilirubin concentration, left ventricular ejection fraction [LVEF], and RV function) was developed to predict in‑hospital mortality after isolated tricuspid valve surgery.9,10 In TRIGISTRY, survival decreased with increasing TRI‑SCORE value in patients with severe TR who were conservatively managed.11
Although a substantial proportion of AHF patients with TR are at a risk for worse clinical outcomes, there is an unmet need for risk stratification in these patients. In our study, we sought to determine whether the TRI‑SCORE could predict clinical outcomes in AHF patients with moderate‑to‑severe TR.
Patients and methods
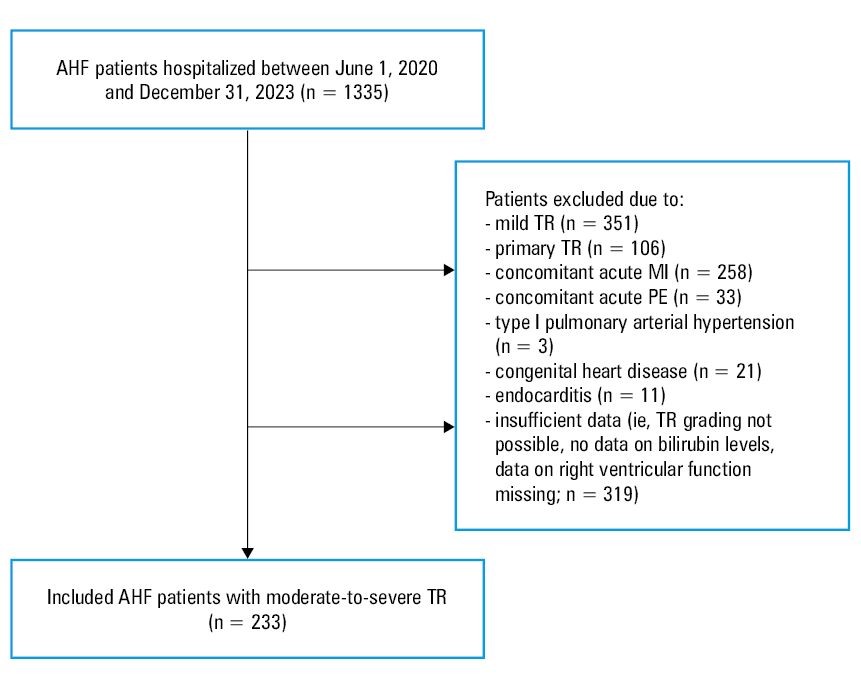
In our retrospective study, we analyzed consecutive patients above the age of 18 years hospitalized for AHF in our hospital between June 1, 2020, and December 31, 2023, with available echocardiographic assessment of TR. Data of the study population were obtained from the hospital’s electronic records. Designated investigators (OB, CO, YG, and YSÖ) retrospectively reviewed the cases.
The diagnosis of AHF was based on the clinical judgment of the attending cardiologist. All patients were managed and treated according to the guidelines of the European Society of Heart Failure.12 N‑terminal pro–B‑type natriuretic peptide (NT‑proBNP) concentration equal to or above 300 pg/ml supports the diagnosis of AHF.12 We defined advanced HF based on the following criteria outlined by the European Society of Cardiology: 1) severe symptoms (NYHA class III or IV) despite optimal medical, device, and surgical therapy; 2) severe cardiac dysfunction, such as reduced LVEF (<30%) or isolated RV dysfunction; 3) at least 1 hospital admission for HF in the past 12 months or need for continuous intravenous therapy to relieve congestion; and 4) severe impairment of exercise capacity, estimated to be of cardiac origin.
Primary TR cases were excluded. Patients with concomitant acute myocardial infarction (MI), pulmonary embolism, type I pulmonary arterial hypertension, congenital heart disease, or endocarditis were excluded from the study (Figure 1).
Diabetes mellitus was defined using the following criteria: 1) a fasting plasma glucose concentration equal to or above 126 mg/dl on 2 separate occasions; 2) a 2‑hour plasma glucose concentration equal to or above 200 mg/dl during an oral glucose tolerance test; and 3) a glycated hemoglobin (HbA1c) concentration equal to or above 6.5%.13
Coronary artery disease was defined as the presence of at least 1 of the following14: 1) stenosis (1 or more ≥50% stenoses in 1 or more epicardial coronary arteries, confirmed on either coronary angiography or coronary computed tomography angiography); 2) history of MI, that is, documented MI according to the Fourth Universal Definition of MI.15 This includes: 1) clinical symptoms consistent with myocardial ischemia, 2) elevated cardiac biomarkers above diagnostic thresholds (eg, troponin concentration exceeding the 99th percentile of the upper reference limit), 3) diagnostic electrocardiographic changes (such as new ST‑segment elevation or pathologic Q waves), 4) imaging evidence of new loss of viable myocardium or new regional wall motion abnormality.
Chronic kidney disease was defined according to Kidney Disease: Improving Global Outcomes guidelines as abnormalities of kidney structure or function, present for at least 3 months, with implications for health. Structural abnormalities (eg, polycystic kidneys or hydronephrosis) were identified on renal ultrasound, while functional abnormalities were confirmed by a persistent reduction in GFR below 60 ml/min/1.73 m2 and / or markers of kidney damage, such as albuminuria (≥30 mg/24 h), urine sediment abnormalities, or electrolyte imbalance due to tubular disorders.16 Chronic obstructive pulmonary disease was defined as a history of chronic respiratory symptoms (eg, dyspnea, cough, or sputum production) and persistent airflow obstruction.17 In AHF patients, we relied on these existing diagnoses, recognizing that symptoms such as dyspnea may overlap with lung congestion.
The study was approved by the institutional ethics committee (2024–47) and conducted in accordance with the Declaration of Helsinki.
The first echocardiographic assessment was generally performed and the other data were collected within 48 hours of admission. Preserved systolic function was defined as LVEF equal to or above 50%. The Simpson biplane method of disks was employed for quantifying LVEF, where the end‑diastolic and end‑systolic volumes were measured from apical 2- and 4‑chamber views. RV dysfunction was defined as RV fractional area change below 35% or tricuspid annular plane excursion (TAPSE) below 17 mm. We evaluated TR and mitral regurgitation (MR) severity using quantitative (proximal isovelocity surface area) or semi‑quantitative (vena contracta width) methods, while qualitative approach was used mainly as a support for quantitative / semiquantitative one.18 Moderate MR was defined by vena contracta width of 3–7 mm, regurgitant volume of 30–59 ml/beat, regurgitant fraction of 30%–49%, and EROA of 0.2–0.39 cm². Severe MR was characterized by vena contracta width equal to or above 7 mm, regurgitant volume equal to or above 60 ml/beat, regurgitant fraction equal to or above 50%, and EROA equal to or above 0.4 cm².
TR peak velocity was measured using continuous wave Doppler, and the tricuspid regurgitant gradient was calculated using the modified Bernoulli equation.19 Pulmonary artery systolic pressure was estimated by the sum of TR gradient and estimated right atrial pressure, calculated by inferior vena cava size and collapsibility.
We calculated the TRI‑SCORE for specific clinical parameters, that is age at least 70 years, NYHA class III to IV, right‑sided HF signs, furosemide daily dose of at least 125 mg, GFR below 30 ml/min/1.73 m2, elevated total bilirubin concentration, LVEF below 60%, and moderate / severe RV dysfunction.10 Right‑sided HF signs were defined by peripheral edema, dilatation of the jugular venous system, or the presence of ascites. Of these 8 clinical parameters, right‑sided HF signs, furosemide daily dose of at least 125 mg, GFR below 30 ml/min/1.73 m2, and elevated total bilirubin were associated with an odds ratio above 2 in the reference study; therefore, these variables were assigned 2 points, while the remaining parameters were assigned 1 point each.10 The TRI‑SCORE components were assessed at the time of admission for AHF, before initiating any treatment. This ensured that clinical status and laboratory results reflected the patient’s baseline presentation during acute decompensation.
The primary end point was all‑cause mortality during follow‑up. Outcome information was obtained from official hospital reports, direct contact with patients and their families, and regional health care data.
To ensure clarity in our analysis, we set the starting date as the first day of hospitalization for each patient and the censoring date as May 12, 2024. This date represents the end of the observation period for the study. Any patient who had not experienced the event of interest by this date is considered censored. This information is critical for interpreting the time‑to‑event data and understanding the scope of the analysis.
Statistical analysis
Continuous data were presented as mean (SD) for variables with a normal distribution and as median (IQR) for variables with a non‑normal distribution. The Kolmogorov–Smirnov test was primarily used to assess normality, supplemented by visual inspection of histograms and Q‑Q plots. The t test or Mann–Whitney test was used to compare measurement data between 2 groups according to the data distribution. Categorical data were expressed as counts (percentages), and differences between the groups were examined using the χ2 analysis or the Fisher exact test. In‑hospital treatments of patients stratified by the TRI‑SCORE were compared using the χ2 test. Estimates of cumulative event‑free survival were plotted using the Kaplan–Meier estimator. The Kaplan–Meier survival curves visually represent the time until an event occurs, such as death or disease progression, and account for censored data—instances where the outcome is not observed for all patients. Differences between the survival curves were tested using the log‑rank test. Univariable and multivariable Cox regression analyses were performed to identify risk factors for the primary outcome. Variables for the multivariable model were selected based on a combination of clinical relevance and statistical significance (P <0.1) in the univariable analyses. In addition, factors with known associations from previous literature were included to ensure a comprehensive model, even if they did not reach statistical significance in univariable analysis. Receiver operating characteristic (ROC) analyses were used to evaluate the predictive value of the independent variables for the primary end point. The area under the ROC curve (AUC) was calculated to quantify the overall ability of the model to discriminate between outcomes. The cutoff points for TRI‑SCORE were identified using the ROC curve analysis, with the optimal threshold determined by the Youden index. A 2‑tailed P value below 0.05 was considered significant. SPSS29.0 software (IBM Corp., Armonk, New York, United States) was used for statistical analysis.
Results
A total of 233 AHF patients with moderate‑to‑severe TR were hospitalized at our institution. Their median (IQR) age was 74 (66–81) years, 129 (55.5%) were women, and they were followed for a median of 8 (2–21) months. During follow‑up, 135 patients (57.9%) died from any cause, including 27 (11.6%) who died during hospitalization.
Baseline demographic, clinical, and laboratory characteristics of the study population are summarized in Table 1, and variables of the primary end point group were compared with those of the survivors. We found that the use of medications on admission, such as angiotensin‑converting enzyme (ACE) inhibitor / angiotensin receptor blocker (ARB) / angiotensin receptor / neprilysin inhibitor (ARNI), β-blockers, mineralocorticoid receptor antagonists (MRAs), and sodium‑glucose transport protein‑2 (SGLT‑2) inhibitors, was similar between the groups, with no significant differences. Patients with the primary end point had a lower baseline systolic blood pressure than those without the primary end point (118 [24] vs 127 [27] mm Hg; P = 0.008). Inotropes were used more frequently in the primary end point group than in the survivors (40.6% vs 13.3%; P <0.001), while vasodilators were used more frequently in the survivors than in the primary end point group (13.3% vs 5.2%; P = 0.03). Most patients (200 [85.9%]) presented with acute decompensated HF, while 33 (14.1%) had de novo AHF. The predominant AHF phenotype was “warm‑wet” (161 [69.1%] patients). Notably, the “warm‑dry” phenotype was more common among the survivors than among those who died (25.5% vs 5.2%), while the “cold‑wet” phenotype was more common in the all‑cause mortality group than in the survivors (22.2% vs 5.1%). At discharge, the surviving patients (n = 206) were prescribed the following medications: 52% ACE inhibitor / ARB / ARNI, 85.4% β-blockers, 9.7% SGLT‑2 inhibitors, and 58.7% MRAs.
Parameter | Nonsurvivors (n = 135) | Survivors (n = 98) | P value |
Data are presented as number (percentage) and median (interquartile range) unless provided otherwise.
SI conversion factors: to convert albumin to g/l, multiply by 10; bilirubin to µmol/l, by 17.104; hemoglobin to g/l, by 10; N‑terminal pro–B‑type natriuretic peptide to ng/l, by 1
Abbreviations: ACEi, angiotensin‑converting enzyme inhibitor; ARB, angiotensin receptor blocker; ARNI, angiotensin receptor / neprilysin inhibitor; HF, heart failure; ICD, implantable cardioverter‑defibrillator; MRA, mineralocorticoid receptor antagonist; SGLT‑2, sodium‑glucose contransporter 2; others, see Figure 1 | |||
Age, y | 74 (65–84) | 74 (67–78) | 0.21 |
Women | 81 (60) | 48 (49) | 0.09 |
Diabetes mellitus | 56 (41.5) | 43 (43.9) | 0.72 |
Coronary artery disease | 64 (47.4) | 53 (54.1) | 0.31 |
Peripheral artery disease | 30 (22.2) | 14 (14.3) | 0.13 |
Cerebrovascular accident | 7 (5.2) | 3 (3.1) | 0.52 |
Left‑sided valvular intervention | 12 (8.9) | 13 (13.3) | 0.29 |
History of pacemaker / ICD implantation | 22 (16.3) | 9 (9.2) | 0.12 |
Chronic obstructive pulmonary disease | 21 (15.6) | 16 (16.3) | 0.87 |
Chronic kidney disease | 84 (62.2) | 50 (51) | 0.08 |
Atrial fibrillation | 87 (67.4) | 71 (73.2) | 0.35 |
Medications on admission | |||
ACEi/ARB/ARNI | 46 (34.1) | 39 (39.8) | 0.37 |
β-Blockers | 78 (57.8) | 54 (55.1) | 0.68 |
MRA | 39 (28.9) | 32 (32.7) | 0.54 |
SGLT‑2 inhibitors | 7 (5.2) | 5 (5.1) | >0.99 |
Vital signs and in‑hospital treatment | |||
Systolic blood pressure, mm Hg, mean (SD) | 118 (24) | 127 (27) | 0.008 |
Heart rate, bpm, mean (SD) | 91 (23) | 91 (24) | 0.68 |
Vasodilators | 7 (5.2) | 13 (13.3) | 0.03 |
Inotropes | 57 (40.6) | 13 (13.3) | <0.001 |
Paracentesis | 10 (7.4) | 3 (3.1) | 0.41 |
Ultrafiltration / hemodialysis | 10 (7.4) | 3 (3.1) | 0.41 |
AHF presentation | |||
De novo | 20 (14.8) | 13 (13.3) | 0.74 |
Acute decompensated HF | 115 (85.2) | 85 (86.7) | |
AHF phenotype | |||
Warm‑dry | 7 (5.2) | 25 (25.5) | <0.001 |
Warm‑wet | 95 (70.4) | 66 (67.3) | |
Cold‑dry | 3 (2.2) | 2 (2) | |
Cold‑wet | 30 (22.2) | 5 (5.1) | |
Laboratory parameters | |||
Hemoglobin, g/dl | 10.7 (9.5–12.1) | 11.4 (9.5–12.9) | 0.13 |
Glomerular filtration rate, ml/min/1.73 m2 | 41 (28–57) | 53 (39–75) | <0.001 |
Sodium, mEq/l | 135 (132–139) | 138 (135–140) | 0.001 |
Potassium, mEq/l | 4.4 (4.1–4.9) | 4.7 (4.2–5.1) | 0.09 |
N‑terminal pro–B‑type natriuretic peptide, pg/ml | 9737 (5192–19 777) | 6305 (3233–13 419) | 0.003 |
Albumin, g/dl | 36 (33–39) | 38 (35–40) | 0.002 |
Total bilirubin, mg/dl | 1.0 (0.6–1.6) | 0.9 (0.6–1.3) | 0.09 |
The patients with the primary end point had lower median (IQR) levels of GFR (41 [28–57] vs 53 [39–75] ml/min/1.73 m2; P <0.001), sodium (135 [132–139] vs 138 135–140] mEq/l; P = 0.002), NT‑proBNP (9737 [5192–19 777] vs 6305 [3233–13 419] pg/ml; P = 0.003), and albumin (36 [33–39] vs 38 [35–40] g/dl; P = 0.002) than the survivors. Hemoglobin, total bilirubin, and potassium concentrations were similar in both groups.
Regarding echocardiographic variables, TAPSE was lower in the patients with the primary end point than in the survivors (13 [12–17] vs 18 [14–20] mm; P <0.001). Estimated pulmonary artery systolic pressure, LVEF, LV end‑diastolic diameter, left atrial diameter, and right atrial area were similar in both groups. The frequency of moderate‑to‑severe MR was also similar (Table 2).
Variable | Nonsurvivors (n = 135) | Survivors (n = 98) | P value |
Data are presented as number (percentage) and median (interquartile range) unless provided otherwise.
a Right heart failure signs were defined by peripheral edema, dilatation of the jugular venous system, or the presence of ascites.
Abbreviations: GFR, glomerular filtration rate; LA, left atrium; LVEDD, left ventricular end‑diastolic diameter; LVEF, left ventricular ejection fraction; MR, mitral regurgitation; NYHA, New York Heart Association; PASP, pulmonary artery systolic pressure; RA, right atrium; RV, right ventricle; TAPSE, tricuspid annular plane systolic excursion | |||
Echocardiography parameters | |||
LVEDD, mm | 54 (9) | 53 (8) | 0.77 |
LVEF, % | 37 (15) | 38 (14) | 0.61 |
TAPSE, mm | 13 (12–17) | 18 (14–20) | <0.001 |
Moderate‑to‑severe MR | 77 (57) | 56 (57.1) | 0.99 |
PASP, mm Hg | 55 (13) | 52 (12) | 0.15 |
LA diameter, mm, mean (SD) | 47 (5) | 47 (5) | 0.68 |
RA area, cm2, mean (SD) | 28 (4) | 28 (5) | 0.64 |
TRI‑SCORE components | |||
Age ≥70 years | 88 (65.2) | 64 (65.3) | 0.99 |
NYHA class ≥III | 130 (96.3) | 90 (91.8) | 0.14 |
Right heart failure signsa | 121 (89.6) | 70 (71.4) | <0.001 |
Daily furosemide dose ≥125 mg | 76 (56.3) | 26 (26.5) | <0.001 |
GFR <30 ml/min/1.73 m2 | 39 (28.4) | 10 (10.2) | <0.001 |
Elevated total bilirubin (>1.2 mg/dl) | 60 (44.4) | 29 (29.6) | 0.02 |
LVEF <60% | 120 (88.9) | 85 (86.7) | 0.62 |
Moderate / severe RV dysfunction | 104 (77) | 37 (37.8) | <0.001 |
TRI‑SCORE | 8 (6–9) | 6 (4–7) | <0.001 |
TRI‑SCORE subgroups | |||
Low TRI‑SCORE | 1 (0.7) | 15 (15.3) | <0.001 |
Intermediate TRI‑SCORE | 25 (18.5) | 29 (29.6) | |
High TRI‑SCORE | 109 (80.7) | 54 (55.1) | |
The distribution of TRI‑SCORE components in each group is summarized in Table 2. The TRI‑SCORE was higher in the patients with the primary end point than in those without it (8 [6–9] vs 6 [4–7]; P <0.001). Almost all patients (224 [94.4%]) were in the NYHA class III or higher, a result similar in both groups. Among the 8 components, signs of right‑sided HF (89.6% vs 71.4%; P <0.001), daily furosemide dose of at least 125 mg (56.3% vs 26.5%; P <0.001), GFR below 30 ml/min/1.73 m2 (28.4% vs 10.2%; P <0.001), elevated total bilirubin concentration (44.4% vs 29.6%; P = 0.021), and moderate / severe RV dysfunction (77% vs 37.8%; P <0.001) were more common in the patients with the primary end point. The proportion of patients aged at least 70 years and with LVEF below 60% was similar in both groups.
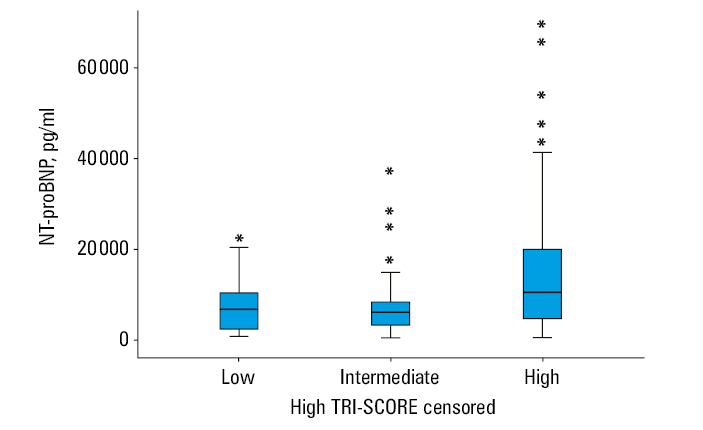
The participants were divided into 3 subgroups according to TRI‑SCORE value: low (0–3), intermediate (4–5), and high (≥6). More than two‑thirds of the study population (70%) were in the high TRI‑SCORE subgroup, followed by the intermediate (23.2%) and low (6.9%) subgroups. The high TRI‑SCORE subgroup had a higher concentration of NT‑proBNP than the intermediate and low subgroups (10 477 [4707–20 077] vs 6160 [3273–8350] vs 6766 [2230–10 429]; P <0.001, respectively) (Figure 2). Inotropes were also used more frequently in the high TRI‑SCORE subgroup than in the other groups (37.4% vs 14.8% vs 6.3%; P <0.001). Paracentesis and ultrafiltration / hemodialysis were initiated significantly more frequently in the high TRI‑SCORE subgroup. The use of vasodilators did not differ between the subgroups (Table 3).
Parameter | Low TRI‑SCORE (n = 16) | Intermediate TRI‑SCORE (n = 54) | High TRI‑SCORE (n = 163) | P value |
Data are presented as number (percentage).
a Includes intravenous nitroglycerine
b Includes noradrenaline, dopamine, dobutamine, and adrenaline
c Paracentesis and ultrafiltration / hemodialysis were used during initial hospitalization for acute heart failure. | ||||
Vasodilatorsa | 1 (6) | 5 (9) | 14 (8.6) | 0.93 |
Inotropesb | 1 (6) | 8 (15) | 61 (37.4) | <0.001 |
Paracentesisc | 0 | 0 | 14 (8.6) | 0.04 |
Ultrafiltration / hemodialysisc | 0 | 0 | 14 (8.6) | 0.04 |
The multivariable Cox regression analysis showed an increased hazard of the primary end point associated with a 10 mm Hg reduction in systolic blood pressure on admission (hazard ratio [HR], 1.09; 95% CI, 1.01–1.18; P = 0.048), a 5 mEq/l decrease in sodium level (HR, 1.26; 95% CI, 1.06–1.5; P = 0.009), a 1‑point increase in TRI‑SCORE (HR, 1.25; 95% CI, 1.14–1.38; P <0.001), and the use of inotropes (HR, 2.08; 95% CI, 1.36–3.18; P <0.001) (Table 4). The TRI‑SCORE equal to or above 7 was predictive of all‑cause mortality with a sensitivity of 74% and specificity of 65% (AUC, 0.76; P <0.001).
Parameter | Univariable | Multivariable | ||
HR (95% CI) | P value | HR (95% CI) | P value | |
Abbreviations: HR, hazard ratio | ||||
Systolic blood pressure at admission (per 10 mm Hg decrease) | 1.134 (1.048–1.227) | 0.002 | 1.09 (1.006–1.183) | 0.048 |
Albumin (per 10 g/dl decrease) | 1.678 (1.2–2.346) | 0.002 | 1.34 (0.932–1.925) | 0.11 |
N‑terminal pro–B‑type natriuretic peptide (per 1000 pg/ml increase) | 1.012 (1–1.024) | 0.048 | 1.003 (0.988–1.019) | 0.69 |
Sodium (per 5 mEq/l decrease) | 1.244 (1.091–1.418) | 0.001 | 1.262 (1.059–1.504) | 0.009 |
TRI‑SCORE (1‑point increase) | 1.311 (1.212–1.418) | <0.001 | 1.253 (1.139–1.379) | <0.001 |
Treatment with inotropes during hospitalization | 3.67 (2.57–5.24) | <0.001 | 2.079 (1.357–3.184) | <0.001 |
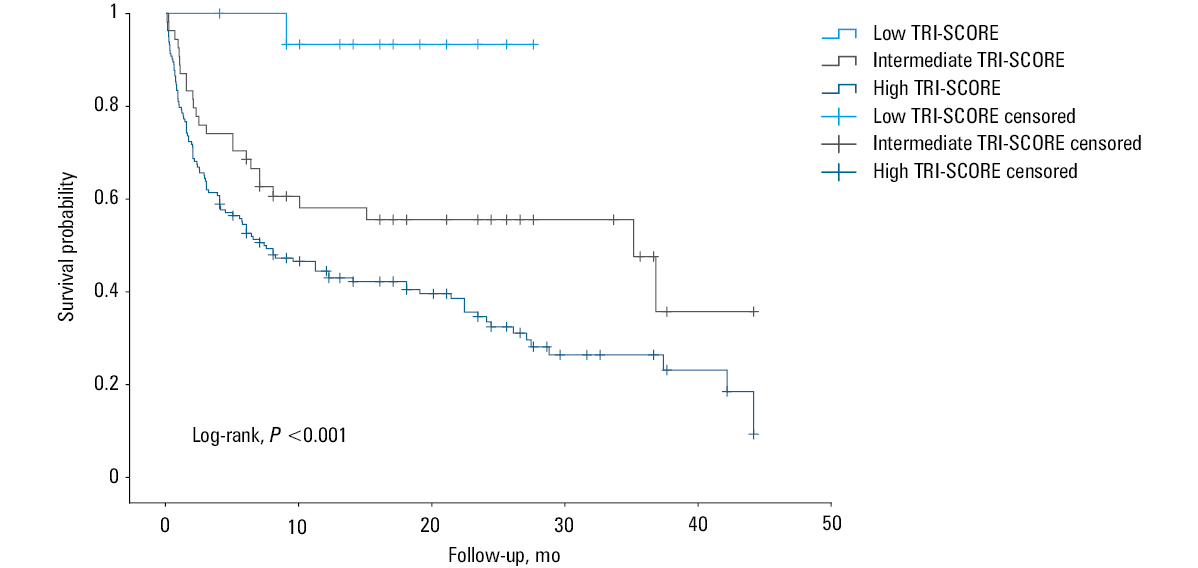
The Kaplan–Meier survival curves for clinical outcomes in the 3 TRI‑SCORE subgroups are shown in Figure 3. The low TRI‑SCORE group was censored earlier due to differences in the length of follow‑up between the groups. The high TRI‑SCORE subgroup demonstrated worse outcomes than the other subgroups (log‑rank, P <0.001).
Discussion
In this retrospective study, we evaluated whether the TRI‑SCORE model could aid in the risk stratification of AHF patients with moderate‑to‑severe TR. The main findings of our study can be summarized as follows: 1) AHF patients with moderate‑to‑severe TR have a poor prognosis after discharge (39.1% experienced all‑cause death at 1 year); 2) TRI‑SCORE well predicted all‑cause death with an AUC of 0.76 in these patients; 3) high TRI‑SCORE (≥6) indicated a worse clinical outcome, as compared with intermediate (4–5) and low (0–3) subgroups.
In hospitalized AHF patients, moderate‑to‑severe TR hinders effective decongestion,20 is a strong predictor of HF readmission,21 and has been associated with worse clinical outcomes.4 Chronic volume overload and preload lead to a deteriorative process of progressive dilatation, increasing severity of TR, RV dysfunction, and ultimately increased all‑cause mortality.22-26 Clinically, systemic venous congestion and, at advanced stages, decreased cardiac output and end‑organ damage may occur in the setting of TR. Systemic venous congestion leads to a decrease in GFR. Increased renal venous pressure is an independent predictor of worsening renal function in AHF patients.27 Liver failure may also develop due to hepatic congestion and reduced perfusion in severe TR.22,23,28 Recent evidence suggests that optimizing decongestive strategies, including the use of targeted pharmacologic interventions, may improve outcomes in AHF patients with volume overload.29
In our study, all‑cause mortality occurred in a substantial proportion of patients at 1 year, as compared with the moderate‑to‑severe TR group (n = 352) in the study by Cocianni et al (39.1% vs 22.8%). There may be several reasons for this difference. While the median age of our patients was similar (74 vs 73 years), the proportion of women was higher in our study (55.7% vs 38.1%). The mean (SD) LVEF (37% [15%] vs 37% [17%]) and pulmonary artery systolic pressure (53.3 [15.74] vs 53 [13] mm Hg) were similar in both studies. However, the medical history of our patients differed from that reported by Cocianni et al.4 Diabetes mellitus (41.8% vs 35.5%), coronary artery disease (50.2% vs 38.9%), chronic kidney disease (57.5% vs 41.2%), and atrial fibrillation (69.9% vs 45.7%) were more common in our participants. Median (IQR) NT‑proBNP concentration was also higher in our patients (7906 [3998–16 226] vs 5528 [2583–13 706] pg/ml), which may indicate that our patients may have been sicker than those investigated by Cocianni et al.4 Notably, there was underuse of the guideline‑directed medical therapy (GDMT) among the study population on admission. At discharge, a significant improvement in the prescription of GDMT was observed among the surviving patients. Specifically, 52% received ACE inhibitors / ARBs / ARNIs, 85.4% received β-blockers, 58.7% MRAs, and 9.7% SGLT‑2 inhibitors. However, the suboptimal use of certain key therapies, such as SGLT‑2 inhibitors and MRAs, suggests room for further optimization. The underutilization of these therapies, especially on admission, may partly explain the high mortality rates reported in Turkey, as highlighted by Yilmaz et al,30 identifying an opportunity to improve patient outcomes through better initiation and continuation of GDMT.
Our study demonstrated that the TRI‑SCORE model was useful in predicting all‑cause mortality during follow‑up in hospitalized AHF patients with moderate‑to‑severe TR, which to our knowledge is a novel finding in the literature. Some components of the TRI‑SCORE (right‑sided HF signs, elevated bilirubin concentrations, reduced GFR, moderate‑to‑severe RV dysfunction) are related to the aforementioned pathophysiological mechanisms in the setting of AHF and TR and could be simple indicators of the advanced stage of the disease. Our finding that NT‑proBNP concentrations were higher in the high TRI‑SCORE subgroup (≥6) than in the other subgroups could also objectively support this hypothesis. Increasing TRI‑SCORE predicted worse outcomes in the severe TR patients of the TRIGISTRY who were conservatively managed. We note that the score may help in risk stratification not only of isolated severe TR patients requiring valvular intervention, but also of AHF patients with secondary moderate‑to‑severe TR.This shift in its application demonstrates the potential versatility of the score. High‑risk patients may require closer follow‑up and more intensive use of both medical and interventional therapies.
Future research should focus on validating this finding in independent cohorts of AHF patients with moderate‑to‑severe TR. Such validation would strengthen the evidence supporting the expanded use of the TRI‑SCORE and help determine whether recalibration or adjustments are necessary for nonsurgical populations.
Our study has several limitations. First, the sample size was relatively small, with 233 patients from a single tertiary center, which may limit the generalizability of our findings. Second, the retrospective design introduces a potential selection bias. The higher all‑cause mortality at 1 year, as discussed above, may reflect the fact that we enrolled patients from a tertiary referral hospital who were older, had more comorbidities, and predominantly had advanced HF. Third, the TRI‑SCORE was assessed at the time of admission for AHF, prior to treatment initiation. Some components, such as NYHA class, GFR, total bilirubin concentration, and furosemide use, may change over time. While acknowledging this dynamic nature, the TRI‑SCORE demonstrated a positive association with long‑term survival outcomes. Future studies should examine whether changes in these parameters during follow‑up affect the predictive accuracy of the score.
Conclusions
Our study showed that AHF patients with moderate‑to‑severe TR were at a high risk for worse clinical outcomes. The TRI‑SCORE, which consists of 8 clinical, echocardiographic, and laboratory parameters and was developed primarily for clinical outcomes in patients undergoing isolated tricuspid valve surgery, may also be useful in predicting survival in AHF patients with moderate‑to‑severe TR.
- Topilsky Y, Maltais S, Medina Inojosa J, et al. Burden of tricuspid regurgitation in patients diagnosed in the community setting. JACC Cardiovasc Imaging. 2019; 12: 433‑442. | Crossref
- Benfari G, Antoine C, Miller WL, et al. Excess mortality associated with functional tricuspid regurgitation complicating heart failure with reduced ejection fraction. Circulation. 2019; 140: 196‑206. | Crossref
- Prihadi EA, Delgado V, Leon MB, et al. Morphologic types of tricuspid regurgitation: characteristics and prognostic implications. JACC Cardiovasc Imaging. 2019; 12: 491‑499. | Crossref
- Cocianni D, Stolfo D, Perotto M, et al. Association of tricuspid regurgitation with outcome in acute heart failure. Circ Cardiovasc Imaging. 2023; 16: 566‑576. | Crossref
- Messika‑Zeitoun D, Verta P, Gregson J, et al. Impact of tricuspid regurgitation on survival in patients with heart failure: a large electronic health record patient‑level database analysis. Eur J Heart Fail. 2020; 22: 1803‑1813. | Crossref
ARTICLE INFORMATION