Assessment of regional cerebral oxygen saturation and end-tidal carbon dioxide in prediction of a return of spontaneous circulation and patient outcome after in-hospital cardiac arrest
Key words: cardiopulmonary resuscitation quality, near-infrared spectroscopy, neuroprognostication, regional cerebral oxygen saturation, return of spontaneous circulation prediction

 CC BY 4.0
Assessment of regional cerebral oxygen saturation and end-tidal carbon dioxide in prediction of a return of spontaneous circulation and patient outcome after in-hospital cardiac arrest
Introduction: Cerebral oximetry measurement using near‑infrared spectroscopy (NIRS) has been highlighted as a technology that can provide noninvasive information on regional cerebral oxygen saturation (rSO2) during cardiopulmonary resuscitation (CPR), even though its effectiveness has not been fully confirmed. The research focused on the use of NIRS to predict the return of spontaneous circulation (ROSC) and neurological outcomes.
Objectives: The purpose of the study was to evaluate the validity of rSO2 vs end‑tidal carbon dioxide (ETCO2) measurement during CPR and its association with ROSC, as well as to assess the neuroprognostic value of NIRS.
Patients and methods: The study was carried out from January 11, 2023 to January 31, 2024, at the University Hospital, Kraków, Poland. The study group included 104 patients who experienced in‑hospital cardiac arrest. The values of rSO2 and ETCO2 were monitored during CPR and for 24 hours after ROSC.
Results: The group of patients who achieved spontaneous circulation during CPR (ROSC group) had higher rSO2 values than the non‑ROSC group throughout the resuscitation period (63.8% vs 35.6%; P <0.001). Cerebral oximetry demonstrated higher predictive efficacy of rSO2 than ETCO2 as an indicator of ROSC (area under the curve [AUC], 0.978 vs 0.815; P <0.001). The mean rSO2 value equal to or above 66% during CPR was associated with a higher chance of survival within 30 days (AUC, 0.992; 95% CI, 0.98–1).
Conclusions: The rSO2 value is a more sensitive indicator of ROSC than ETCO2. Higher rSO2 values are associated with a higher probability of achieving ROSC. The monitoring of rSO2 during CPR provides prognostic information.
What's new?
The brain, as the organ most sensitive to hypoxia during cardiopulmonary resuscitation, requires continuous and precise monitoring. A technology that measures regional cerebral oxygen saturation using near‑infrared spectroscopy is simple and noninvasive. In our study, this technology was used by a specialized resuscitation team during advanced resuscitation procedures and postresuscitation care, along with simultaneous monitoring of end‑tidal carbon dioxide and the entire cardiopulmonary resuscitation process. We determined regional cerebral oxygen saturation values and their relationship with return of spontaneous circulation and 30‑day survival, which had not been previously studied in such a large group of patients.
Introduction
In‑hospital cardiac arrest (IHCA) is an incident that can potentially affect any patient admitted to a hospital ward.1 IHCA is associated with high mortality rates, and although the success rate of resuscitation and return of spontaneous circulation (ROSC) ranges from 36% to 54%, the probability of survival to hospital discharge or 30‑day survival is only 15% to 34%. In the longer term, unfavorable neurological outcomes (cerebral performance category [CPC] 1–2) occur in 10% to 50% of patients who survive CA.2-5
According to the guidelines of the European Resuscitation Council (ERC) and the American Heart Association, to ensure high‑quality cardiopulmonary resuscitation (CPR), chest compression mechanics and end‑tidal carbon dioxide (ETCO2) should be monitored. Brain oximetry has been highlighted as a technology that can provide noninvasive information on regional cerebral oxygen saturation (rSO2) during CPR.6,7 Near‑infrared spectroscopy (NIRS) uses electromagnetic waves with a length of 750–1000 nm. NIRS devices utilize the difference in near‑infrared light absorption by oxygenated and deoxygenated hemoglobin.8-10 NIRS, in combination with other monitoring methods, such as capnography, can become a crucial part of advanced monitoring in cardiac arrest and postresuscitation care. The application of NIRS during CA focuses on the use of this technology to assess the quality of CPR, predict ROSC and favorable neurological outcomes after ROSC, and classify a patient as requiring extracorporeal cardiopulmonary resuscitation (ECPR).10,11
In this study, we focused on using NIRS to predict ROSC and long‑term neurological outcomes. To date, there have been no studies showing the usefulness of using NIRS by rapid response teams (RRTs) in the context of monitoring rSO2 during advanced life support (ALS). Our aim was to analyze the dynamics of rSO2 during CA and to study the predictive value of rSO2 in comparison with ETCO2 monitoring in achieving ROSC and in the prognosis of long‑term neurological outcomes.
Patients and methods
The study was carried out from January 11, 2023 to January 31, 2024, at the University Hospital, Kraków, Poland. The study group consisted of patients who experienced IHCA. Ethical approval was obtained from the Kielce Bioethics Committee, Poland (11/2023) and from the University Hospital in Kraków (as of December 1, 2022). The RRT connected the rSO2 and ETCO2 monitoring devices to each patient during IHCA within no more than 5 minutes after recognizing CA. For ROSC patients, the measurement of rSO2 was continued for 24 hours. Before starting the study, the RRT was trained on operating the device, properly applying electrodes for rSO2, and correctly attaching the ETCO2 sensor. The inclusion criteria comprised sudden CA in hospitalized patients, age over 18 years, and normothermia. The exclusion criteria were no connection of the rSO2 and ETCO2 sensor or its malfunction (electrode or device) during CPR, hospital admission during CPR, CA occurring in patients hospitalized in the intensive care unit, CA occurring in the operating theater, placement of the rSO2 monitoring sensor later than within 5 minutes since the occurrence of CA, suspicion of internal or external bleeding, or palliative care.
Hospital and rapid response team
The University Hospital in Kraków is one of the largest clinical hospitals in Poland. According to 2023 data, Krakow University Hospital operates 40 inpatient wards (including the Emergency Department). The total number of hospital admissions in 2023 was 90 940. The RRT at Krakow University Hospital was established in 2020. The team has been the first of this kind in Poland. It consists of 4 people, that is, a specialist in anesthesiology and intensive care, a trained anesthesiologist and intensive care physician, and 2 paramedics. The RRT is available via emergency number 2222 and functions as a separate organizational unit within the Department of Anesthesiology and Intensive Care. All team members held a valid ALS course certification during the study. Since 2021, standardized resuscitation carts have been implemented throughout the University Hospital, available on every ward, sealed and ready for use in the event of clinical deterioration or CA. The RRT is equipped with a resuscitation backpack, which includes an advanced diagnostic and anesthesiology module, as well as a mechanical chest compression system, a transport ventilator and a Masimo Open Connect (MOC‑9) monitor (Masimo, Irvine, California, United States) to measure ETCO2 and rSO2.
Cardiopulmonary resuscitation and near‑infrared spectroscopy
The CPR procedure was carried out according to the ERC 2021 guidelines.2 After the RRT received the call and arrived at the scene where the patient experienced IHCA, they took over CPR from the ward’s nursing‑medical team. The electrodes for rSO2 monitoring were placed according to the manufacturer’s recommendations by a designated trained team member. rSO2 and ETCO2 values were recorded at 2‑second intervals using the MOC‑9 module. The rSO2 monitoring lasted from the sensor connection (10 seconds were allocated for the device calibration) until CPR cessation or ROSC, and in the case of ROSC also for 24 hours (postresuscitation care). The rSO2 reading was visible on the monitor but did not influence IHCA management. Ventilation was performed asynchronously after intubation or placement of a supraglottic device using a self‑inflating bag or a ventilator with a CPR function. The ETCO2 sensor was placed behind the breathing filter. The entire course of in‑hospital CPR was documented according to the Utstein Resuscitation Registry Template for IHCA.12
To assess the change in the mean rSO2 value during CPR, 3 time points were evaluated: 1) Ma indicating the mean value of rSO₂ from the first 2 minutes of resuscitation after connecting the sensor, 2) Mb indicating the mean value of rSO₂ from the middle 2 minutes of resuscitation, and 3) Mc indicating the mean value of rSO2 of the last 2 minutes of resuscitation.
To assess the dynamics of rSO2 changes and assume that ROSC occurred in a 2‑minute CPR loop, ∆rSO2 was calculated. During rhythm evaluation (at the beginning of the 2‑minute loop), the rSO2 value was read, and the next value was read at the end of that loop. The difference between these values was defined as ∆rSO2.
Statistical analysis
The Shapiro–Wilk test was used to determine the data distribution. Then, the skewness was assessed, and histogram plots were analyzed. The distribution of rSO2 and ETCO2 values approximated the normal distribution in both subgroups (non‑ROSC and ROSC). The t test was used to compare 2 independent groups. The 1‑way analysis of variance (ANOVA) or Welsh ANOVA was used for comparing more than 2 independent groups. The Bonferroni or Games–Howell test was used for post hoc analysis. A general linear model with the Bonferroni adjustment for multiple comparisons was used to assess the dynamics of rSO2 changes during CPR in the study subgroups. The receiver operating characteristic (ROC) curve analysis was performed to assess the predictive capacity of ETCO2 and rSO2 for ROSC. To compare the ability of rSO2 and ETCO2 to predict ROSC, the mean values from the first 2 minutes after the NIRS sensor was attached were used. The ROC curves for the 2 parameters: mean ETCO2 (M ETCO2) and mean rSO2 (M rSO2) were analyzed. Data are presented as mean with SD and median with interquartile range (IQR).
Factors previously considered to be associated with IHCA outcomes, such as age, sex, initial rhythm, and age‑adjusted Charlson comorbidity index (AACCI),2 as well as the studied factors of rSO₂ and ETCO₂, were included in a univariate logistic regression model. The logistic regression model was used to identify factors potentially associated with ROSC. Missing data were imputed using the mean of the preceding and following periods, assuming that the missing data occurred randomly (missing at random). Data missing constituted a maximum of 10% per patient. The significance level was established at α = 0.05 and a P value below 0.05 was considered significant. Statistical analyzes were performed using IBM SPSS Statistics software, version 29.0 for MacOS (IBM Corp., Armonk, New York, United States). To determine the optimal cutoff points for ROC curves, the R software (R Foundation for Statistical Computing, Vienna, Austria) with the cutpointr package was used. To compare the ROC curves for the 2 predictive variables, MedCalc software (MedCalc Software Ltd, Ostend, Belgium) was used with the analysis carried out using the DeLong method.13
Results
The total number of IHCAs during the study period was 152, of which simultaneous monitoring of ETCO₂ and rSO₂ was achieved in 121 cases. Seventeen patients were excluded from the study, with a total of 104 patients finally included. ROSC was achieved in 54 patients (51.9%), with 30‑day survival, and CPC 1 or 2 was reached in 9 patients (8.7%). The data are presented in Figure 1. Men constituted 63.5% of the study cohort, and its mean (SD) age was 68 (12) years. Upon hospital admission, 85.6% of the patients had a neurological status assessed as good or as moderate disability (CPC 1–2). The median (IQR) AACCI was 4 (2–4), indicating a moderate burden of the disease but increased risk of mortality. The median (IQR) duration of the hospital stay before the occurrence of CA was 3 (1–8) days, and 41 patients (39.4%) experienced CA within the first 48 hours. Data broken down by groups are presented in Table 1. The most common initial IHCA rhythms were nonshockable rhythms: pulseless electrical activity (n = 54; 51.9%) and asystole (n = 33; 31.7%). Ventricular fibrillation and pulseless ventricular tachycardia constituted 11.5% and 4.8%, respectively. The origin of CA was identified as cardiac (n = 36; 34.5%), respiratory (n = 24; 23.1%), and other (n = 44; 42.3%).
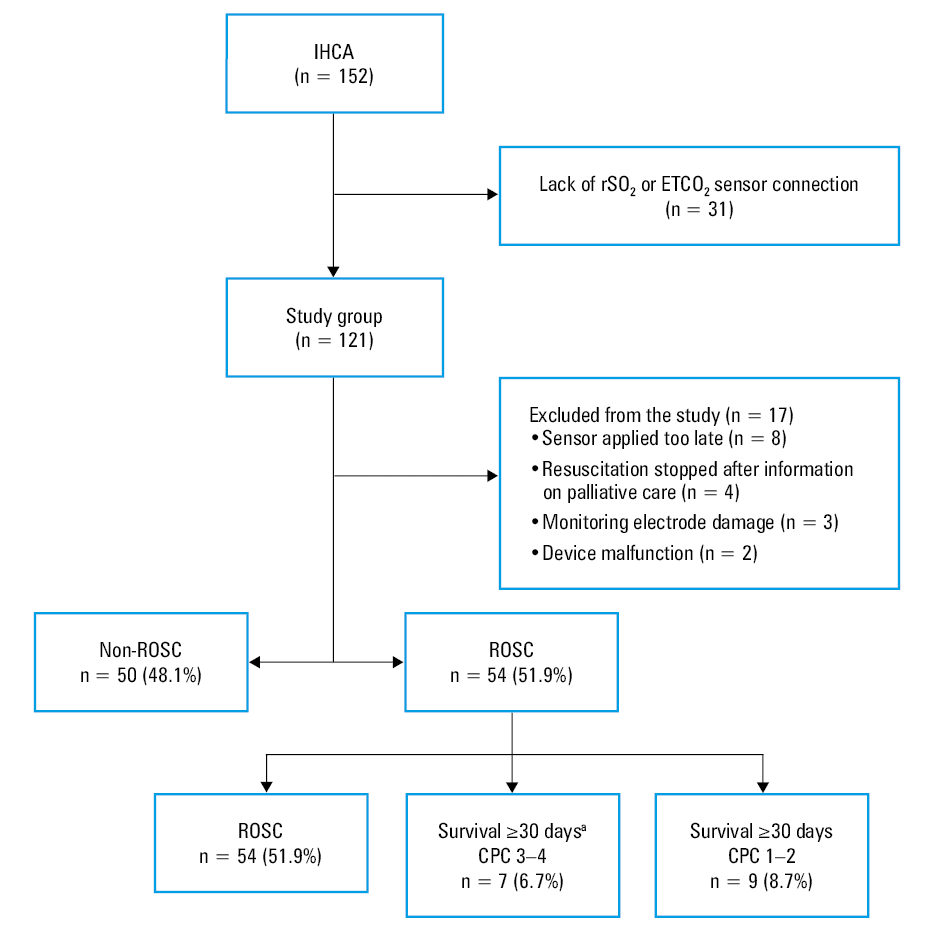
a Two patients who survived ≥ 30 days but died before discharge from the hospital were included in the group.
Abbreviations: CPC, cerebral performance category; ETCO2, end‑tidal carbon dioxide; IHCA, in‑hospital cardiac arrest; ROSC, return of spontaneous circulation; rSO2, regional cerebral oxygen saturation
Variable | IHCA (n = 104) | ||
Non‑ROSC (n = 50) | ROSC (n = 54) | ||
Abbreviations: AACCI, age‑adjusted Charlson comorbidity index; IQR, interquartile range; Max, maximum value; Min, minimum value; others, see Figure 1 | |||
Sex, n (%) | Women | 16 (32) | 22 (41) |
Men | 34 (68) | 32(59) | |
Age | Median (IQR) | 69 (62–75) | 70 (63–75) |
Min | 40 | 28 | |
Max | 87 | 83 | |
<65 years, n (%) | 17 (34) | 15 (28) | |
≥65 years, n (%) | 33 (66) | 39 (72) | |
AACCI | Median (IQR) | 4 (2–5) | 4 (2–4) |
Min | 0 | 0 | |
Max | 7 | 7 | |
Duration of resuscitation, min | Median (IQR) | 25 (21–30) | 15 (10–20) |
Min | 15 | 5 | |
Max | 40 | 31 | |
Duration of rSO2 monitoring, min | Median (IQR) | 21 (18–27) | 12 (7–17) |
Min | 11 | 4 | |
Max | 36 | 28 | |
The mean (SD) value of rSO2 during CPR for the patients with ROSC was 63.8% (7.4%), while for the patients without ROSC, it was 35.6% (5.6%). The ROSC group had higher parameter values than the non‑ROSC group (P <0.001; Figure 2). The mean (SD) value of ETCO2 was higher in the ROSC than in the non‑ROSC group (26 [4.9] mm Hg vs 17 [4.8] mm Hg; P <0.001).
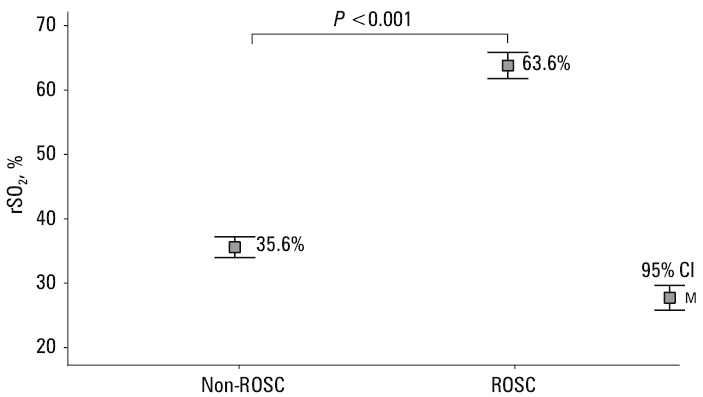
Abbreviations: M, mean; others, see Figure 1
In the non‑ROSC group, the mean rSO2 values remained low throughout the resuscitation period. The initial mean (SD) value (Ma) was 35.8% (7.4%), the intermediate value (Mb) was 35.7% (6%), and the final value (Mc) reached 34% (5.2%). No significant changes in the measured parameter were observed at the time points analyzed (Ma–Mb, P = 1; Ma–Mc, P = 0.13; and Mb–Mc, P = 0.054).
In the ROSC group, mean (SD) rSO2 values increased throughout the course of resuscitation. Ma of rSO2 was 60.9% (9.4%), with Mb increasing to 62% (8.5%), and Mc of 69.2% (5.9%) in the last 2 minutes. Statistical analysis showed an increase between the 2 time points (Mb–Mc, P <0.001; Ma–Mc, P <0.001; and Ma–Mb, P = 0.23). In the ROSC group, rSO2 increased during resuscitation, while in the non‑ROSC group, despite ongoing resuscitation efforts, no significant change in rSO2 values was observed. Differences between the ROSC and non‑ROSC groups were also demonstrated at the studied time points (P for interaction <0.001; Figure 3).

The mean values of rSO₂ during the first 2 minutes of monitoring during CPR and throughout the entire resuscitation process were higher in the group of patients with an initially recorded shockable rhythm than in those with a nonshockable rhythm (P = 0.04). These differences were not observed for the mean values of ETCO₂ during the first 2 minutes and throughout resuscitation (P = 0.13 and P = 0.14, respectively). Our study demonstrated that in shockable rhythms, the mean rSO2 throughout all CPR (P = 0.04) and from the initial 2 minutes of CPR (P = 0.04) was markedly higher. These differences were not demonstrated for ETCO2 (P = 0.13 and P = 0.14). A shockable rhythm at the time of the first assessment was recorded in 17 patients. Although rSO₂ was significantly higher during CPR in these patients, the initial rhythm was not significant in predicting ROSC in the logistic regression analysis (Supplementary material, Table S1).
Association with return of spontaneous circulation
For rSO2, an area under the curve (AUC) of 0.978 (95% CI, 0.956–0.999; P <0.001) indicates a very good predictive capacity of rSO2 associated with ROSC. The optimal cutoff point was determined to be 47.6% (sensitivity 94%, specificity 92%). For ETCO2, the AUC of 0.815 (95% CI, 0.737–0.897; P <0.001) indicates a good capacity of ETCO2 to predict ROSC. The optimal cutoff point was determined to be 19.9 mm Hg (sensitivity 81.5%, specificity 70%; Supplementary material, Figure S1). The difference between the AUCs for the ROC curve (rSO2-ETCO2) was 0.162 (95% CI, 0.079–0.246; P <0.001).
The dynamics of the increase in rSO2 during the 2‑minute loop was evaluated by ΔrSO2. It was shown that an increase in rSO2 by 4 percentage points during the CPR loop may indicate ROSC (sensitivity 80.4%, specificity 83.2%; AUC for rSO2, 0.875; 95% CI, 0.837–0.913; P <0.001). In the logistic regression analysis that considered factors such as age, sex, initial heart rhythm (shockable and nonshockable), AACCI, rSO2, and ETCO2 in the first 2 minutes of CPR to predict ROSC, it was found that patient age (P = 0.03) and early values of rSO2 in the first 2 minutes of resuscitation (P <0.001) were significant in predicting ROSC (R2 = 0.905), while sex, heart rhythm, AACCI, and ETCO2 did not show any significant relationship (Table 2).
Variable | B | OR | 95% CI | P value |
Nagelkerke R2 =0.905
a Sex: 1, female; 2, male
b Rythms: 1, nonshockable; 2, shockable
Abbreviations: B, coefficient of regression; OR, odds ratio; others, see Figure 1 | ||||
Age | 0.218 | 1.244 | 1.021–1.517 | 0.03 |
Sexa | –1.145 | 0.318 | 0.018–4.369 | 0.37 |
Rhythmsb | –1.835 | 0.16 | 0.005–4.467 | 0.27 |
ACCI | –1.149 | 0.317 | 0.08–1.306 | 0.06 |
rSO2 first 2 minutes of CPR | 0.46 | 1.584 | 1.221–2.045 | <0.001 |
ETCO2 first 2 minutes of CPR | 0.12 | 1.127 | 0.907–1.4 | 0.28 |
The mean values of rSO2 were evaluated throughout the CPR period. In the group of patients who achieved ROSC but did not survive 30 days (death <30 days), the mean (SD) value of rSO2 was 60.3% (5.9%). The group of patients who survived more than 30 days with CPC 3–4 (71.2% [2.7]) and the group of patients with 30‑day survival and CPC 1–2 (72.5%)3 showed a notable difference in comparison with the group of patients without 30‑day survival (P <0.001; Figure 4; Supplementary material, Table S2). ROC curve analysis showed that lower rSO2 values are associated with a higher risk of death (AUC, 0.992; 95% CI, 0.98–1). The end point of the analysis was survival for at least 30 days regardless of the CPC value. The cutoff point was determined to be at least 66% (sensitivity 92% and specificity 100%). If the mean rSO2 value during CPR was greater than 66%, all patients in the study group survived 30 days.
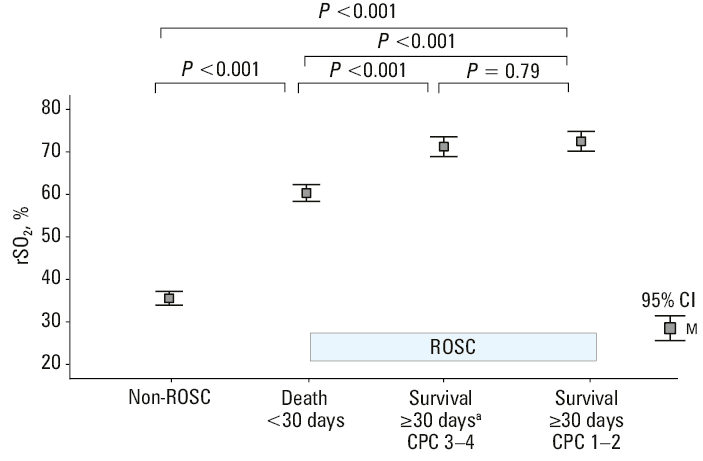
a Two patients who survived ≥30 days but died before discharge from the hospital were included in the group.
24‑hour monitoring
The measurements were obtained from 51 patients, of whom 13 were pronounced dead before 24 hours. In 3 patients, 24‑hour rSO2 measurement was impossible. The mean (SD) value of rSO2 in the group of patients who died before 30 days (n = 35) was 63.7% (6.1%) (95% CI, 61.7–65.8), while in those who survived at least 30 days with CPC 3–4 (n = 7) it reached 73.6% (6%) (95% CI, 65.9–81.1). The highest mean (SD) value of rSO2 of 77.2% (0.8%) (95% CI, 76.6–77.8) was recorded in the group of patients who survived at least 30 days with CPC 1–2. Statistical analysis showed that the difference between the CPC 3–4 group and the CPC 1–2 group was insignificant (P = 0.46), but there was a difference between patients who died within 30 days and those who survived with CPC 3–4 (P = 0.04), and those who survived with CPC 1–2 (P <0.001; Figure 5).

a Two patients who survived ≥30 days but died before discharge from the hospital were included in the group.
Discussion
Our study confirms that both higher ETCO2 and rSO2 values are associated with ROSC in patients with IHCA. However, rSO2 demonstrated greater predictability than ETCO2. Monitoring rSO2 during postresuscitation care may also be useful for long‑term neuroprognostication. Measurement of rSO2 using NIRS can serve as a tool for monitoring during CPR and prognostication. However, available studies on this topic vary significantly in many aspects, such as clinical conditions, monitoring devices, or time and type (mean, median, ΔrSO2, minimum or maximum) of readings considered. It should also be noted that the rSO2 value can be affected by various confounders, such as skin pigmentation, improper electrode placement, arterial occlusion, hemoglobin concentration, bleeding, and craniocerebral injuries.12,14,15 Considering the technical aspects, it should be noted that monitoring rSO2 using NIRS technology may be difficult to access in most European hospitals due to the cost of purchasing the device and disposable electrodes.
A study by Schewe et al15 showed that mean (SD) rSO2 values during resuscitation were lower in patients who did not achieve ROSC (31.6% [7.4%]) vs those who did (37.2% [7.7%]). In the ROSC patients (n = 3), an increase in these values was observed from 37.2% (7.7%) before ROSC to 52.3% (14.9%) at the time of ROSC, representing a relative increase of 40.6%. However, it should be noted that this was a study conducted with 10 patients and ROSC was achieved in 2 of them.15 In a meta‑analysis by Schnaubelt et al,16 mean (SD) values of rSO2 were shown to be higher in the patients who achieved ROSC than in the non‑ROSC group (41% [12%] vs 30% [12%]; P = 0.009). ROSC was not observed when the mean rSO2 remained below 26%.16 In a systematic review by Sanfilippo et al,17 the rSO2 values were on average by 1.03 SD higher in the ROSC group than in the non‑ROSC group (95% CI, 1.39–0.67; P <0.001). Our study confirmed these findings, but in a large group of patients and with resuscitation performed by a specialized team, which makes the outcomes more credible for the quality of the CPR performed.
Kämäräinen et al18 noted that rSO2 values remained low even during high‑quality CPR in a group of 9 patients. We confirmed that the rSO2 values remained low throughout the CPR period in the non‑ROSC group but increased in the ROSC group.
Takegawa et al19 examined the ability of rSO2 to predict ROSC during CPR. ROC curves were used to assess the predictive capacity of various rSO2 parameters. The analysis showed that the AUC for rSO2 was the highest at 16 minutes, with AUC values of 0.65, 0.68, 0.71, 0.72, and 0.7 for the 4, 8, 12, 16, and 20 minute periods, respectively. In our study, it was assumed that the prediction of successful resuscitation should be based on initial values, as the median (IQR) duration of CPR for ROSC patients was 15 (10–20) minutes. The mean value of the first 2 minutes (1 CPR cycle) was considered. The AUC of the ROC curve for rSO2 was 0.978, indicating a very good predictive ability. The optimal cutoff point was established at 47.6%, with sensitivity of 94% and specificity of 92%. If we think about predicting ROSC during CPR, we want to determine its chances right from the beginning. Therefore, only the factors that can be assessed during the first CPR cycle, such as age, sex, comorbidities, and the first recorded rhythm, should be considered. In the context of our study, the mean rSO2 value of the initial period was also such a factor. Studies show that an initial shockable rhythm is associated with a higher likelihood of ROSC.2 However, in our work, this was not a significant factor, likely due to the small patient group, as shockable rhythms account for only about 10% of IHCA cases.2,6
In the meta‑analysis by Schnaubelt et al,16 ΔrSO2 was evaluated as a ROSC indicator. A 7% change in ΔrSO2 predicted ROSC with 100% sensitivity and 86% specificity. In our study, the optimal cutoff point was established at ΔrSO2 equal to or above 4 percentage points (sensitivity 80.4%, specificity 83.2%). However, as mentioned earlier, rSO2 values are significantly higher throughout the resuscitation period in the ROSC patients. An increase of 4 percentage points is relatively small from a clinical perspective. More research is needed to determine the specific value of rSO2 above which it can be assumed that ROSC has occurred during a given CPR cycle, similar to ETCO2, where a sudden increase to near normal values, that is, 35–45 mm Hg, may indicate ROSC.
Engel et al20 demonstrated that predictive factors for ROSC included: a trend of the last 5 minutes of rSO2 and ETCO2, the Δ from the first to the last reading of rSO2 and ETCO2, the penultimate minute values of rSO2 and ETCO2, and the last‑minute values of rSO2 and ETCO2. The rSO2 measurement was more effective than that of ETCO2 for predicting ROSC. Our study also demonstrated that rSO2 was a better predictor of ROSC than ETCO2. Storm et al21 found significantly higher rSO2 values on hospital admission in patients who experienced out‑of‑hospital CA with CPC 1–2, with mean rSO2 of 56% and 68%, as compared with rSO2 values in patients with CPC 3–4, which were 20% and 58%, respectively. However, other works did not show any difference in rSO2 between the patients with CPC 1–2 (62%) and CPC 3–5 (58%).16 Our study also did not find any differences between the group of patients who survived at least 30 days with CPC 3–4 and those who survived at least 30 days with CPC 1–2 (P = 0.46). Chen et al22 developed a model to predict the risk of in‑hospital death in post‑CA patients, which included 11 independent predictors: age, malignancy, bicarbonate level, blood urea nitrogen, sodium level, heart rate, respiratory rate, body temperature, SpO₂, norepinephrine use, and lactate level. The nomogram demonstrated good discriminative ability in both the training set (AUC, 0.787; 95% CI, 0.753–0.821) and the test set (AUC, 0.801; 95% CI, 0.778–0.824). Studies evaluating the predictive value of rSO2 in postresuscitation care within such models are needed.
NIRS technology in postresuscitation monitoring may become an additional element in neuroprognostication within a multimodal approach, encompassing examinations such as electroencephalography (EEG), N20 wave of somatosensory evoked potentials, neuron‑specific enolase (NSE), computed tomography (CT), magnetic resonance imaging (MRI), and clinical assessments, including pupillary and corneal reflexes.23 However, more research is needed to determine the role of rSO2 monitoring in postresuscitation care in the context of neuroprognostication.
Limitations
The study assumed that the RRT performed CPR with proper chest compressions and ventilation. Periodically, brief unrecorded interruptions in the chest compressions or ventilation due to intubation or other lifesaving procedures during ALS may have occurred. In most cases, it was not possible to obtain information on the actual cause of CA, which may also have implications for achieving ROSC and further prognosis. NIRS mainly concerns the superficial layers of the brain, and to compare studies with other authors, it is important to specify the type of device, as different models may have different results. Differences in age, general health, and the presence of comorbidities, which affect long‑term survival, should also be considered. Our study did not account for the administration of periresuscitation medications, which may affect the rSO2 values. The rSO2 results were not analyzed in the context of decision‑making during CPR, including decisions to terminate resuscitation efforts or qualification for ECPR. The study did not analyze postresuscitation care strategies and did not compare rSO₂ measurement with a multimodal approach to prognostication (EEG, NSE, CT, MRI, clinical examination).
Conclusions
The rSO2 value is a more sensitive indicator of ROSC than ETCO2. Higher rSO2 values are associated with a higher probability of achieving ROSC. The monitoring of rSO2 during CPR provides prognostic information.
- Andersen LW, Holmberg MJ, Berg KM, et al. In‑hospital cardiac arrest: a review. JAMA. 2019; 321: 1200‑1210. | Crossref
- Gräsner JT, Herlitz J, Tjelmeland IBM, et al. European Resuscitation Council Guidelines 2021: epidemiology of cardiac arrest in Europe. Resuscitation. 2021; 161: 61‑79. | Crossref
- Merchant RM, Yang L, Becker LB, et al. Incidence of treated cardiac arrest in hospitalized patients in the United States. Crit Care Med. 2011; 39: 1‑6. | Crossref
- Winters BD, Weaver SJ, Pfoh ER, et al. Rapid‑response systems as a patient safety strategy: a systematic review. Ann Intern Med. 2013; 158: 17‑25. | Crossref
- Subbe CP, Bannard‑Smith J, Bunch J, et al. Quality metrics for the evaluation of rapid response systems: proceedings from the third international consensus conference on rapid response systems. Resuscitation. 2019; 141: 1‑12. | Crossref
SUPPLEMENTARY MATERIAL
ARTICLE INFORMATION