Comparison of models predicting efficacy of radioiodine therapy in patients with differentiated thyroid cancer
1 ,
Key words: differentiated thyroid cancer, nomograms, prediction, radioiodine therapy, thyroglobulin
,
Key words: differentiated thyroid cancer, nomograms, prediction, radioiodine therapy, thyroglobulin

 CC BY 4.0
Comparison of models predicting efficacy of radioiodine therapy in patients with differentiated thyroid cancer
Introduction: Differentiated thyroid cancer (DTC) is the most common endocrine malignancy, with incidence rising in recent decades. Despite a favorable prognosis, management remains complex, often involving thyroidectomy followed by radioactive iodine (RAI) therapy, with varying efficacy.
Objectives: We aimed to assess predictive models for RAI therapy efficacy in patients with DTC and to identify thyroid biomarker cutoff values.
Patients and methods: This retrospective study included 744 patients with DTC who underwent thyroidectomy and RAI remnant ablation at a single center. Clinicopathological factors and thyroid biomarkers were evaluated and multivariable logistic regression models were developed, adjusting for age, sex, and disease stage. Cutoff values were established to predict RAI efficacy. Treatment‑free survival was analyzed using the Kaplan–Meier curves.
Results: Overall, the models showed no significant difference in predictive performance. Stimulated thyroglobulin (sTg) emerged as a reliable predictor of RAI efficacy, with a mean cutoff value of 7.22 ng/ml. The Kaplan–Meier analysis confirmed the prognostic value of sTg for treatment‑free survival. Chronic lymphocytic thyroiditis (CLT) status tended to improve predictive accuracy, although this was not significant.
Conclusions: sTg alone represents a practical biomarker for predicting RAI therapy efficacy in DTC, with a defined cutoff value to guide clinical decisions. Further research may clarify the role of CLT status. There is a need to advance personalized management approaches in patients with DTC undergoing RAI therapy.
What's new?
This study makes an important step in predicting the efficacy of radioiodine therapy for patients with differentiated thyroid cancer by comparing multiple clinical models and identifying stimulated thyroglobulin as a reliable single predictor. A newly identified cutoff value of 7.22 ng/ml for stimulated thyroglobulin offers a practical tool for guiding treatment decisions and improving patient outcomes. Moreover, the study highlights the possible role of chronic lymphocytic thyroiditis in refining these predictive models, suggesting a path for further research. These insights could transform clinical approaches to differentiated thyroid cancer, optimizing long‑term outcomes and reducing unnecessary interventions. Future studies should focus on external validation of these models and the inclusion of chronic lymphocytic thyroiditis to further refine predictive accuracy and improve patient care.
Introduction
Differentiated thyroid cancer (DTC) stands as the predominant form of endocrine malignancy, accounting for approximately 90% of all thyroid neoplasms.1 Its incidence has risen over the past 3 decades,2 primarily due to the widespread use of ultrasound screening for thyroid abnormalities.3,4 Encouragingly, DTC has an excellent mean 10‑year survival rate of 90%.5 Standard management protocols typically involve total or near‑total thyroidectomy, optionally followed by radioactive iodine (RAI) remnant ablation based on tumor stage and risk of recurrence.6
Although DTC generally has a favorable prognosis, it often demonstrates a tendency for persistence or recurrence. This underscores the need for long‑term surveillance, especially in higher‑risk patients.7 A key factor in effective management is RAI therapy,8 whose efficacy plays a critical role in determining patient outcomes.9 Indeed, an inadequate response to RAI therapy correlates with a markedly poorer prognosis.10,11
Recent guidelines emphasize the importance of identifying patients who respond well to initial treatment.3,12 This approach helps create personalized follow‑up plans, which can ease the emotional and financial strains of long‑term monitoring.13,14 While the American Thyroid Association (ATA) guidelines predominantly rely on tumor, node, metastasis (TNM) staging and thyroglobulin (Tg) levels to guide decisions on RAI remnant ablation,3 the integration of predictive models has shown promise for refining prognostic accuracy.
Clinicopathological prediction models represent a notable advancement in improving the ability to forecast efficacy and long‑term prognosis of RAI therapy by integrating a range of patient‑specific characteristics.15 Incorporating these models into clinical practice facilitates a personalized medical approach, ensuring treatments are tailored to individual patient needs.16 However, to the best of our knowledge, no study has yet compared the efficacy of different DTC prediction models or established biomarker cutoff values to guide clinical decisions.
In this study, we aimed to evaluate the performance of various predictive models in determining the efficacy of RAI therapy, defined as no need for a second RAI therapy 12 months after the initial treatment and treatment‑free survival. The study population comprised a homogeneous cohort of patients diagnosed with DTC who underwent thyroidectomy and RAI remnant ablation. The second aim was to determine cutoff values for thyroid biomarkers to aid in this prediction.
Patients and methods
Patient characteristics
We conducted a retrospective analysis of 744 patients diagnosed with DTC at a single endocrinology center in Poznań, following the fifth edition of the Classification of Endocrine and Neuroendocrine Tumors issued by the World Health Organization.17 The cohort comprised 656 white women and 88 white men, with a median age at diagnosis of 50 years (range, 16–99 years). The inclusion criteria comprised a diagnosis of DTC and past thyroidectomy, while the exclusion criterion was a lack of histopathologic confirmation of DTC. The date of diagnosis was defined as the date of thyroidectomy. Data analysis covered information collected between 1998 and 2014, with follow‑up updates extending through September 2024. The follow‑up care was conducted through regular check‑ups at the center.
The study was carried out in accordance with the Declaration of Helsinki as revised in 2013.18 As an observational study, it was exempted from ethical approval by the Institutional Review Board, the Bioethical Committee of Poznan University of Medical Sciences, in May 2024 (exemption document No. 317/24).
Histopathologic, laboratory, and clinical data
Histopathologic diagnoses were confirmed through a thorough examination of tissue samples obtained during thyroidectomy at the time of diagnosis. Chronic lymphocytic thyroiditis (CLT) was identified by the presence of lymphocyte infiltration, oxyphilic cell proliferation, and the formation of primary and secondary lymphoid follicles, consistent with Hashimoto thyroiditis or the expansion of individual lymphoid follicles.19 Tumor multifocality was defined when 2 or more distinct areas were identified, with tumor size determined by the largest focus in multifocal cases. Staging adhered to the American Joint Committee on Cancer TNM staging system (8th edition).12
Correlative analyses were performed by integrating histopathologic data from thyroidectomy specimens with available clinical and biochemical parameters, including age at diagnosis, sex, tumor characteristics, multifocality, extrathyroidal extension, the presence of CLT, histopathologic staging (pathological TNM), concentrations of stimulated thyroglobulin (sTg), antithyroglobulin antibodies (aTg), stimulated thyrotropin (sTSH) levels, and the change in sTg concentration between the initial assessment for RAI therapy and 1 year post‑RAI administration (referred to as ∆sTg). All patient data were anonymized to ensure confidentiality and privacy.
All patients underwent evaluation and were deemed suitable for complementary RAI ablation following thyroidectomy, with the decision made during a multidisciplinary board meeting. Both sTg and aTg concentrations were evaluated on the day of RAI therapy.
The concentration of sTg was determined using an immunoradiometric assay with Brahms diagnostic kits (ThermoFisher Scientific, Waltham, Massachusetts, United States), and was deemed reliable for TSH stimulation when concentrations exceeded 30 μIU/ml (assessed by the electrochemiluminescence method using Roche diagnostic kits and the COBAS e601 analyzer from Hitachi (Roche Diagnostics, Basel, Switzerland).
The patients were evaluated for the efficacy of their initial RAI therapy. Long‑term remission (excellent response) was defined as an absence of biochemical or morphological evidence of disease persistence or recurrence after the initial management, and no need for a second therapy (reoperation or adjuvant RAI) at a follow‑up visit 12 months after the first RAI treatment.20 This evaluation included measuring sTg levels and performing imaging studies (ultrasound, computed tomography, and radioisotope scan) after RAI remnant ablation. Undetectable sTg, normal thyroid and cervical lymph nodes on ultrasound, and a normal radioisotope scan (0.18 GBq of 131I) all indicated a long‑term remission or excellent response.20 RAI response was assessed according to the ATA criteria.3 The patients with both incomplete and indeterminate responses to treatment, as assessed by the ATA criteria, were eligible for repeat RAI therapy.
Biomarkers for differentiated thyroid cancer
The selection of candidate DTC biomarkers (Table 1) was based on their documented prognostic significance. We first defined a list of biomarkers previously associated with DTC outcomes by searching for the following Medical Subject Headings terms and key words: marker OR prognosis AND thyroid cancer OR radioiodine. Reference lists of all the selected articles, meta‑analyses, and reviews were hand‑searched for any additional publications. We included studies—regardless of their sample size—that investigated the relationship between laboratory parameters and DTC prognosis. We carried out a systematic review according to the Cochrane Handbook for Systematic Reviews of Interventions21 and the Preferred Reporting Items for Systematic Reviews and Meta‑Analyses (PRISMA) guidelines.22 We searched PubMed, MEDLINE, Academic Search Complete, CINAHL Complete, CINAHL, Scopus, Cochrane, Health Source: Nursing / Academic Edition, Web of Knowledge, MasterFILE Premier, Health Source‑Consumer Edition, Agricola, Dentistry, and Oral Science Source from January 2000 up to December 2023 to find all relevant, full‑text journal articles written in English.
Biomarker | References |
Abbreviations: aTg1, antithyroglobulin antibodies at the initial assessment for radioiodine therapy; aTg2, antithyroglobulin antibodies 1 year post–radioiodine administration; sTg1, stimulated thyroglobulin at the initial assessment for radioiodine therapy; sTg2, stimulated thyroglobulin 1 year post–radioiodine administration; sTSH1, stimulated thyrotropin at the initial assessment for radioiodine therapy; sTSH2, stimulated thyrotropin 1 year post–radioiodine administration | |
sTg1 | 3,6,16,20,25,27,28,32,33,35,36,41,45,48 |
sTg1 × aTg1 | 16,34,35,43,45-47 |
26,28,29,39,41,42,44,45 | |
Exploratory, based on34,39,41-47 | |
sTg2‑sTg1 | 3,20,27,32,33,37,38,41 |
37 | |
43 | |
Exploratory, based on3,16,20,26-29,32-35,37-39,41-47 | |
sTg1+sTg1 × aTg1 | Exploratory, based on16,34,43,45-47 |
Exploratory, based on16,26,28,29,34,35,39,41-47 | |
Two authors (MB, EJS) independently selected the publications that met the inclusion criteria specified above and extracted outcome data using a standardized data collection form. Abstracts and studies focusing on medullary thyroid cancer were excluded. A final set of DTC biomarkers was identified, and an additional list of exploratory biomarkers was generated based on the existing literature.
Statistical analysis
We used mean (SD) as descriptive statistics for continuous covariates, the distribution of which did not significantly deviate from normal distribution, as checked with the Shapiro–Wilk test, or counts and proportions for categorical variables. Differences in each covariate between the patients requiring the second course of radioiodine therapy and those who achieved an excellent response after the first course were described using standardized mean differences (SMDs) and compared using the t test for approximately normally distributed quantitative variables or the χ2 test for categorical variables.
We performed multiple imputation with chained equations using the mice R package to account for missing data, generating 10 imputations.23 Bootstraping was used to calculate 95% CIs for the area under the receiver operating characteristic (ROC) curve (AUC), while 10‑fold cross‑validation ensured reliable AUC estimates within each bootstrap sample.
To examine the association between thyroid biomarkers and the need for a second course of RAI therapy at the 12‑month follow‑up, we first assessed each biomarker individually (listed in Table 1). We applied the Youden index to select an optimal cutoff for each marker and evaluated its predictive performance in each imputed dataset. We used AUC to measure model accuracy, with predictive performance further validated via 10‑fold cross‑validation.
As a second step, we developed multivariable logistic regression models using the quantitative biomarkers from Table 1 as predictors, adjusting for known covariates associated with RAI therapy response.16,20,24-44 These covariates included sex, age at diagnosis, disease stage (treated as a binary variable, I vs II–IV), and the presence of lymph node and / or distant metastases.
To evaluate whether the predictive performance of these biomarker‑based models differed between patients with and without CLT, we additionally calculated the AUC for each model separately in those 2 groups. Additionally, we computed 95% CIs for difference in AUC between the patients with and without thyroid inflammation.
Finally, we constructed the Kaplan–Meier curves to analyze treatment‑free survival, which served as the clinical equivalent to progression‑free survival in our dataset. Treatment‑free survival was defined as the time from initial surgery and RAI therapy until the first subsequent treatment for thyroid cancer. The patients requiring no further treatment were censored at the last recorded visit.
We assessed the impact of the same predictors on treatment‑free survival as on the need for the second radioiodine dose at 12 months after the initial treatment: tumor size, sex, staging, lymph node / distant metastatic status, and sTg level, which was included both as a continuous predictor and a binary variable based on the previously identified cutoff value. Subsequently, a Cox proportional hazards model was developed with sTg as a continuous predictor, alongside tumor size, sex, disease stage, and lymph node / distant metastatic status. These results informed the Kaplan–Meier analysis depicting treatment‑free survival across different sTg levels, adjusted for potential confounding factors.
All analyses were conducted using R version 4.3.1 (R Foundation for Statistical Comuting, Vienna, Austria). A P value of 0.05 or less was considered significant.
Results
Out of 744 patients with DTC, data on the need for a second dose of RAI at the 12‑month follow‑up visit were available for 656 individuals. Of these, 556 patients (84.8%) were diagnosed with papillary thyroid cancer. The study compared patients who required a second course of radioiodine therapy at 12‑month follow‑up after the initial radioiodine treatment (n = 285) with those who achieved an excellent response after the first course (n = 371). Out of the whole cohort, 88 patients (11.8%) were lost to follow‑up: 35 (39.8%) due to an absence at scheduled follow‑up visits, 6 (6.8%) due to incomplete Tg level measurements, and 47 (53.4%) due to insufficient information regarding subsequent RAI treatment. These patients did not differ from those who were followed in terms of age, sex, thyroid cancer histopathologic type, and disease staging. Of the patients ultimately included in our study, 9 underwent exogenous TSH stimulation, while 647 had endogenous stimulation. Of the 285 patients requiring repeat RAI, 212 achieved an excellent response after the second treatment, 37 required a third RAI, 6 required a fourth, and 30 required 5 or more RAI treatments. Among these, 5 patients required tyrosine kinase inhibitor treatment with sorafenib.
The analysis of several clinical and pathological features is summarized in Table 2. SMDs were calculated to determine associations with the need for a second therapy. There were no significant differences in age or histologic tumor type among the patients who achieved an excellent response after the first RAI course. Those requiring a second course were more frequently male (17.5% vs 7.8%; SMD, 0.3; P <0.001). The proportion of patients with papillary thyroid cancer was similar in both groups (SMD, 0.061), with a slightly higher rate of the conventional variant of the tumor among those needing the second course (65% vs 59.1%), though this association was neither strong nor significant (SMD, 0.124).
Parameter | Second course of radioiodine therapy | Missing values | SMD | P valuea | ||
No (n = 371) | Yes (n = 285) | |||||
Data are presented as number (percentage) unless indicated otherwise.
a χ2 test unless specified otherwise
b Two‑tailed t test
Abbreviations: CLT, chronic lymphocytic thyroiditis; SMD, standardized mean difference | ||||||
Sex | Women | 342 (92.2) | 235 (82.5) | 0 | 0.295 | <0.001 |
Men | 29 (7.8) | 50 (17.5) | ||||
Age at diagnosis, y, mean (SD) | 48.1 (13.9) | 48.67 (14.02) | 0 | 0.04 | 0.61b | |
Histologic type | Papillary | 318 (85.7) | 238 (83.5) | 0 | 0.061 | 0.5 |
Other | 53 (14.3) | 47 (16.5) | ||||
Histological variant of papillary thyroid cancer | Conventional | 136 (59.1) | 102 (65) | 169 (30.4) | 0.124 | 0.49 |
Follicular | 72 (31.3) | 41 (26.1) | ||||
Oxyphilic | 22 (9.6) | 14 (8.9) | ||||
Size >10 mm | No | 204 (57) | 132 (50) | 34 (5.2) | 0.14 | 0.1 |
Yes | 154 (43) | 132 (50) | ||||
Multifocality | No | 250 (70.4) | 159 (59.1) | 32 (4.9) | 0.239 | 0.004 |
Yes | 105 (29.6) | 110 (40.9) | ||||
Capsular infiltration | No | 146 (71.2) | 87 (61.7) | 310 (47.3) | 0.203 | 0.082 |
Yes | 59 (28.8) | 54 (38.3) | ||||
Stage | 0 | 188 (52.5) | 107 (40.2) | 32 (4.9) | 0.362 | <0.001 |
I | 77 (21.5) | 65 (24.4) | ||||
II | 37 (10.3) | 25 (9.4) | ||||
III | 48 (13.4) | 45 (16.9) | ||||
IV | 8 (2.2) | 24 (9) | ||||
CLT | No | 162 (52.6) | 137 (59.3) | 117 (17.8) | 0.135 | 0.14 |
Yes | 146 (47.4) | 94 (40.7) | ||||
Type of CLT | No inflammation | 162 (52.6) | 137 (59.3) | 117 (17.8) | 0.154 | 0.54 |
Hashimoto | 88 (28.6) | 52 (22.5) | ||||
Focal inflammation | 16 (5.2) | 11 (4.8) | ||||
Lyphonoduloplasia | 34 (11) | 26 (11.3) | ||||
Focal inflammation with lymphonoduloplasia | 8 (2.6) | 5 (2.2) | ||||
Distant metastases | No | 158 (91.9) | 107 (79.3) | 349 (53.2) | 0.364 | 0.003 |
Yes | 14 (8.1) | 28 (20.7) | ||||
Lymph node metastases | No | 334 (93.8) | 219 (79.6) | 25 (3.8) | 0.428 | <0.001 |
Yes | 22 (6.2) | 56 (20.4) | ||||
In the group receiving the second RAI dose, more patients had tumors larger than 10 mm (50% vs 43%; SMD, 0.14), multifocal lesions (40.9% vs 29.6%; SMD, 0.24; P = 0.004), capsular infiltration (38.3% vs 28.8%; SMD, 0.203), and advanced disease stages (SMD, 0.362; P <0.001), especially stage IV (9% vs 2.2%). Only the features with P values provided were significant. The mean RAI dose administered during the first RAI treatment was 85.43 mCi (3160.91 MBq), ranging from 30 to 150 mCi (1110–5550 MBq). There was no difference in mean RAI activity between the patients who required the second dose (82.83 mCi [3064.71 MBq]) and those who did not (85.11 mCi [3149.07 MBq]; P = 0.39).
A total of 240 patients had both DTC and CLT. Those who required the second RAI dose at 12 months were less likely to have CLT, as compared with those who did not (40.7% vs 47.4%; SMD, 0.14). The patients treated with the second RAI dose more frequently had distant metastases (20.7% vs 8.1%; SMD, 0.36; P = 0.003) and lymph node involvement (20.4% vs 6.2%; SMD, 0.43; P <0.001).
Overall, the patients who required the second course of radioiodine therapy at 12 months were more often male and exhibited multifocal disease, advanced stage, distant metastases, lymph node involvement, and specific histologic features.
Multivariable models
The performance of various biomarker‑based models for predicting outcomes in patients with DTC, as indicated by AUC for each model, is presented in Table 3.
Model description: Sex + age at diagnosis + stage (II‑IV vs I) + metastases (lymph nodes and/or distant) + | AUC (95% CI) |
Abbreviations: AUC, area under the curve; others, see Table 1 | |
sTg1 | 0.671 (0.609–0.734) |
sTg1 × aTg1 | 0.665 (0.602–0.728) |
0.654 (0.59–0.718) | |
0.651 (0.586–0.717) | |
sTg2‑sTg1 | 0.637 (0.571–0.703) |
0.632 (0.568–0.696) | |
0.631 (0.566–0.696) | |
0.631 (0.566–0.695) | |
sTg1+sTg1 × aTg1 | 0.666 (0.602–0.729) |
0.652 (0.586–0.718) | |
Model 1, which included the sTg level at the initial assessment (sTg1), achieved the highest predictive power (AUC, 0.671; 95% CI, 0.609–0.734). Model 8, incorporating the product of (1 + aTg at initial assessment [aTg1]) and sTg1, yielded a similarly strong AUC of 0.666 (95% CI, 0.602–0.729). In contrast, Model 2 (sTg1 adjusted for aTg1), and Model 9 (the ratio of [1 + aTg1] × sTg1 over sTSH1), showed lower AUCs of 0.654 (95% CI, 0.59–0.718) and 0.652 (95% CI, 0.586–0.718), respectively. Models incorporating changes in Tg levels or ratios over time (Models 5–8) showed the lowest predictive power, with AUCs ranging from 0.631 to 0.637.
Overall, the models including sTg1 and aTg1 provided better predictive accuracy than those based on temporal changes in Tg levels. Subgroup analysis revealed that the patients without inflammation tended to have higher AUC values, but the difference was not significant in any model.
Cutoff values
Wherever possible, we determined cutoff values for various DTC biomarkers to predict RAI efficacy (Table 4 and Figure 1). sTg1 had the highest accuracy (0.628) with a mean cutoff value of 7.22 ng/ml. aTg1 showed a slightly lower accuracy (0.613) with a cutoff value of 138.22 IU/ml. The model incorporating the sTg1/sTSH1 ratio demonstrated an accuracy of 0.613 with a cutoff of 0.13 mg/IU. sTg1 × aTg1/sTSH1 or sTg1/sTSH1 had an accuracy of 0.617 with a cutoff of 3.88 mg/ml. The model evaluating changes in sTg over time (sTg2 − sTg1) had the lowest accuracy (0.587) with a cutoff of 0.53 ng/ml. Two additional models that integrated time‑based changes in sTg, sTSH, and aTg were not applicable for accuracy and cutoff determination.
Biomarker | Accuracy | Cutoff |
Abbreviations: NA, not applicable; others, see Table 1 | ||
sTg1 | 0.628 | 7.22 |
sTg1 × aTg1 | 0.613 | 138.22 |
0.613 | 0.13 | |
0.617 | 3.88 | |
sTg2‑sTg1 | 0.587 | 0.531 |
NA | NA | |
NA | NA | |
NA | NA | |
sTg1+sTg1 × aTg1 | 0.617 | 148.48 |
0.613 | 3.98 | |
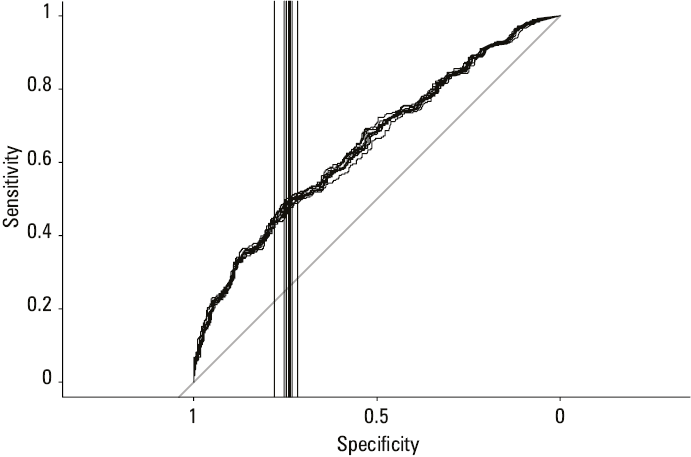
In summary, sTg1 alone or in combination with aTg1 and sTSH1 provided the most accurate cutoff points for predicting DTC outcomes, with sTg1 alone emerging as the most reliable single predictor.
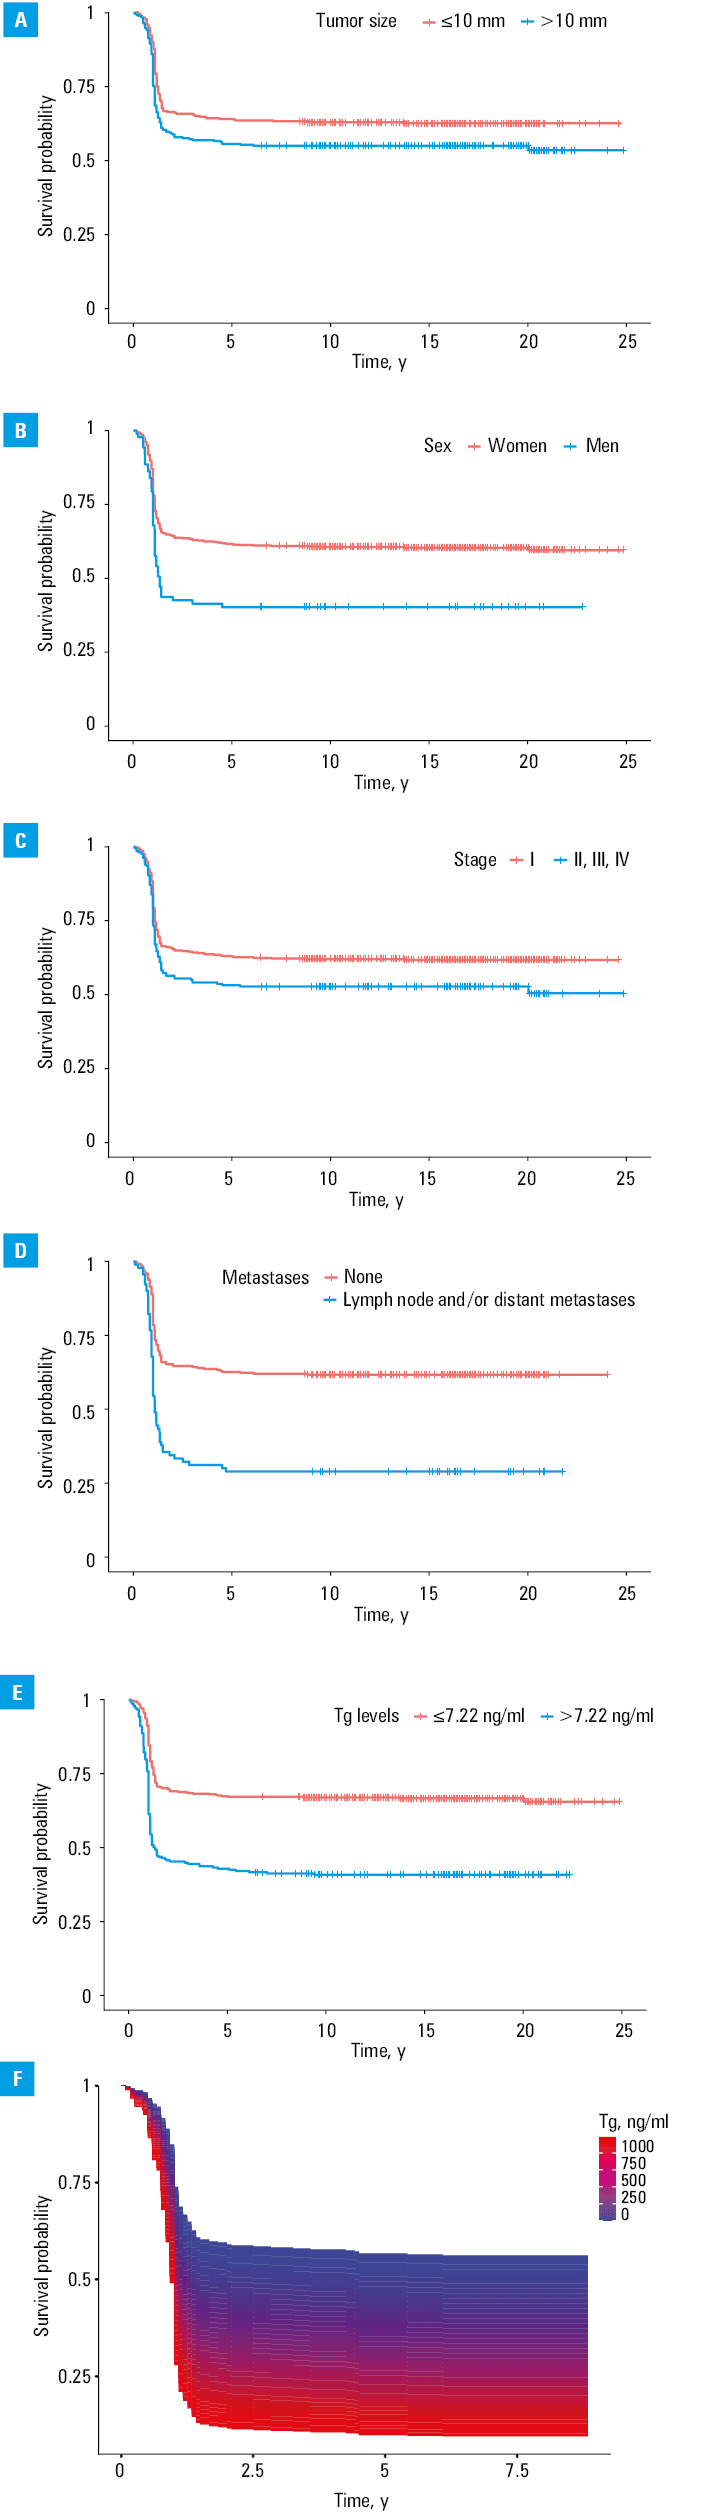
Kaplan–Meier curves
Finally, the Kaplan–Meier curves were used to assess treatment‑free survival. In our dataset, a tumor smaller than 10 mm, female sex, stage I disease, absence of distant and lymph node metastases, and a Tg concentration below 7.22 ng/ml were associated with improved treatment‑free survival (Figure 2). For Tg concentrations above or below the cutoff of 7.22 ng/ml, the Kaplan–Meier curves diverged at the onset of follow‑up, and the difference between them remained significant at all subsequent time points when (beyond 8 months after initial treatment), as evidenced by nonoverlapping 95% CIs.
Discussion
In the present study, the assessed biomarkers did not significantly differ in their predictive value for the efficacy of RAI therapy in patients with DTC. Therefore, sTg alone serves as a reliable predictor of treatment outcomes. While including CLT status in the analysis appeared to improve specificity and sensitivity of the models predicting RAI efficacy, this trend did not reach significance. We demonstrated distinct cutoff values for various DTC biomarkers to identify patients at a higher risk of suboptimal response to RAI therapy.
The analyzed models of DTC biomarkers included sTg, aTg and / or sTSH in various combinations. All models incorporated Tg, a glycoprotein released by the thyroid follicular cells that generally reflects the amount of thyroid tissue.43,45 Measurement of Tg concentration is the cornerstone of modern management of DTC, guiding both treatment decisions and follow‑up protocols.45 Its clinical relevance was first reported in 1985.33 sTg, whether initial or preablative, is a key marker for detecting residual disease following surgery. It can also signal the presence of occult distant metastases, even in the cases where morphological imaging yields no abnormal findings.20
Depending on the studied population and the assay used, up to 25% of patients with DTC have detectable aTg at the time of initial diagnosis.46 The presence of aTg remains a challenge in the follow‑up care of patients with DTC due to its potential interference.47 An updated clinical and laboratory expert consensus strongly recommends routine testing for aTg alongside highly‑sensitive Tg measurements.45 The sTg × aTg product has been shown to predict the efficacy and prognosis of RAI therapy in both aTg‑negative and aTg‑positive patients before their initial 131I treatment following thyroidectomy.34 Therefore, this parameter can serve as a valuable clinical marker for monitoring patients with DTC.34
Due to the potential stimulation of Tg production by TSH, sTg concentrations in patients undergoing pre‑RAI therapy may be influenced by their sTSH levels.28 This has led to extensive research on the relationship between the sTg/sTSH ratio and the outcomes of initial RAI therapy.26,29,44 A study by Ju et al28 compared the predictive capabilities of sTg alone vs sTg/sTSH ratio for RAI ablation therapy outcomes. According to their findings, while both sTg concentrations and the sTg/sTSH ratio are valid predictors of the initial 131I therapy success, the model based solely on sTg demonstrated superior performance, as compared with the model incorporating the sTg/sTSH ratio.28
Another predictive model incorporated the Tg reduction index, calculated as the difference between sTg concentrations after the first and after the second course of RAI therapy (sTg2 – sTg1). This index reflects the response to RAI therapy and the extent of tissue damage.20 Response to RAI may be reflected by maximal sTg reduction, ideally to achieve undetectable values.20 Additionally, Tg reduction index may provide insight into tumor differentiation and its ability to incorporate RAI,3 and could serve as a supplemental tool for predicting the efficacy of RAI therapy.20
Although Tg has been widely recognized as a key parameter in predicting the efficacy of RAI therapy, its reliability as a standalone parameter predictor has been questioned due to the potential for analytical interference. However, our findings show that sTg alone can serve as a reliable predictor for the outcomes of the initial 131I ablative therapy. These results confirm and build upon the conclusions of Ju et al,28 who compared predictive models incorporating sTg and the sTg/sTSH ratio. The study showed that both sTg and the sTg/sTSH ratio could be considered as predictors of RAI efficacy, although the model based solely on sTg performed even better than the one including the sTg/sTSH ratio.28
The cutoff values for sTg concentration in predicting persistent disease have varied widely in previous studies, ranging from 0.27 to 30 ng/ml. A meta‑analysis by Webb et al,48 which included 15 studies and 3900 patients, identified a cutoff of 10 ng/ml, demonstrating a strong negative predictive value. Another study proposed a cutoff of 13 ng/ml as predictive of disease recurrence.20 However, many studies had relatively small sample sizes, ranging from 63 to 450 patients.20
One of the largest studies, involving 1642 patients with DTC, reported an excellent response to the first RAI course in 855 patients. In this cohort, the cutoff for sTg concentration was 3.4 ng/ml (AUC, 0.789), while the cutoff for the sTg/sTSH ratio was 36.03 ng/mIU (AUC, 0.788).28 Another study proposed a cutoff for the sTg/sTSH ratio of 1.5.30
Our previous study36 validated the predictive capability of sTg for detecting incomplete response to radioiodine therapy through ROC curve analysis, with the suggested optimal cutoff value of 8.17 ng/ml (sensitivity, 55%; specificity, 77%; positive predictive value, 42.1%; negative predictive value, 84.7%). An sTg level exceeding 8.17 ng/ml was associated with a 2.5‑fold increased risk of incomplete therapy response (P = 0.01).
In the current study, conducted in a larger and more homogenous cohort of 744 patients with DTC, the optimal sTg cutoff value was slightly lower at 7.22 ng/ml.
The relationship between CLT and DTC has been widely investigated.49 In our comparison of predictive models using various DTC biomarkers, we included subgroups of patients with and without CLT. The patients without CLT showed a trend toward higher AUC values across all models, although this difference did not reach significance. Further research involving larger populations is needed to clarify the role of CLT in the models predicting the effectiveness of radioiodine therapy.
The use of the Kaplan–Meier curves for treatment‑free survival analysis provided a more detailed and nuanced understanding of the relationship between various parameters and the need for RAI treatment, as well as its efficacy. By considering treatment‑free survival as a time‑to‑event outcome rather than a binary one, we accounted for all treatments received during follow‑up, not just the need for a second RAI dose 12 months after the initial treatment. This approach yielded more granular data and improved the clarity and interpretability of our results.
We included both binary and linear analyses of the sTg concentration, which allowed for a more comprehensive evaluation of its impact on treatment‑free survival. These analyses offer valuable insights into the prognostic factors affecting treatment outcomes in patients with DTC, potentially informing more personalized treatment strategies and follow‑up protocols.
The Kaplan–Meier analysis confirmed that Tg concentration is a factor affecting treatment‑free survival, with sTg levels below the cutoff value of 7.22 ng/ml being associated with improved survival outcomes.
Our study has several limitations. First, we did not have an external dataset for the model validation. However, we implemented an internal cross‑validation procedure. The advantage of this approach is a more homogenous population that enhances reliability of the results, as all data were used for both training and validation. This method mitigates the risk of overfitting and provides a more robust evaluation of the model’s performance. Second, we lacked access to ultrasound data to assess thyroid remnant volume, a factor that can influence Tg concentrations. Third, the nonrandomized design and retrospective nature of patient inclusion present inherent biases. Nonetheless, the database was designed to include all patients consecutively admitted to the hospital, providing a representative model of the population. Finally, to account for missing values and to avoid bias associated with analyzing only the complete cases, we conducted multiple imputations.
By analyzing the performance of different clinicopathological models in predicting the efficacy of RAI therapy in patients with DTC, we aimed to highlight their potential for guiding clinical decision‑making and advancing the paradigm of personalized thyroid cancer management. Our findings indicate that all analyzed models have a comparable predictive value, supporting the use of sTg as a standalone parameter for predicting efficacy of RAI therapy. The identified cutoff value for sTg in this context is 7.22 ng/ml. We also established that future research should further investigate the influence of CLT status on the prediction of an excellent response to the first RAI dose in patients with DTC.
- Curado MP, Edwards B, Shin HR, et al. Cancer incidence in five continents, Volume IX. IARC Sci Publ. 2008; 160: 1‑837.
- Pizzato M, Li M, Vignat J, et al. The epidemiological landscape of thyroid cancer worldwide: GLOBOCAN estimates for incidence and mortality rates in 2020. Lancet Diabetes Endocrinol. 2022; 10: 264‑272. | Crossref
- Haugen BR, Alexander EK, Bible KC, et al. 2015 American Thyroid Association Management Guidelines for Adult Patients with Thyroid Nodules and Differentiated Thyroid Cancer: The American Thyroid Association Guidelines Task Force on Thyroid Nodules and Differentiated Thyroid Cancer. Thyroid. 2016; 26: 1‑133. | Crossref
- Borowczyk M, Sypniewski M, Szyda J, et al. Genetic predisposition to differentiated thyroid cancer in the Polish population. Pol Arch Intern Med. 2024; 134: 16654. | Crossref
- Verburg FA, Mäder U, Luster M, Reiners C. Histology does not influence prognosis in differentiated thyroid carcinoma when accounting for age, tumour diameter, invasive growth and metastases. Eur J Endocrinol. 2009; 160: 619‑624. | Crossref
ARTICLE INFORMATION