
Clinical characteristics and outcomes of young patients with acute myocardial infarction: the YAMI registry
Key words: coronary angiography, mortality, myocardial infarction, percutaneous coronary intervention, young adults

 CC BY 4.0
Clinical characteristics and outcomes of young patients with acute myocardial infarction: the YAMI registry
CC BY 4.0
Introduction: Premature myocardial infarction (MI) is characterized by diverse pathophysiology. Despite its low prevalence, it bears serious health and social consequences.
Objectives: The aim of the study was to evaluate young MI patients (≤45 years) in terms of clinical characteristics and long‑term outcomes.
Patients and methods: This is an observational study including 221 patients aged 45 years or younger (women, 16.7%; mean [SD] age, 38.4 [4.8] years) hospitalized due to acute MI between January 2017 and April 2023. Data were extracted from the Academic Repository of Clinical Cases of Medical University of Silesia. The young MI patients were compared with a representative MI cohort older than 45 years (n = 2256). The mean (SD) follow‑up was 648.7 (178.7) days. The primary end point was all‑cause mortality.
Results: The patients with MI aged up to 45 years were predominantly men (83.3%), and were characterized by lower mortality (7.2% vs 15%; log‑rank P = 0.01), shorter hospitalization time (median [interquartile range], 4 [3–6] vs 5 [3–6] days; P = 0.03), and less pronounced cardiovascular risk factors than the older group. The Cox regression analysis showed that in the MI patients aged up to 45 years, occurrence of peri‑MI sudden cardiac arrest, Q wave presence, higher volume of contrast, and a lack of qualification for cardiac rehabilitation (CR) were independent predictors of mortality. In 15.8% of the younger cohort, MI was unrelated to ruptured atheroma. The patients with nonclassic MI pathophysiology were younger, more often female, more frequently presented with acute non–ST‑segment elevation MI, had lower prevalence of hyperlipidemia and hypertension, and were less often referred for percutaneous coronary intervention and CR, and more often for optical coherence tomography and cardiac magnetic resonance imaging, as compared with the individuals with classic MI.
Conclusions: Young MI patients have a favorable prognosis and frequently present with atypical MI pathophysiology. Participation in CR is of utmost importance in mortality reduction regardless of patient age.
What's new?
Although young men are more likely to experience myocardial infarction (MI) than women, the mortality rates associated with a coronary incident tend to be higher in the female population. Overall, young patients with acute MI have a more favorable prognosis than older individuals; however, the higher rate of atypical MI pathophysiology unrelated to ruptured atheromatous plaque necessitates an in‑depth diagnostic process. The infrequent use of complementary diagnostic method, such as intravascular imaging or cardiac magnetic resonance imaging, stresses the importance of their further implementation. Referral for cardiac rehabilitation represents a vital method of mortality reduction in young patients with MI. Young patients with MI have a favorable prognosis, however, higher mortality in women, atypical pathophysiology and limited use of advanced diagnostic methods highlight the key areas requiring improvement.
Introduction
While the incidence of myocardial infarction (MI) in young patients is low, the health, economic, and social consequences seem to be inestimable.1 Premature MI represents a unique clinical entity with diverse pathophysiology. Although atheromatous plaque instability represents the most common cause of MI in all age categories, accumulating evidence suggests that pathophysiology of MI in young patients is frequently different from classic atheroma‑related coronary incidents, and is often related to secondary MI in the course of ischemic heart disease, spontaneous coronary artery dissection (SCAD), coronary spasm or systemic coronary embolism, or myocardial bridging.2-5 On top of it, young individuals suffering from MI, especially women, tend to present with atypical symptoms; hence, there is a pressing need for characterizing this patient population.6,7 At the same time, overcoming traditional risk factors should be the primary preventive measure in both old and young patients, as atheroma formation begins as early as in infancy.7 An in‑depth interview with young individuals is crucial and should include information on traditional risk factors, possible symptoms of thrombophilia, and, most importantly, possible drug toxicity.8 Young adults with signs of embolic MI should be further referred for postdischarge thrombophilia screening.5
As the rate of atypical MI in young adults is considerable, assessment of the coronary artery anatomy merely by means of invasive coronary angiography may be insufficient. Given the high detection rate of MI with nonobstructive coronary arteries (MINOCA) on initial coronary angiography, utilization of cardiac magnetic resonance (CMR) imaging is of utmost importance to exclude other pathologies responsible for such a clinical presentation (acute myocarditis, takotsubo cardiomyopathy, or occult subendocardial MI).8,9 Also, additional use of intravascular imaging, such as optical coherence tomography (OCT) or intravascular ultrasound (IVUS), may yield a diagnosis of plaque erosion or SCAD, which would otherwise be missed on coronary angiography.10,11 Provocation tests with acetylcholine may provide evidence of coronary artery spasm as a mechanism responsible for myocardial ischemia.
There is a paucity of current data on risk factors and long‑term prognosis in a unique subgroup of patients with MI at the age of 45 years or younger. Thus, the aim of this study was to evaluate clinical and procedural characteristics and mortality rate of young patients with MI (≤45 years) referred for coronary angiography, in relation to older age categories.
Patients and methods
This retrospective, single‑center study included 221 patients who were admitted to the Departments of Cardiology, Medical University of Silesia, Upper‑Silesian Medical Center in Katowice, Poland between January 2017 and April 2023. Anonymous patient data were derived from the Academic Repository of Clinical Cases of Medical University of Silesia.
The database was searched to identify consecutive patients at the age of 45 years or younger with a diagnosis of MI according to the International Classification of Diseases, Tenth Revision (billing codes, I21.0–I21.9). A total of 412 records were initially obtained. All patients diagnosed with MI on admission, both ST‑segment elevation MI (STEMI) and non‑STEMI (NSTEMI), confirmed according to the fourth universal definition of MI, were eligible for inclusion.12 All pathophysiological types of MI (1–5, according to the fourth universal definition of MI) were taken into consideration.12
We excluded patients hospitalized for elective percutaneous coronary intervention (PCI) or coronary artery bypass grafting (CABG), those participating in inpatient cardiac rehabilitation (CR) as part of the Managed Care after Acute Myocardial Infarction program functioning in Poland (MC‑AMI/KOS‑Zawal), and individuals with prior episodes of MI, chest pain without acute coronary syndrome (ACS), or other causes of troponin rise (exercise‑induced myocardial damage, elevated blood pressure). Exclusion criteria also comprised a lack of coronary angiography results, incomplete data on the MI type, and loss to follow‑up. This eventually led to a selection of 221 young patients with acute MI included in the YAMI registry. The health record selection process is presented in Figure 1. Prior hospitalizations due to episodes of MI were included in the database part concerning medical history, while the health records on hospitalizations related to participation in the post‑MI comprehensive care program were included in the follow‑up part of the database. The primary end point was all‑cause mortality. The follow‑up ended in April, 2024.
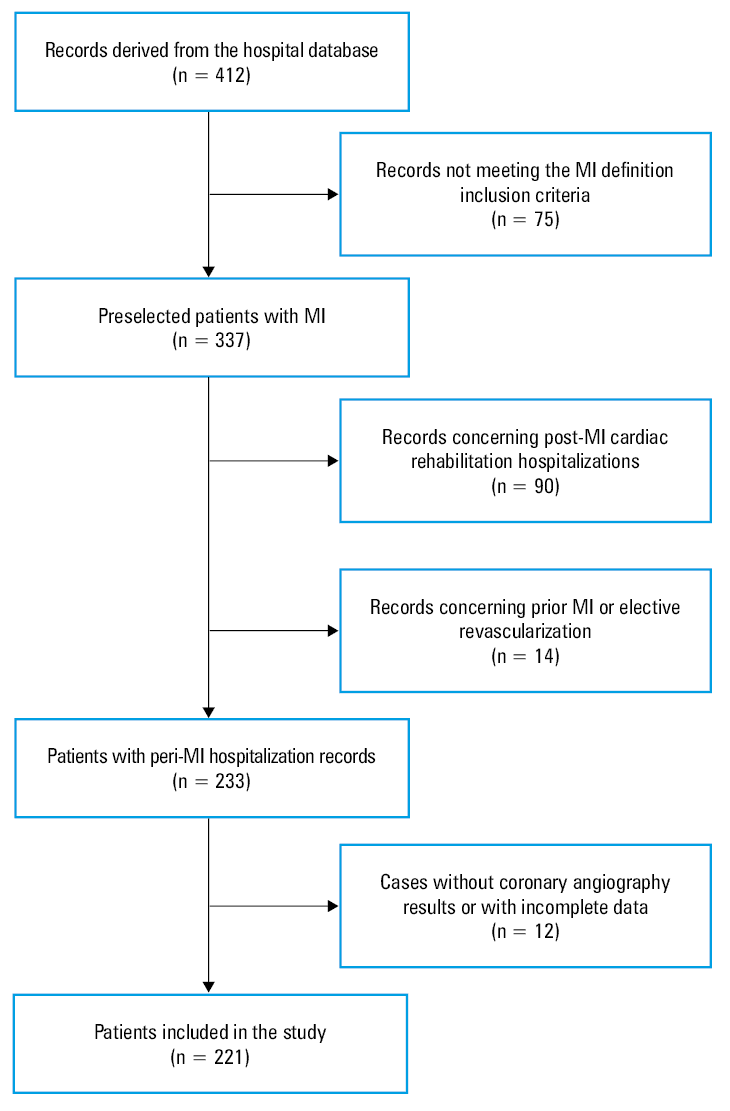
Abbreviations: MI, myocardial infarction
The abovementioned group of MI patients aged up to 45 years was then compared with a representative group of individuals over 45 years of age diagnosed with MI, which was derived from a study carried out in the same medical center by Wita et al.13
The collected data encompassed demographic characteristics (sex, age), medical history (concomitant diseases, substance abuse, family history of cardiovascular diseases, prior MIs, and vascular interventions [PCI and CABG]), electrocardiogram (ECG) both on admission and at discharge, echocardiography on admission, ECG Holter monitoring, laboratory test results, occurrence of peri‑MI sudden cardiac arrest (SCA), and MI etiology. Procedural characteristics of coronary angiography and PCI were also taken into consideration, and included the number of revascularization stages, culprit artery, stent type, length, and diameter, volume of contrast, procedural outcomes and complications, as well as results of additional diagnostic tests, such as OCT or IVUS. The follow‑up data comprised the dead / alive status, elective revascularization stages, value of metabolic equivalent of tasks on admission and at discharge during the CR program, and ejection fraction value measured during the rehabilitation‑related hospital stay.
The MI etiology was established on the basis of the initial diagnosis and coronary angiography findings. We used the term “classic MI” to define MI related to a rupture or erosion of an atheromatous plaque, embracing also types 4a (MI related to a coronary intervention), 4b (MI related to stent thrombosis), and 4c (MI related to stent restenosis).12 We also distinguished nonclassic MI, which encompassed type 2 MI induced by factors such as arrhythmia, hypertensive crisis, drug use, and coronary spasm, as well as coronary embolism–associated MI, which refers to cases of embolic material in the coronary arteries without sclerotic plaques, caused by either endocarditis or intracardiac thrombi. Nonclassic MI also comprised SCAD and MINOCA at discharge, if the etiology was not unequivocally established during hospitalization. If the initial MINOCA diagnosis led to a complex diagnostic workup resulting in identification of the true cause of the symptoms, the MI was categorized accordingly.
Estimated glomerular filtration rate (eGFR) was calculated according to the Modification of Diet in Renal Disease GFR equation. Left ventricular ejection fraction (LVEF) was assessed using the modified Simpson biplane method.
The patients were treated in line with the contemporary European guidelines on the management of acute STEMI14 and NSTEMI.15 All study participants were referred for coronary angiography. The patients with a diagnosis of acute MI were subject to electrocardiographic surveillance for at least 48 hours.
Qualification for postdischarge CR as part of the MC‑AMI program was based on a patient’s medical condition enabling them to participate in the rehabilitation program and their informed consent. CR lasting for 3 weeks was carried out either in an outpatient daily CR department or an in‑hospital CR ward.13 The decision to refer a patient for inpatient CR was based on decreased LVEF (≤35%), high comorbidity index, and pronounced frailty syndrome. CR encompassed repeated rest electrocardiography, transthoracic echocardiography, the 6‑minute walk test, and an initial treadmill test to adjust the level and intensity of further physical exercise, which involved individual and group training under the supervision of a physical therapist, accompanied by education about cardiovascular risk factors and lifestyle modifications.
In both cohorts, the follow‑up data on mortality were acquired from the Polish national health care provider and included the exact time of the event.
The study protocol was approved by the Ethics Committee of the Medical University of Silesia (BNW/NWN/0052/KB/127/24). Due to the retrospective nature and registry‑based design of this study, written informed consent from the patients was not required.
Statistical analysis
Statistical analysis was performed using the SPSS v.25.0 software (IBM Corp., Armonk, New York, United States). The distribution of continuous variables was checked using the Shapiro–Wilk test, and the variables were presented as arithmetic mean (SD) or median with interquartile range (IQR). Also, if the difference between the median and SD was negative, continuous variables were expressed as median (IQR). Qualitative parameters were expressed as absolute numbers with percentages. Differences between the groups were compared using the χ2 test (qualitative parameters with a count >30) and the Fisher exact test (count ≤30), the Mann–Whitney test (non‑normal distribution), or the t test (normal distribution). The all‑cause mortality prediction was calculated using the univariable Cox proportional hazards model. Subsequently, all parameters with a P value below 0.1 were incorporated into the stepwise multivariable Cox proportional hazards model to establish the independent predictors of all‑cause mortality. The Kaplan–Meier survival curves were plotted to demonstrate differences in survival between the younger and older MI cohorts. A 2‑sided P value below 0.05 was considered significant.
Results
A total of 2477 patients (>45 years, n = 2256; ≤45 years, n = 221; mean [SD] age, 72.9 [13.9] years) were included in the study. Of those, 1672 were men (67.5%). Baseline characteristics and periprocedural variables of the whole study population are presented in Table 1.
Parameter | Value | |
Data are presented as number (percentage) or median (interquartile range) unless indicated otherwise.
SI conversion factors: to convert TC, LDL‑C, and HDL‑C to mmol/l, multiply by 0.0259; triglycerides to mmol/l, by 0.0113.
Abbreviations: CABG, coronary artery bypass graft; CKD, chronic kidney disease; eGFR, estimated glomerular filtration rate; HDL‑C, high‑density lipoprotein cholesterol; LDL‑C, low‑density lipoprotein cholesterol; LVEF, left ventricular ejection fraction; MC‑AMI, Managed Care after Acute Myocardial Infarction program (KOS‑Zawal); NSTEMI, non–ST‑segment elevation myocardial infarction; PCI, percutaneous coronary intervention; STEMI, ST‑segment elevation myocardial infarction; TC, total cholesterol | ||
Men | 1672 (67.5) | |
Age, y, mean (SD) | 72.9 (13.9) | |
Mortality | 354 (14.3) | |
Time to death, d | 240 (90–420) | |
Follow‑up, d | 720 (690–720) | |
Duration of hospitalization, d | 4 (3–6) | |
NSTEMI | 1703 (68.8) | |
STEMI | 748 (30.2) | |
Qualification for MC‑AMI | 813 (32.9) | |
Hypertension | 1924 (78.2) | |
Diabetes mellitus | Type 1 | 16 (0.7) |
Type 2 | 800 (32.5) | |
Hyperlipidemia | 1706 (71.3) | |
Atrial fibrillation | 241 (9.8) | |
Heart failure | 1080 (43.9) | |
CKD | 585 (24.5) | |
Past / current smoker | 1033 (43.2) | |
Previous STEMI | 366 (14.9) | |
Previous NSTEMI | 405 (16.5) | |
Previous stroke | 194 (7.9) | |
LVEF, %, mean (SD) | 44.8 (11.3) | |
Mitral regurgitation | 1734 (72) | |
PCI | 1809 (73.2) | |
Number of stents, mean (SD) | 1.5 (0.8) | |
Qualification for CABG | 130 (5.3) | |
eGFR, ml/min/1.73 m2, mean (SD) | 72.4 (20.4) | |
TC, mg/dl, mean (SD) | 168 (45.5) | |
LDL‑C, mg/dl, mean (SD) | 97.5 (41.1) | |
HDL‑C, mg/dl, mean (SD) | 44.3 (14.4) | |
Triglycerides, mg/dl, mean (SD) | 137.5 (80.7) | |
Characteristics of the 2 age groups are compared in Table 2. A vast majority of MI episodes in the younger group occurred in men (83.3%), and the duration of hospitalization was shorter in the younger than in the older group (median [IQR], 4 [3–6] vs 5 [3–6] days; P = 0.03). In the younger MI group, STEMI was more prevalent than NSTEMI (53.8% vs 45.7%; P <0.001), while in the older cohort NSTEMI dominated over STEMI (71% vs 27.9%; P <0.001). Noteworthy, the younger patients had a lower prevalence of arterial hypertension, hyperlipidemia, diabetes mellitus, chronic kidney disease, atrial fibrillation, and heart failure (Table 2). However, they presented with higher levels of total cholesterol (TC), low‑density lipoprotein cholesterol, and triglycerides, higher eGFR, and were more often past or current smokers. Although it was more common for the patients in the younger group to undergo PCI (85.3% vs 72%; P <0.001), the procedure required fewer stents (mean [SD], 1.3 [0.5] vs 1.5 [0.8]; P = 0.004), as compared with the older group. Of note, the younger patients were more often referred for CR than the older individuals (52.7% vs 30.9%; P <0.001).
Parameter | Study group (≤45 y; n = 221) | Control group (>45 y; n = 2256) | P value | |
Data are presented as number (percentage) or median (interquartile range) unless indicated otherwise.
SI conversion factors: see Table 1
Abbreviations: see Table 1 | ||||
Men | 184 (83.3) | 1488 (66) | <0.001 | |
Age, y, mean (SD) | 38.4 (4.8) | 69.2 (10.1) | <0.001 | |
Mortality | 16 (7.2) | 338 (15) | 0.002 | |
Time to death, d | 12.5 (1.5–200) | 240 (120–420) | 0.001 | |
Follow‑up, d | 720 (442–720) | 720 (700–720) | <0.001 | |
Duration of hospitalization, d | 4 (3–6) | 5 (3–6) | 0.03 | |
NSTEMI | 101 (45.7) | 1602 (71) | <0.001 | |
STEMI | 119 (53.8) | 629 (27.9) | ||
Qualification for MC‑AMI | 116 (52.7) | 697 (30.9) | <0.001 | |
Hypertension | 84 (40) | 1840 (81.7) | <0.001 | |
Diabetes mellitus | Type 1 | 6 (2.9) | 10 (0.4) | <0.001 |
Type 2 | 16 (7.7) | 784 (34.8) | ||
Hyperlipidemia | 122 (57.5) | 1 584 (72.6) | <0.001 | |
Atrial fibrillation | 3 (1.5) | 238 (10.6) | <0.001 | |
Heart failure | 9 (4.3) | 1071 (47.5) | <0.001 | |
CKD | 7 (3.4) | 578 (26.5) | <0.001 | |
Past / current smoker | 130 (65) | 902 (41.2) | <0.001 | |
Previous STEMI | 19 (9.2) | 347 (15.4) | 0.02 | |
Previous NSTEMI | 12 (5.8) | 393 (17.5) | <0.001 | |
Previous stroke | 3 (1.5) | 191 (8.5) | <0.001 | |
LVEF, %, mean (SD) | 45.7 (11.6) | 44.8 (11.2) | 0.15 | |
Mitral regurgitation | 103 (49.5) | 1 631 (74.2) | <0.001 | |
PCI | 185 (85.3) | 1624 (72) | <0.001 | |
Number of stents, mean (SD) | 1.3 (0.5) | 1.5 (0.8) | 0.004 | |
Qualification for CABG | 15 (6.8) | 115 (5.1) | 0.53 | |
eGFR, ml/min/1.73 m2, mean (SD) | 90.5 (25.4) | 70.8 (19.1) | <0.001 | |
TC, mg/dl | 181.8 (46.8) | 167.6 (45.4) | 0.03 | |
LDL‑C, mg/dl, mean (SD) | 109.6 (46.5) | 97.1 (40.9) | 0.07 | |
HDL‑C, mg/dl, mean (SD) | 39.8 (12) | 44.4 (14.4) | 0.01 | |
Triglycerides, mg/dl, mean (SD) | 161.0 (76.3) | 136.8 (80.8) | 0.004 | |
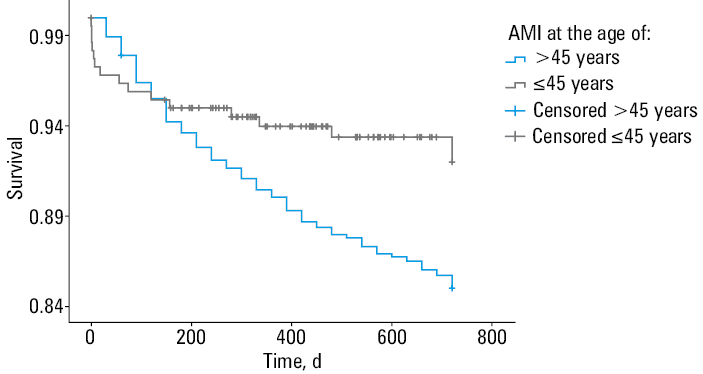
The mean (SD) follow‑up time was 648.7 (178.7) days. The overall mortality rate was 14.3% (n = 354), with a mean (SD) time to death of 287 (211.8) days. The mortality rate was lower in the younger than the older MI group (7.2% vs 15%; P = 0.002). The Kaplan–Meier survival curve showed that the patients with MI aged up to 45 years had a lower risk of death than the older patients (log‑rank P = 0.01; Figure 2).
Univariable analysis showed that all‑cause mortality in the whole study population was predicted by female sex, older age, occurrence of peri‑MI SCA, no history of PCI, lower eGFR, presence of mitral regurgitation, lower LVEF, a history of atrial fibrillation, heart failure, STEMI, and stroke, as well as a lack of qualification for the MC‑AMI program (Table 3). The multivariable Cox proportional hazards model indicated that older age, lower LVEF, lower eGFR, and a lack of qualification for MC‑AMI were independent predictors of all‑cause mortality.
Parameter | Univariable model | Multivariable model | ||||
HR | 95% CI | P value | HR | 95% CI | P value | |
Abbreviations: AF, atrial fibrillation; HF, heart failure; HR, hazard ratio; SCA, sudden cardiac arrest; others, see Table 1 | ||||||
Female sex | 1.28 | 1.03–1.58 | 0.02 | – | – | – |
Peri‑MI SCA | 1.74 | 1.34–2.25 | <0.001 | – | – | – |
AF | 2.13 | 1.63–2.8 | <0.001 | – | – | – |
HF | 2.52 | 2.03–3.13 | <0.001 | – | – | – |
Previous STEMI | 1.31 | 1–1.71 | 0.05 | – | – | – |
Previous stroke | 2.35 | 1.76–3.13 | <0.001 | – | – | – |
PCI | 0.73 | 0.58–0.91 | 0.005 | – | – | – |
Mitral regurgitation | 2.15 | 1.61–2.86 | <0.001 | – | – | – |
Age, y | 1.04 | 1.03–1.05 | <0.001 | 1.03 | 1.02–1.05 | <0.001 |
Age ≤45 y | 0.53 | 0.32–0.88 | 0.01 | 0.43 | 0.31–0.59 | 0.02 |
LVEF, % | 0.96 | 0.95–0.97 | <0.001 | 0.97 | 0.96–0.98 | <0.001 |
Qualification for MC‑AMI | 0.31 | 0.23–0.41 | <0.001 | 0.43 | 0.31–0.59 | <0.001 |
eGFR, ml/min/1.73 m2 | 0.97 | 0.97–0.98 | <0.001 | 0.98 | 0.98–0.99 | <0.001 |
The in‑depth characteristics of the group aged 45 years or younger according to the MI etiology (classic vs nonclassic) are presented in Table 4. Over one‑fifth of the younger patients required multivessel PCI, and nearly 20% underwent 2 or more PCI stages. Each procedure involving invasive testing for coronary artery disease (CAD; ie, OCT, IVUS, or fractional flow reserve [FFR]) was used in less than 3% of the cases during the first‑stage PCI (1.9% vs 2.3% vs 2.3%, respectively), while 3.7% underwent CMR imaging during hospitalization.
Parameter | Whole study group (n = 221) | Classic MI (n = 186) | Nonclassic MI (n = 35) | P value | |
Data are presented as number (percentage) or median (interquarile range) unless indicated otherwise.
SI conversion factors: to convert creatinine to μmol/l, multiply by 88.4; others, see Table 1.
Abbreviations: II*/III* AVB, second- or third‑degree atrioventricular block; CAD, coronary artery disease; CICU, cardiac intensive care unit; CMR, cardiac magnetic resonance; DEB, drug‑eluting balloon; DES, drug‑eluting stent; ECG, electrocardiogram; ESRD, end‑stage renal disease; HR, heart rate; ICU, intensive care unit; IFG, impaired fasting glucose; IGT, impaired glucose tolerance; IVUS, intravascular ultrasound; LA, left atrium; LBBB, left bundle branch block; METs, metabolic equivalent of task; MR, mitral regurgiration; OCT, optical coherence tomography; SWMA, segmental wall‑motion abnormality; TIMI, thrombolysis in myocardial infarction; TCFA, thin‑cap fibroatheroma; VTE, venous thromboembolism; others, see Tables 1 and 3 | |||||
Men | 184 (83.3) | 164 (88.2) | 20 (57.1) | <0.001 | |
Age, y, mean (SD) | 38.4 (4.8) | 38.9 (4.4) | 35.6 (5.7) | 0.001 | |
Overall mortality | 16 (7.2) | 13 (7) | 3 (8.6) | 0.74 | |
In‑hospital mortality | 8 (3.6) | 5 (2.7) | 3 (8.6) | 0.09 | |
Follow‑up, d | 577.8 (214.5) | 1268.3 (887.9) | 1153.2 (818.8) | 0.52 | |
Duration of hospitalization, d | 4 (3–6) | 4 (3–6) | 4 (3–7) | 0.85 | |
Stay in the ICU/CICU | 38 (17.3) | 32 (17.3) | 6 (17.1) | 0.98 | |
Cardiogenic shock | 35 (15.9) | 30 (16.2) | 5 (14.3) | 0.78 | |
NSTEMI | 101 (45.7) | 76 (40.9.) | 25 (71.4) | <0.001 | |
STEMI | 119 (53.8) | 110 (59.1) | 9 (25.7) | <0.001 | |
Qualification for MC‑AMI | 116 (52.7) | 110 (59.5) | 6 (17.1) | <0.001 | |
Peri‑MI SCA | 35 (15.8) | 29 (15.6) | 6 (17.1) | 0.82 | |
Arterial hypertension | 84 (40) | 78 (43.8) | 6 (18.8) | 0.008 | |
Prediabetes (IFG/IGT) | 4 (1.9) | 4 (2.3) | 0 | 0.39 | |
Diabetes mellitus | Type 1 | 6 (2.9) | 6 (3.4) | 0 | 0.31 |
Type 2 | 16 (7.7) | 15 (8.5) | 1 (3.1) | ||
Insulin therapy | 10 (4.8) | 10 (5.7) | 0 | 0.17 | |
Hyperlipidemia | 122 (57.5) | 114 (64) | 8 (23.5) | <0.001 | |
Atrial fibrillation | 3 (1.5) | 3 (1.7) | 0 | 0.45 | |
History of heart failure | 9 (4.3) | 8 (4.6) | 1 (3) | 0.69 | |
CKD | 7 (3.4) | 7 (4) | 0 | 0.25 | |
ESRD | 5 (2.4) | 4 (2.3) | 1 (3.1) | 0.78 | |
Neoplasm | 6 (2.9) | 4 (2.3) | 2 (6.1) | 0.25 | |
Chemotherapy | 5 (2.5) | 3 (1.8) | 2 (6.1) | 0.14 | |
Hypothyroidism | 8 (3.9) | 4 (2.3) | 4 (12.5) | 0.006 | |
Autoimmune disease | 10 (4.9) | 5 (2.9) | 5 (15.6) | 0.001 | |
Essential thrombocytosis | 1 (0.5) | 0 | 1 (3.1) | 0.02 | |
Past / current smoker | 130 (65) | 118 (70.7) | 12 (36.4) | <0.001 | |
Alcohol use | 46 (23.1) | 37 (22.3) | 9 (27.3) | 0.54 | |
Recreational drug use | 9 (4.6) | 7 (4.3) | 2 (6.3) | 0.62 | |
Steroid use | 11 (5.5) | 6 (3.6) | 5 (15.6) | 0.006 | |
History of STEMI | 19 (9.2) | 18 (10.3) | 1 (3.1) | 0.2 | |
History of NSTEMI | 12 (5.8) | 11 (6.3) | 1 (3.1) | 0.48 | |
Previous PCI | 27 (13.1) | 25 (14.4) | 2 (6.3) | 0.07 | |
Previous CABG | 1 (0.5) | 0 | 1 (3.1) | ||
Previous stroke | 3 (1.5) | 2 (1.1) | 1 (3.1) | 0.39 | |
Previous VTE | 6 (2.9) | 5 (2.9) | 1 (3.1) | 0.95 | |
Family history of CAD | 86 (44.3) | 77 (47.2) | 9 (29) | 0.06 | |
Echocardiographic and electrocardiographic parameters | |||||
ECG on admission | HR, bpm, mean (SD) | 81.5 (22.1) | 81.3 (21.9) | 82.3 (23.5) | 0.99 |
AF | 4 (2.3) | 3 (2.1) | 1 (3.3) | 0.87 | |
LBBB | 2 (1.1) | 2 (1.4) | 0 | 0.66 | |
II*/III* AVB | 2 (1.1) | 2 (1.4) | 0 | 0.53 | |
Significant ST‑segment elevation | 112 (59.3) | 101 (63.9) | 11 (35.5) | 0.003 | |
Pathological Q wave | 48 (27.7) | 42 (29.2) | 6 (20.7) | 0.35 | |
ECG at discharge | HR, bpm, mean (SD) | 70.5 (12.4) | 69.9 (11.6) | 74.9 (17.5) | 0.24 |
Significant ST‑segment elevation | 37 (26.8) | 36 (29.5) | 1 (6.3) | 0.048 | |
Pathological Q wave | 63 (45.7) | 55 (45.1) | 8 (50) | 0.71 | |
Echocardiographic parameters | LVEF, %, mean (SD) | 45.7 (11.6) | 45.3 (11.4) | 47.9 (12.4) | 0.16 |
LA diameter, mm, mean (SD) | 36.5 (5.5) | 36.5 (5.5) | 36.6 (5.5) | 0.9 | |
Significant valve disease | 28 (13.3) | 2 (11.9) | 7 (20.6) | 0.17 | |
MR | 103 (49.5) | 85 (48.3) | 18 (56.3) | 0.41 | |
SWMA | 171 (80.3) | 146 (82) | 25 (71.4) | 0.15 | |
Periprocedural data | |||||
PCI | 185 (85.3) | 175 (96.2) | 10 (28.6) | <0.001 | |
Multivessel PCI | 42 (22.8) | 42 (24) | 0 | 0.25 | |
Qualification for CABG | 15 (6.8) | 15 (8.1) | 0 | 0.09 | |
PCI stages, n, mean (SD) | 1.2 (0.5) | 1.2 (0.5) | 1 (0) | 0.15 | |
Stent type | DES | 168 (97.7) | 162 (97.6) | 6 (100) | 0.93 |
DEB | 3 (1.7) | 3 (1.8) | 0 | ||
Both | 1 (0.6) | 1 (0.6) | 0 | ||
Number of stents, mean (SD) | 1.3 (0.5) | 1.3 (0.5) | 1.5 (0.5) | 0.25 | |
Volume of contrast, ml, mean (SD) | 138.9 (63.6) | 149.3 (60.3) | 86.4 (53.9) | <0.001 | |
TIMI grade, mean (SD) | 2.9 (0.3) | 3 (0.2) | 2.6 (1.1) | 0.09 | |
OCT | 4 (1.9) | 1 (0.6) | 3 (8.8) | 0.001 | |
TCFA on OCT | 1 (25) | 0 | 1 (33.3) | 0.16 | |
IVUS | 5 (2.3) | 4 (2.2) | 1 (2.9) | 0.8 | |
FFR | 5 (2.3) | 5 (2.7) | 0 | 0.33 | |
Two‑stage PCI | 35 (18.9) | 35 (20) | 0 | – | |
IABP | 2 (0.9) | 2 (1.1) | 0 | 0.53 | |
CMR during hospitalization | 8 (3.7) | 1 (0.5) | 7 (20) | <0.001 | |
Laboratory tests | |||||
Maximal troponin T level, ng/ml | 0.9 (0.2–2.8) | 1.1 (0.2–3.3) | 0.4 (0.2–2) | 0.16 | |
Serum creatinine, mg/dl | 0.9 (0.8–1) | 0.9 (0.8–1) | 0.8 (0.7–1) | 0.19 | |
eGFR, ml/min/1.73 m2, mean (SD) | 90.5 (25.4) | 89.9 (25) | 93.9 (27.7) | 0.46 | |
Anemia | 18 (8.1) | 13 (7) | 5 (14.3) | 0.03 | |
TC, mg/dl, mean (SD) | 181.8 (46.8) | 185.3 (46.4) | 138 (26.7) | 0.01 | |
LDL‑C, mg/dl, mean (SD) | 109.6 (46.5) | 112 (47.3) | 81.5 (24.7) | 0.13 | |
HDL‑C, mg/dl, mean (SD) | 39.8 (12) | 39.9 (12) | 38.5 (13) | 0.9 | |
Triglycerides, mg/dl, mean (SD) | 161 (76.3) | 166.7 (76.4) | 91 (17.5) | 0.02 | |
MC‑AMI rehabilitation program | |||||
LVEF, %, mean (SD) | 53.4 (5.4) | 53.4 (5.5) | 53.3 (5.8) | 0.9 | |
METs on admission | 9.2 (2.1) | 9.2 (2.1) | 9.5 | 0.73 | |
METs at discharge | 11.7 (2.1) | 11.7 (2.1) | 12.1 | 0.83 | |
Among the patients with classic MI (n = 186), 180 individuals experienced type 1 MI (96.8%), 3 had type 4b MI (1.6%), and 3 had type 4c MI (1.6%). In the nonclassic MI group, 20 patients had type 2 MI (57.1%), 6 were diagnosed with coronary embolism–associated MI (17.1%), another 6 were diagnosed with MINOCA at discharge (17.1%), while 3 individuals experienced SCAD (8.6%) (Figure 3). Nonclassic MI was associated with female sex, younger age, more frequent NSTEMI presentation, a lower rate of arterial hypertension, hyperlipidemia, and cigarette smoking, and a higher rate of autoimmune, thyroid, and coagulative disorders (Table 4). The patients with nonclassic MI less frequently underwent PCI, but more frequently underwent OCT and CMR imaging (Table 4). Classic MI was associated with male sex, older age, smoking, and a higher prevalence of significant ST‑segment elevation or ST‑segment depression. Interestingly, a history of hypothyroidism, autoimmune diseases, and steroid use were associated with nonclassic MI. There were no significant differences between the 2 groups in terms of echocardiographic parameters and ECG Holter monitoring. The classic MI group more often required PCI (96.2% vs 28.6%; P <0.001) and a higher volume of contrast (mean [SD], 149.3 [60.3] vs 86.4 [53.9] ml; P <0.001), and underwent more PCI stages (mean [SD], 1.2 [0.5] vs 1 [0]; P = 0.15), as compared with the nonclassic MI group.
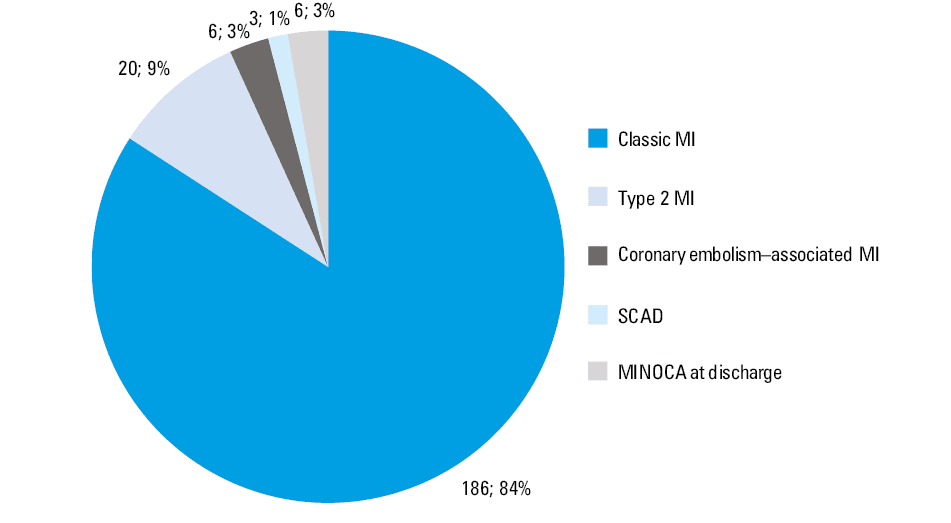
Abbreviations: MINOCA, myocardial infarction with nonobstructed coronary arteries; SCAD, spontaneous coronary artery dissection
The all‑cause mortality predictors in the group of patients aged up to 45 years were peri‑MI SCA, lower LVEF, presence of Q wave in 2 contiguous leads, a history of heart failure and chronic kidney disease, need for multivessel PCI and a higher volume of contrast, presence of an acute mechanical circulatory support device (intra‑aortic balloon pump), and a lack of qualification for MC‑AMI. In the Cox proportional hazards model analysis, occurrence of peri‑MI SCA, presence of Q wave in 2 contiguous leads, higher volume of contrast, and a lack of qualification for MC‑AMI were independent predictors of all‑cause mortality in the younger group (Table 5).
Parameter | Univariable model | Multivariable model | ||||
HR | 95% CI | P value | HR | 95% CI | P value | |
Female sex | 0.7 | 0.16–3.07 | 0.64 | – | – | – |
Age, y | 0.98 | 0.99–1.07 | 0.63 | – | – | – |
Presence of AMCSD | 8.71 | 1.16–65.5 | 0.04 | – | – | – |
Classic MI | 0.78 | 0.22–2.73 | 0.7 | – | – | – |
MI related to other causes | 0.81 | 0.11–6.06 | 0.84 | – | – | – |
SCAD | 6.38 | 0.85–48.07 | 0.07 | – | – | – |
Initial MINOCA | 5.88 | 0.78–44.15 | 0.09 | – | – | – |
Hyperlipidemia | 0.36 | 0.13–1.06 | 0.06 | – | – | – |
AF | 5.1 | 0.67–38.59 | 0.12 | – | – | – |
HF | 12.6 | 3.94–40.26 | <0.001 | – | – | – |
HR, bpm | 1.01 | 0.99–1.04 | 0.23 | – | – | – |
LVEF, % | 0.95 | 0.92–0.99 | 0.01 | – | – | – |
LA diameter, mm | 1.11 | 0.99–1.23 | 0.07 | – | – | – |
QRS width, ms | 1.04 | 0.9–1.19 | 0.62 | – | – | – |
Hs‑TnT, per 1 ng/ml | 1.19 | 0.9–1.56 | 0.23 | – | – | – |
Multivessel PCI | 3.72 | 1.38–10.05 | 0.01 | – | – | – |
Peri‑MI SCA | 4.75 | 1.78–12.7 | 0.002 | 30.78 | 1.05–904.24 | 0.048 |
Qualification for MC‑AMI | 0.2 | 0.06–0.7 | 0.01 | 0.04 | 0.004–0.52 | 0.01 |
CKD | 9.4 | 2.63–33.6 | <0.001 | 95.3 | 3.46–2626.97 | 0.007 |
Presence of Q wave in 2 contiguous leads | 5.16 | 1.52–17.56 | 0.009 | 626 | 5.81–67 452.8 | 0.007 |
Volume of contrast, per 1 ml | 1.01 | 1.00–1.02 | 0.04 | 1.03 | 1.004–1.051 | 0.02 |
A comparison between the youngest patients (<35 years; n = 25) and the patients aged 35 years or older (n = 196) is presented in Supplementary material, Table S1. The youngest patients were shown to be at a higher risk of death (16% vs 6.1%; P = 0.07), less often had classic MI (56% vs 87.8%; P <0.001), and were less often subjected to PCI (72% vs 87%; P = 0.047), as compared with the individuals aged 35 years or older. Moreover, the youngest group was twice more likely to be hospitalized in the intensive care unit (ICU) or cardiac ICU (CICU) (32% vs 15.4%; P = 0.04) and had less pronounced traditional cardiovascular risk factors (lower prevalence of smokers and lower TC and triglyceride levels).
Discussion
The research on MI in young individuals is significant in the current era of preventive cardiology. While our study is not the first paper on MI in young adults in Poland, its novelty stems from the fact that it encompasses multiple variables, providing in‑depth clinical characteristics of these patients, including data regarding follow‑up and qualification for the MC‑AMI rehabilitation program.
The results of our study should be confronted with the most recent review on this topic, by Sood et al,7 which covers predominantly research papers published over 5 years ago. The findings of our study are consistent with previous reports suggesting that men are more likely to experience MI at a young age; however, female sex is one of the all‑cause mortality predictors.16 This may be due to the fact that women more often postpone seeking medical help after the onset of symptoms; moreover, they present more frequently with a variety of nonchest pain symptoms, such as epigastric symptoms, palpitations, dyspnea, anxiety, pain or discomfort in the jaw, neck, arms, or between the shoulder blades. Both female patients and health care providers were less likely to link the abovementioned prodromal symptoms with MI, which resulted in women undergoing less intensive evaluation and treatment for chest pain.17,18
To date, 2 Polish studies have examined the prevalence of MI in the young population.19,20 Zasada et al19 performed a retrospective study based on the data from the National Registry of Procedures of Invasive Cardiology (ORPKI) in the years 2014–2017. The study analyzed patient clinical characteristics and detailed periprocedural data, without follow‑up.19 The study by Trzeciak et al20 encompassed historical data from the years 2009–2013, when complementary diagnostic methods (IVUS, FFR, and OCT), new antiplatelet agents, and CR via the MC‑AMI program were not commonly implemented.
Our young population was burdened with traditional CAD risk factors—smoking, hyperlipidemia, and hypertension; the first 2 occurred even more frequently than in the older population and concerned a majority of the younger patients. A higher prevalence of smokers in the younger population is in line with a recent paper by Bujak et al.21 Other concomitant diseases were dominant in the older population, which is in line with previous research papers.7,22 In our study, the prevalence of smoking, hyperlipidemia, and diabetes in the younger group was higher than in the study by Zasada et al19; however, it was comparable to the prevalence noted by Trzeciak et al.20 These results can be compared with the findings for the young population (<45 years) of the VALIANT (Valsartan in Acute Myocardial Infarction) trial,23 which included patients from 24 countries. While hypertension and diabetes showed little difference, the Polish population was more frequently burdened with hyperlipidemia (43.1% vs 57.5%). Interestingly, similar results for hyperlipidemia were obtained by Matsis et al.22 This study included a population of New Zealanders aged 50 years or younger, of whom 27.3% were of non‑European ethnicity. The people of Maori or Pacific Island descent were at a higher risk of suffering from MI at a young age.22
In the youngest subgroup (<35 years), we observed a higher prevalence of nonclassic MI, which is in line with existing studies.24 Despite less pronounced traditional cardiovascular risk factors, this group had a higher likelihood of ICU/CICU hospitalization and death, which may be due to symptom misinterpretation and delayed medical help. Another possible reason is the higher risk of developing SCA and life‑threatening arrhythmias.25
Young age is an established protective factor against long‑term mortality; however, half of the deaths in our study occurred in the hospital. This may be due to the fact that the younger group more often presented with STEMI than NSTEMI (53.8% vs 45.7%), which is in line with other publications,19,20 and may translate into a large infarct size and higher frequency of hemodynamic disturbances.26,27 Nevertheless, the ECG sensitivity in diagnosing total coronary artery occlusion varies depending on the stenosis location, being the highest for the left anterior descending artery and the lowest for the circumflex artery.27 This raises a question about the accuracy of the differentiation between NSTEMI and STEMI.
Another factor predicting mortality was reduced eGFR, which is consistent with existing literature. Blood urea nitrogen and eGFR are markers of renal function, reflecting the neurohormonal and cardiorenal balance. While chronic kidney disease is a well‑known risk factor for cardiovascular disease, kidney dysfunction is also a predictor of fatal and nonfatal adverse cardiovascular outcomes.28,29 In our study, higher volume of contrast in the group aged up to 45 years was associated with increased all‑cause death risk. Higher contrast medium volume is not only a well‑established risk factor for contrast‑induced nephropathy but it also has a potential to affect the cardiac output, especially in patients in whom its excretion is impaired, resulting in cardiogenic shock, heart failure, and in‑hospital death.30,31 In our study, the use of a higher volume of contrast media was associated with the classic type of MI in the group aged up to 45 years. Younger patients may require higher volumes of contrast media due to a more frequent need for a complex PCI, embracing complex lesions, chronic total occlusions, and bifurcations.31
The present study confirmed the previous findings that participation in MC‑AMI lowers the all‑cause mortality rate. The program encompasses interventional therapy in the acute phase of MI, CR, complete revascularization, and implantable cardioverter‑defibrillator implantation, followed by outpatient cardiologic care, resulting in a reduced risk of major adverse cardiac events (MACEs).13 The percentage of MC‑AMI participants was 1.7‑fold higher in the younger group, which highlights the necessity to seek the potential reasons for lower participation rate in the older group. This may be due not only to multiple concomitant diseases but also reluctance toward participation in such programs, stressing the need for improvement in patient‑doctor communication. Reduced LVEF is another well‑established prognostic marker of MI‑related mortality.13,32 The patients qualified for CR presented with improved LVEF (mean [SD], 45.7% [11.6%] vs 53.4% [5.4%]), which is consistent with the findings of Wita et al.13
The presence of Q wave was associated with a higher all‑cause death risk in the patients aged 45 years or younger. Of note, there used to be a differentiation between Q‑wave and non–Q‑wave MI; however, this division has been replaced by the STEMI vs NSTEMI classification, which restricts comparability of our findings with those of previous studies. The main limitation of our results is the lack of Q‑wave equivalent determination, such as high R‑wave in the leads V1 and V2, R‑wave reduction in the leads V3 and V4, change of cardiac axis to left axis deviation, low R‑wave voltages, notching of the RS complexes, as well as narrowing of the R‑wave in the precordial leads.27
Both in‑hospital (3.6% vs 1.6%) and overall mortality (7.2% vs 1.1%) were higher in our study than in the work by Trzeciak et al.20 This may come as a surprising result, taking into consideration the overall advancements in cardiology over the past decade. However, there are a few possible explanations. Firstly, our study included patients hospitalized in a single tertiary care center, which could translate into a higher number of critical cases. Secondly, the mean follow‑up time in our study was longer than in the work by Trzeciak et al.20
Our findings regarding the MI etiology are in accordance with prior studies, confirming the heterogeneous pathophysiological background of MI in younger patients, as compared with the older population.7 While patients diagnosed with classic MI more frequently had typical CAD risk factors (arterial hypertension, hyperlipidemia, smoking), the individuals suffering from other types of MI and MI‑mimicking conditions were more likely to have hypothyroidism, autoimmune diseases, or essential thrombocytosis, and to take steroids, both for medical and nonmedical purposes. Surprisingly, we did not find any significant differences between the classic and nonclassic MI groups in terms of recreational drug use. It is notable that past medical history is a vital element of MI background diagnosis, guiding the management into the appropriate direction.
The use of complementary diagnostic methods in our study, such as IVUS, FFR and OCT, was relatively infrequent, presumably because of its real‑world design. This result ties in well with a previous study by Kaziród‑Wolski et al.33 While the number of complementary diagnostic procedures performed in ACS is steadily increasing, as clearly visible when collating the results of our research with those of a study by Zasada et al,19 functionally guided and imaging‑guided PCI is still not very common in Poland, as compared with other countries.34 According to a novel meta‑analysis by Kuno et al,35 functionally guided PCI is associated with MACE and MI risk reduction, as compared with traditional, angiography‑guided PCI. Furthermore, imaging‑guided PCI proved to be superior to angiography‑guided PCI in terms of MACE risk, cardiovascular death, MI, target lesion revascularization, and stent thrombosis, both in ACS and non‑ACS patients.35 This stresses the demand for further implementation of complementary diagnostic methods, especially in the younger population of patients requiring in‑depth evaluation of ambiguous coronary lesions.
Our study included patients discharged as MINOCA, either referred for further diagnosis in the outpatient care or with a completed diagnostic process, where the underlying cause could not be identified. Apart from the need for further functionally guided and imaging‑guided PCI implementation to detect SCAD or plaque erosion, there is a need for more frequent CMR use during hospitalization.36 CMR imaging facilitates differentiation between myocarditis, MI, and takotsubo cardiomyopathy, which is especially important for patients with MINOCA, who present with CAD risk factors despite the absence of obstructive CAD.36-39 Adequate management of MI and MI‑mimicking conditions requires establishing the right diagnosis, which affects patient treatment and prognosis.
Limitations
Our study has certain limitations. First, the tertiary single‑center design of the research introduces a significant selection bias. Second, the mean follow‑up was less than 2 years, which could limit all‑cause mortality. Third, the study follow‑up did not embrace other vital end points, such as recurrent MI, stroke, or hospitalization for heart failure. Fourth, data on etiology and procedural variables were available only in the young patients (≤45 years). Fifth, the diagnostic workup in 6 patients was suboptimal (lack of CMR or intravascular imaging), which led to a diagnosis of MINOCA at discharge.
Conclusions
Patients with MI aged 45 years or younger have a lower risk of death than older patients, and frequently present with atypical pathophysiology of MI. The protection conferred by young age proves insufficient when confronted by CAD risk factors, encompassing concomitant diseases and cigarette smoking. The heterogeneous pathophysiology of MI in young adults, especially in women, necessitates the implementation of novel diagnostic techniques. Extensive diagnostic process should encompass the use of CMR and intravascular imaging so as to establish the proper diagnosis and enable adequate treatment, improving the prognosis of young patients.
- Choudhury L, Marsh JD. Myocardial infarction in young patients. Am J Med. 1999; 107: 254‑261. | Crossref
- Egred M, Viswanathan G, Davis GK. Myocardial infarction in young adults. Postgrad Med J. 2005; 81: 741‑745. | Crossref
- Lacey MJ, Raza S, Rehman H, et al. Coronary embolism: a systematic review. Cardiovasc Revasc Med. 2020; 21: 367‑374. | Crossref
- Kanagala SG, Gupta V, Dunn GV, et al. Narrative review of anomalous origin of coronary arteries: pathophysiology, management, and treatment. Curr Cardiol Rev. 2023; 19: 50‑55. | Crossref
- Shibata T, Kawakami S, Noguchi T, et al. Prevalence, clinical features, and prognosis of acute myocardial infarction attributable to coronary artery embolism. Circulation. 2015; 132: 241‑250. | Crossref
SUPPLEMENTARY MATERIAL
ARTICLE INFORMATION