How to improve cardiovascular risk assessment in type 1 diabetes: the role of vascular age and arterial stiffness
1,2 ,
Key words: arterial stiffness, carotid intima-media thickness, heart disease risk factors, type 1 diabetes mellitus
,
Key words: arterial stiffness, carotid intima-media thickness, heart disease risk factors, type 1 diabetes mellitus

 CC BY 4.0
How to improve cardiovascular risk assessment in type 1 diabetes: the role of vascular age and arterial stiffness
Introduction: Cardiovascular disease is the leading cause of mortality in individuals with type 1 diabetes mellitus (T1DM). Traditional cardiovascular risk (CVR) models may underestimate risk in this population, especially in high‑risk countries. Vascular age (VA) and arterial stiffness (AS) are emerging as potential markers for improving CVR assessment.
Objectives: This study investigated the association between VA, AS, and the modified steno type 1 risk engine (ST1RE) score in adults with T1DM.
Patients and methods: The study included 109 T1DM adults, aged 18–50 years, with at least 5 years of disease duration. None had been diagnosed with cardiovascular disease or hypertension. VA was calculated using carotid intima‑media thickness, while AS was assessed via 24‑hour measurements of aortic pulse wave velocity (PWV). We compared the standard ST1RE score, based on chronological age, with a modified ST1RE score based on VA.
Results: Median (interquartile range [IQR]) age of the study participants was 32.4 (25.5–38.6) years and their diabetes duration was 14 (10–20) years. Using VA in the modified ST1RE score, we reclassified 32.1% of the participants into a higher CVR category. The median (IQR) CVR for the modified ST1RE was 9.68% (4.61%–20.08%), as compared with 4.74% (3.24%–8.12%) using the standard score. The modified ST1RE score was positively associated with PWV (odds ratio, 2.37; 95% CI, 1.46–3.84; P = 0.004) after adjustment for sex, body mass index, and at least 1 diabetic complication.
Conclusions: Implementing VA and AS in clinical practice could improve risk assessment in T1DM individuals, especially in high‑risk populations. Further validation in larger cohorts is necessary.
What's new?
This study highlights the potential of vascular age (VA) and arterial stiffness (AS) as new tools for improving cardiovascular risk (CVR) assessment in individuals with type 1 diabetes mellitus. Traditionally, CVR is calculated using models that may underestimate the risk, especially in younger people or individuals without hypertension. Integrating VA, derived from carotid artery measurements, and AS, assessed via pulse wave velocity, into existing CVR tools can enhance the accuracy of risk assessment. This approach can help clinicians identify high‑risk individuals earlier, potentially guiding more timely interventions for preventing cardiovascular complications. Future research could focus on validating these findings across broader populations and exploring how these tools might influence treatment decisions.
Introduction
Among people with type 1 diabetes mellitus (T1DM), cardiovascular disease (CVD) stands as the leading cause of mortality.1 Nonobstructive coronary artery disease is the most common coronary complication among individuals with long‑lasting T1DM.2 Steno type 1 risk engine (ST1RE) is a prediction model based on an analysis of 4306 adults with T1DM for estimating the risk of the first fatal or nonfatal CVD event using some of the variables specific for T1DM, such as diabetes duration, albuminuria, and glycated hemoglobin (HbA1c).3 ST1RE calculator was recommended to assess cardiovascular risk (CVR) in people with T1DM according to the 2023 European Society of Cardiology (ESC) Guidelines for the management of cardiovascular disease.4
Arterial stiffness (AS), that is progressing rigidity of the arterial walls, is an early predictor of cardiovascular complications and cardiovascular mortality among people with T1DM.5-7 These individuals have higher pulse wave velocity (PWV) than healthy controls of the same age.7 The gold standard parameter of AS assessment is PWV.8
Another parameter used in CVR evaluation is carotid artery intima‑media thickness (cIMT) measured using ultrasonography.9 Based on the Diabetes Control and Complications Trial (DCCT) / Epidemiology of Diabetes Interventions and Complications (EDIC) cohort, cIMT was weakly related to subsequent coronary artery events, but the association did not remain significant after adjusting for coexistent traditional CVR factors.10 However, using cIMT, we can calculate vascular age (VA) based on the results obtained by Engelen et al.11 The use of VA may contribute to the identification of high CVD risk in T1DM.12
We aimed to investigate the association between VA, AS, and ST1RE categories in people with T1DM. To our knowledge, this is the first study to use VA in combination with the ST1RE model to assess CVR in individuals with T1DM.
Patients and methods
Data collection
The study participants were consecutively invited to our research from February 2019 to September 2024. They were all T1DM patients living in the Greater Poland Voivodeship who reported for a check‑up visit at our unit. The inclusion criteria were: age 18–50 years and antibody‑confirmed T1DM lasting for at least 5 years.We excluded individuals with CVD, plaques in the carotid artery, hypertension, on antihypertensive therapy, with unstable rheumatological disorders, alcohol abuse, and diagnosed malignancy.
Each participant completed a questionnaire detailing T1DM history, complications, coexisting diseases, and smoking status. Initial assessments included anamnesis, physical examination, and blood pressure (BP) measurements following the 2018 ESC/European Society of Hypertension Guidelines.13 Hypertension was diagnosed in individuals with a history of hypertension or in case of systolic BP values greater than or equal to 140 mm Hg and / or diastolic BP values greater than or equal to 90 mm Hg on 2 different days.13
Anthropometric parameters (weight, height, body mass index [BMI]) were recorded, defining obesity (BMI ≥30 kg/m2) and overweight (25 kg/m2 ≤BMI <30 kg/m2). Fasting blood samples were collected to determine lipid profile, and the levels of thyroid‑stimulating hormone, creatinine, transaminases, C‑reactive protein, and HbA1c levels.
Diabetic kidney disease was diagnosed in participants with estimated glomerular filtration rate (eGFR) was below 60 ml/min/1.73 m2 and / or albumin‑to‑creatinine ratio (ACR) at least 30 mg/g for longer than 3 months in the absence of signs of other primary causes of kidney injury.14 eGFR was calculated using the Chronic Kidney Disease Epidemiology Collaboration equation.15 Fundoscopy after mydriasis was performed to detect retinopathy. Neuropathy was assessed using touch, vibration, and temperature sensation tests.16
We used the ST1RE calculator, a standard ST1RE score with chronological age, to estimate a 10‑year risk for future CV events. ST1RE is based on 10 variables (age, sex, T1DM duration, smoking, systolic blood pressure [SBP], the levels of low‑density lipoprotein cholesterol [LDL‑C], HbA1c, and eGFR, albuminuria, and physical activity), and patients are categorized into low (<10%), moderate (10%–19.9%) or high CVR (≥20%) group.3
The intima‑media thickness of the right common carotid artery (CCA) was determined using the GE Vivid S6 Ultrasound Machine (GE Healthcare, Chicago, Illinois, United States) with the 2.4 MHz–10‑MHz Linear Array Probe (GE Healthcare). A single experienced cardiologist‑investigator performed all carotid ultrasounds according to the 2012 Mannheim consensus.17. The measurement was made at least 5 mm from the bulb, on a straight section of 10 mm of the right CCA.17 In arteries, longitudinal projection images were captured at 16 frames per second for 5 seconds. Carotid intima‑media thickness (cIMT) of the far wall 1 cm proximal from the bulb was calculated automatically with the Carotid Analyzer for Research (CAD 5) program (Medical Imaging Applications LLC, Coralville, Iowa, United States). The result was the average of 100 automated computer measurements with a high accuracy of 0.01 mm.
Based on cIMT, VA was counted using VA calculator (https://www.quipu.eu/vascular‑age‑calculator) created by Engelen et al.11 Then, we used VA instead of chronological age to estimate the modified ST1RE score.11,17 Other variables were the same as in the standard ST1RE score.
Aortic PWV, aortic SBP, brachial SBP, brachial DBP, and heart rate were measured with the noninvasive brachial oscillometric device Arteriograph 24 (TensioMed Ltd., Budapest, Hungary). The measurements were validated with invasive and noninvasive AS assessment methods.18 The device was programmed using TensioWin software (TensioMed Ltd.) to make a measurement every 30 minutes daily and every 1 hour nightly for the next 24 hours. The participants were instructed to start manual measurements in the case of failed automatic measurements. The device performs a series of measurements within 8 seconds and counts the average value and standard deviation. We rejected all results where mean (SD) PWV 8 s exceeded 1 m/s.19 We assumed that successful measurement meant at least 70% of available BP results.
Ethics
This study is based on data from the PARADISE T1DM Study (Poznań Atherosclerosis in Adult Patients with Long‑term Type 1 Diabetes Mellitus Study)20 conducted according to the decision of the Ethical Committee of Poznan University of Medical Sciences (67/19). Our study conforms to the principles outlined in the Declaration of Helsinki. Written informed consent was obtained from all the participants before inclusion.
Statistical analysis
We used the custom code of the R‑programming language, version 3.6.1 (R Foundation for Statistical Computing, Vienna, Austria) for statistical analysis. The categorical data are presented as numbers (percentage), while the numerical data, as medians (interquartil range [IQR]). We divided the study group based on CVR categories according to the modified ST1RE. The groups were compared using the χ2 test and the analysis of variance (ANOVA) Kruskal‒Wallis test with post hoc Dunn Bonferroni analysis.
We correlated the ST1RE scores (both standard and modified), cIMT, and VA with hemodynamic parameters and other factors, such as general characteristics, including age and diabetes duration, using the Spearman rank correlation.
We performed logistic regression to analyze factors associated with CVR categories based on the modified ST1RE. The dependent variable was high risk vs low and moderate risk according to the modified ST1RE.
First, we performed a univariable logistic regression analysis where all independent variables were analyzed. Then, we included the variables associated with the dependent variable in the univariable model with P value below 0.05. The variables were checked for collinearity. Finally, we performed backward stepwise selection based on the Akaike information criterion to choose the best‑fitted multivariable model. A P value below 0.05 was considered significant.
Results
We initially invited 140 participants to take part in our study. However, 12 of them were excluded due to insufficient data from the questionnaires, 3 due to hypothyroidism, 2 due to CRP levels exceeding 5 ng/ml, 10 due to insufficient hemodynamic measurement data, and 4 for not meeting our quality control criteria. Finally, we investigated a total of 109 adults at a median (IQR) age of 32.4 (25.5–38.6) years and diabetes duration of 14 (10–20) years (Table 1).
Feature | Value |
Data are presented as median (interquartile range) or number (percentage).
Abbreviations: ACR, albumin‑to‑creatinine ratio; BMI, body mass index; cIMT, carotid intima‑media thickness; CRP, C‑reactive protein; DBP, diastolic blood pressure; eGFR, estimated glomerular filtration rate; EASD, European Association for the Study of Diabetes; ESC, European Society of Cardiology; Hb, hemoglobin; HbA1c, glycated hemoglobin; HDL‑C, high‑density lipoprotein cholesterol; LDL‑C, low‑density lipoprotein cholesterol; PWV, pulse wave velocity; SBP, systolic blood pressure; ST1RE, steno type 1 risk engine; T1DM, type 1 diabetes mellitus; VA, vascular age | |
General parameters | |
Men | 60 (55) |
Age, y | 32.4 (25.5–38.6) |
SBP, mm Hg | 125 (120–136) |
DBP, mm Hg | 80 (76–86) |
BMI, kg/m2 | 25.8 (22.4–27.6) |
Current smoker | 31 (28.4) |
Former smoker | 28 (25.7) |
T1DM duration, y | 14 (10–20) |
Obesity | 9 (8.3) |
Overweight | 50 (45.9) |
Treatment | |
Insulin pump | 31 (28.4) |
Daily dose of insulin, U/kg body weight | 0.59 (0.51–0.69) |
Diabetic complications | |
At least 1 diabetic complication | 47 (43.1) |
Diabetic retinopathy | 21 (19.3) |
Diabetic proliferative retinopathy | 9 (8.3) |
Diabetic kidney disease (A1, A2, G1, G2) | 2 (1.8) |
Peripheral diabetic neuropathy | 35 (32.1) |
Laboratory results | |
HbA1c, % | 7.8 (7–8.9) |
Hb, g/dl | 14.5 (13.3–15.5) |
Potassium, mmol/l | 4.3 (3.99–4.53) |
Total cholesterol, mmol/l | 176 (160–198) |
LDL‑C, mmol/l | 93 (76–113) |
HDL‑C, mmol/l | 64 (54–74) |
Triglycerides, mmol/l | 83 (66–119) |
Non–HDL‑C, mmol/l | 114 (92–138) |
Creatinine, µmol/l | 0.83 (0.76–0.97) |
eGFR, ml/min/1.73 m2 | 97 (82.6–108.9) |
ACR, mg/g | 3 (3–6) |
CRP, mg/l | 1.25 (0.69–2.61) |
24‑hour hemodynamic parameters | |
Brachial SBP, mm Hg | 126.2 (119.9–134.2) |
Brachial DBP, mm Hg | 73.8 (68.7–78) |
Heart rate, bpm | 74.6 (68.3–81) |
Aortic SBP, mm Hg | 117.3 (110–125.2) |
PWV, m/s | 7.85 (7.07–8.73) |
Cardiovascular risk assessment | |
Modified ST1RE score, % | 9.68 (4.61–20.08) |
Standard ST1RE score, % | 4.74 (3.24–8.12) |
cIMT, mm | 0.54 (0.49–0.61) |
VA, y | 44 (34–56) |
HbA1c ≤6.5% | 11 (10.9) |
Met LDL‑C ESC/EASD 2019 criteria | 21 (19.3) |
VA was higher than the chronological age among 92 participants (84.4%), while the median (IQR) difference was 13.4 (4.1–23.5) years. Most of them had elevated HbA1c level and only 11 participants (10.9%) met the criteria for diabetes control (HbA1c ≤6.5%). All individuals were treated with intensive insulin therapy. Thirty‑one participants (28.4%) used insulin pumps, and the others used insulin pens. The patients with overt hypertension were excluded, but 56 oarticipants (51.4%) had elevated peripheral BP on the 24‑hour measurement.
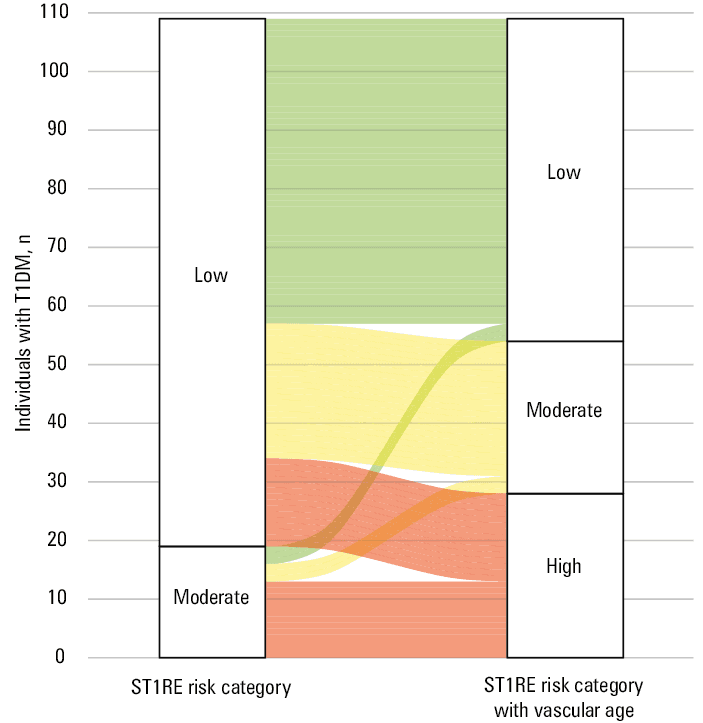
Based on the standard ST1RE score, 90 individuals (82.6%) were at a low risk od CDV (<10%), and only 19 individuals (17.4%) were at a moderate risk (10%–20%). No participant was at a high risk. We also calculated the modified ST1RE with VA instead of the chronological age, which yielded 55 participants (50.5%) with low risk, 26 (23.9%) with moderate risk, and 28 (25.7%) with high risk (Table 2). It means that using VA instead of the chronological age moved 35 individuals (32.1%) to a higher‑risk category (Figure 1). The median (IQR) 10‑year CV event risk was 9.68% (4.61%–20.08%), almost 2‑fold higher than the standard ST1RE value of 4.74% (3.24%–8.12%).
Parameter | Low risk (n = 55; 50.5%) | Moderate risk (n = 26; 23.9%) | High risk (n = 28; 25.7%) | P value |
Data are presented as median (interquartile range) or number (percentage).
P values <0.05 were considered significant.
Abbreviations: see Table 1 | ||||
General characteristics | ||||
Men | 22 (40) | 20 (76.9) | 18 (64.3) | 0.002 |
Age, y | 26.9 (21.7–33.7) | 32.5 (27.5–38.5) | 41 (36.2–45.7) | <0.001 |
SBP, mm Hg | 125 (120–133.7) | 128.5 (120–139) | 131.5 (121.3–138.5) | 0.17 |
DBP, mm Hg | 80 (75–85) | 80 (75–80) | 80.5 (75.5–88) | 0.24 |
T1DM duration, y | 14 (9–18) | 12 (10–18) | 20.5 (13–28.5) | 0.01 |
BMI, kg/m2 | 24.1 (21.4–27.2) | 26 (23.1–28.1) | 26.4 (24.2–28) | 0.04 |
Current smoker | 13 (23.6) | 9 (34.6) | 9 (32.1) | 0.52 |
Former smoker | 13 (23.6) | 5 (19.2) | 10 (35.7) | 0.34 |
Treatment | ||||
Insulin pump | 23 (41.8) | 7 (26.9) | 1 (3.6) | 0.002 |
Daily dose of insulin, U/kg body weight | 0.62 (0.51–0.7) | 0.61 (0.49–0.73) | 0.55 (0.5–0.6) | 0.14 |
Diabetic complications | ||||
At least one diabetic complication | 19 (34.5) | 10 (38.5) | 18 (64.3) | 0.03 |
Diabetic retinopathy | 5 (9.1) | 4 (15.4) | 12 (42.9) | 0.003 |
Diabetic proliferative retinopathy | 3 (5.5) | 1 (3.8) | 5 (17.9) | 0.1 |
Diabetic kidney disease (A1, A2, G1, G2) | 0 | 0 | 2 (7.1) | 0.053 |
Peripheral diabetic neuropathy | 14 (25.5) | 8 (30.8) | 13 (46.4) | 0.15 |
Laboratory results | ||||
HbA1c, % | 7.7 (6.9–8.9) | 7.6 (6.8–8.5) | 7.9 (7.2–9.3) | 0.42 |
Potassium, mmol/l | 4.15 (3.91–4.49) | 4.4 (4.13–4.54) | 4.31 (4.19–4.63) | 0.03a |
Total cholesterol, mg/dl | 176 (159–198) | 171.5 (155–190) | 181 (162.5–200) | 0.77 |
LDL‑C, mmol/dl | 2.43 (2.1–2.85) | 2.4 (1.84–2.95) | 2.35 (1.95–3) | 0.94 |
HDL‑C, mmol/dl | 1.63 (1.37–1.97) | 1.56 (1.29–1.84) | 1.72 (1.5–1.9) | 0.46 |
Triglycerides, mg/dl | 0.93 (0.69–1.35) | 1.05 (0.87–1.44) | 0.89 (0.77–1.38) | 0.5 |
Non–HDL‑C, mg/dl | 3.03 (2.49–3.57) | 2.99 (2.30–3.59) | 2.85 (2.36–3.63) | 0.99 |
Creatinine, mg/dl | 73.4 (68.9–82.3) | 78.7 (68.9–90.2) | 74.0 (63.7–85.7) | 0.32 |
eGFR, ml/min/1.73 m2 | 97.5 (88–108.5) | 99.5 (77.4–111.5) | 90.8 (79.7–105.3) | 0.33 |
ACR, mg/g | 3 (3–5) | 3 (2–5) | 6 (3–15.5) | 0.02 |
CRP, mg/dl | 1.08 (0.66–2.7) | 1.15 (0.6–2.69) | 1.6 (0.81–2.57) | 0.55 |
24‑hour hemodynamic parameters | ||||
Brachial SBP, mm Hg | 123.9 (115.4–132.4) | 131.5 (124–137) | 128.1 (125–141.2) | 0.01 |
Brachial DBP, mm Hg | 71 (65.8–75.2) | 75.3 (70–79.4) | 76.4 (71.1–78.7) | 0.003 |
Heart rate, min | 77 (70–83.6) | 71.5 (65–77.7) | 71.8 (67.2–80.4) | 0.12 |
Aortic SBP, mm Hg | 112 (106–120) | 118.7 (112–126.6) | 120.9 (116.7–130.2) | 0.004 |
PWV, m/s | 7.44 (6.7–8.05) | 8.24 (7.38–8.79) | 8.71 (7.72–9.62) | 0.003 |
Cardiovascular risk assessment | ||||
cIMT, mm | 0.49 (0.45–0.52) | 0.59 (0.55–0.6) | 0.67 (0.64–0.71) | <0.001 |
VA, y | 34 (26–38) | 51 (44–53) | 70 (62–77) | <0.001 |
Standard ST1RE score, % | 3.74 (2.56–4.85) | 4.74 (3.66–6.97) | 9.48 (7.38–13.86) | <0.001 |
Modified ST1RE score, % | 4.61 (3.31–7.5) | 14.2 (11.6–16.1) | 28 (24.8–45.9) | <0.001 |
HbA1c ≤6.5% | 5 (9.1) | 3 (11.5) | 3 (10.7) | 0.94 |
Met LDL‑C ESC/EASD 2019 criteria | 11 (20) | 6 (23.1) | 4 (14.3) | 0.7 |
Abbreviations: see Table 1
The participants were stratified into 3 categories using the modified ST1RE score (Table 2). Higher risk was associated with male sex, older age, and longer T1DM duration. Diabetic complications, including retinopathy, were more prevalent in the high‑risk group than in the moderate- and low‑risk groups. Cardiovascular parameters, such as aortic PWV, cIMT, and VA, progressively worsened across the risk categories, with marked differences observed (P <0.001). Additionally, the ACR was elevated in the high‑risk group (P = 0.02).
The correlation results are shown in Table 3. PWV was positively related to cIMT, VA, chronological age, diabetes duration, standard ST1RE score, and modified ST1RE score. The standard and modified ST1RE scores were positively associated with cIMT, VA, and PWV.
Variable | IMT | VA | Age | HbA1c | BMI | T1DM duration | PWV | Modified ST1RE | Standard ST1RE |
Abbreviations: see Table 1 | |||||||||
IMT, mm | – | – | – | – | – | – | – | – | – |
VA, y | 0.96 | – | – | – | – | – | – | – | – |
Age, y | 0.58 | 0.6 | – | – | – | – | – | – | – |
HbA1c, % | 0.17 | 0.17 | 0.28 | – | – | – | – | – | – |
BMI, kg/m² | 0.27 | 0.25 | 0.24 | –0.11 | – | – | – | – | – |
T1DM duration, y | 0.21 | 0.25 | 0.31 | –0.15 | 0.1 | – | – | – | – |
PWV, m/s | 0.38 | 0.39 | 0.52 | –0.03 | 0.12 | 0.32 | – | – | – |
Modified ST1RE 10‑year risk, % | 0.9 | 0.93 | 0.58 | 0.04 | 0.26 | 0.26 | 0.46 | – | – |
Standard ST1RE 10‑year risk, % | 0.49 | 0.5 | 0.80 | 0.09 | 0.17 | 0.34 | 0.59 | 0.67 | – |
The univariable logistic regression analysis demonstrated 11 variables associated with the high‑risk category according to the modified ST1RE. The final multivariable logistic regression model showed that PWV was positively associated with high CVR based on the modified ST1RE score (OR, 2.37; 95% CI, 1.46–3.84; P = 0.004). The association was independent of sex, BMI, and at least one diabetic complication (Table 4).
Variable | OR (95% CI) | P value |
P values <0.05 were considered significant.
Abbreviations: OR, odds ratio; others, see Table 1 | ||
Men | 1.76 (0.62–4.96) | 0.29 |
At least 1 diabetic complication | 3.34 (1.2–9.31) | 0.02 |
PWV, m/s | 2.37 (1.46–3.84) | 0.004 |
BMI, kg/m2 | 1.17 (0.997–1.37) | 0.055 |
Discussion
We found that VA was significantly higher than the chronological age in T1DM adults without overt hypertension and CVD. Implementing VA to the ST1RE score moved 32.1% of the participants to a higher‑risk category. Modified ST1RE was positively related to PWV, independently of the presence of diabetic complications, current smoking, BMI, and sex.
VA provides an estimation of the physiological age of the vasculature.11,21 Our study demonstrated a positive association between VA based on the cIMT and ST1RE scores, indicating that higher VA was associated with a higher CVR, which corresponds to earlier studies.22 Viñals et al23 demonstrated that both cIMT and plaque presence increased in tandem with rising ST1RE scores. Early vascular aging develops even in normotensive children with T1DM.24,25 Our findings are in line with previous studies that have shown significantly elevated cIMT in individuals with T1DM, as compared with healthy controls.9 In past studies, VA was calculated using CVR models including the Framingham Risk Score and the Systematic Coronary Risk Evaluation (SCORE) which skip risk factors specific to T1DM.26,27 While cIMT may not significantly improve the prediction of CVR when used alone, calculating VA based on cIMT results can enhance the accuracy of CVR assessment.10,28 VA calculated on the basis of cIMT was used instead of chronological age to calculate CVR using the Framingham Risk Score by Jamthikar et al29 but never before using ST1RE.27
While in the T2DM population physicians can assess CVR using the SCORE 2 diabetes calculator, there is still no validated tool to asssess CVR in the Polish T1DM population. Estimated CVR is crucial to making right therapeutic decisions, as in the case of hyperlipidemia treatment and in people without hypertension but with elevated BP.30 McGurnaghan et al31 created a model predicting the 10‑year risk of CVD in T1DM individuals based on the national register in Scotland, externally validated with the Swedish National Diabetes Register. This detailed model includes factors such as diabetic complications, HbA1c, level and diabetes duration, but also social deprivation and average HbA1c level from the last 5 years. The last 2 factors are rarely accessible in Polish T1DM individuals. The second model proposed in the 2023 ESC Guidelines for the management of CVD is ST1RE.4 It was created based on 4306 T1DM adults from Steno Diabetes Center in Gentofte, Denmark. Later, it was validated for the 5‑year risk in Italy, but not for the 10‑year risk.3,4,32 However, Denmark and Scotland are in the low‑risk group, Italy and Sweden are in the moderate‑risk group, and Poland is in the high‑risk group.33 Compared with the 2019 ESC risk classification, ST1RE performs better in predicting cardiovascular events in all risk groups, but it leads to significantly less aggressive statin treatment.34,35
Helmink et al36 introduced the LIFE‑T1D model to estimate both 10‑year and lifetime CVD risk in individuals with T1DM. This new approach, derived from the Swedish National Diabetes Register and externally validated in Danish and United Kingdom cohorts, highlights the importance of longer‑term risk estimates beyond the traditional 10‑year horizon. However, as the authors note, further validations, particularly in high‑risk regions, are necessary before clinical implementation can be widely recommended.36
Therefore, we assume that ST1RE could underestimate CVR in high‑risk countries such as Poland. In our study, based on the standard ST1RE score, the majority of participants were at a low risk despite poor glycemic and lipid control and common diabetic complications, so standard ST1RE did not help to differentiate therapy according to CVR in this group. On the other hand, cIMT in 84.4% of the participants was higher than the mean value for their age, suggesting increased CVR. Implementation of VA calculated based on cIMT in the ST1RE was associated with a higher score and reclassified 32.1% of individuals to a higher‑risk category. Modified ST1RE was positively associated with AS, an established CVR indicator. We need a validated model to adequately assess CVR in people with T1DM in Poland and other high‑risk countries. In the meantime, however, using VA and AS could help make clinical decisions in doubtful situations.
The study group comprised patients with T1DM lasting for but without CVD, with atherosclerosis in CCAs, a family history of early CVD, and previously diagnosed hypertension. Most of them did not meet the target criteria for HbA1c and LDL‑C levels.16,37 However, Kim et al38 found that 32.7% of adolescents with T1DM at the age of 15.4 (2.8) years did not meet the LDL‑Clevel criteria according to the Pediatric and Adolescent Diabetes and American Diabetes Association. According to Szadkowska et al,39 only 25.5% of Polish young adults (aged 18–30 years) achieved the goal of HbA1c level below 6.5%. In the Poznań Prospective Study, only 10% of adults with T1DM achieved an HbA1c level below or equal to 6.5%, and just 6% met their LDL‑C target.40 Lipid target achievement in the Polish general population without T1DM is also poor.41-43
Helleputte et al44 investigated AS and its association with standard ST1RE and ESC/European Association for the Study of Diabetes (EASD) 2019 criteria in a group of 54 participants aged 46 (9.5) years with a mean (SD) T1DM duration of 27 (8.8) years without cardiovascular diseases, but including patients with hypertension and dyslipidemia. Compared with our study group, the participants recruited by Helleputte et al44 were older, with longer diabetes duration, more frequent retinopathy, and diabetic kidney disease, but had similar HbA1c and LDL‑C levels, despite 46.3% of them using statins or other lipid‑lowering drugs. In our group, more participants met the 2019 ESC/EASD criteria for LDL‑C level.44
Interestingly, HbA1c and lipid parameters did not differ significantly across the risk categories, possibly reflecting comparable short‑term metabolic control in all groups. In contrast, vascular changes (as measured by cIMT and VA) may capture the cumulative impact of long‑term exposure.9 Individuals in high and moderate‑risk categories also have lower lipid targets and probably undergo more intensive (nonpharmacological) treatments to meet these goals. LDL‑C target achievement seems to be more relevant than absolute LDL‑C values.45 Although LDL‑C and HbA1c levels were similar across the categories, age (or VA), T1DM duration, smoking status, SBP, and albuminuria varied significantly, suggesting that these factors may more strongly determine ST1RE category in this relatively young T1DM population.
The pathophysiology of AS development in T1DM is multifactorial.7 Chronic hyperglycemia results in the buildup of advanced glycation end products, low‑grade inflammation, endothelial dysfunction, arterial media calcification, and preterm atherosclerosis. The result of this multifactorial process is the thickening of vascular walls, which causes AS.1,7,46 Moreover, it affects other classic CVR factors. The occurrence of hypertension, dyslipidemia, and obesity is significantly higher in people with T1DM than the general population.1,47-49
Our findings demonstrated that AS, as measured by aortic PWV, and VA was positively associated with both ST1RE scores. Llauradó et al50 showed that PWV was positively associated with the standard ST1RE score (Rs = 0.777; P <0.001) and increased with each subsequent ST1RE group. Similar results were obtained by Helleputte et al.44 In our study, the association between PWV and the standard ST1RE score was weaker (Rs = 0.59; P <0.001). This could be due to different methods of PWV measurement, and the low heterogeneity of the study group.44
We excluded individuals with overt hypertension, but more than half of the study group had elevated BP during the 24‑hour measurement. This is in line with the study by Lithovius et al51 who diagnosed masked hypertension in 23% of adolescents with T1DM.
Practical implications
The study explores the relationship between AS, VA, and CVR in young adults with T1DM, an area that has received limited attention in previous research. The study emphasizes the importance of early detection and intervention. Identifying individuals at higher risk at an earlier stage allows for the implementation of preventive measures to mitigate cardiovascular complications.2,3
Limitations
The study was conducted in a relatively small group, which could limit the generalizability of the findings to a broader population of young adults with T1DM. The study design was cross‑sectional, which limited the possibility of establishing causality. To assess the predictive value of a new cardiovascular assessment tool, a follow‑up study should be conducted. Although this research adjusted for several potential confounding factors (sex, current smoking, BMI, presence of diabetic complications), there may still be unmeasured or residual confounding variables that could influence the observed associations. The study primarily focused on surrogate markers (AS, VA) of CVR rather than actual clinical outcomes such as cardiovascular events or mortality. Future studies with long‑term follow‑up and clinical end points are needed to provide stronger evidence of the predictive value of modified ST1RE scores.
Although cIMT and PWV measurements showed potential for refining CVR assessment in T1DM, these methods require additional equipment and specialized training. Their routine application in daily clinical practice remains uncertain before further outcome‑based studies and cost‑effectiveness analyses are carried out.
Conclusions
Among individuals with T1DM without CVD and overt hypertension, AS and VA were positively associated with ST1RE scores (both standard and modified with VA). Implementation of VA instead of the chronological age in ST1RE results in increased CVR scores, which moved many people to a higher‑risk category. This indicated the need for more intensive treatment to reach serum lipids targets, and BP lowering to the target below 120/80 mm Hg. Further prospective studies are needed to evaluate the usefulness of AS and VA in improving CVR prediction.
- Colom C, Rull A, Sanchez‑Quesada JL, Pérez A. Cardiovascular disease in type 1 diabetes mellitus: epidemiology and management of cardiovascular risk. J Clin Med. 2021; 10: 1798. | Crossref
- Konduracka E, Cieślik G, Małecki MT, et al. Obstructive and nonobstructive coronary artery disease in long‑lasting type 1 diabetes: a 7‑year prospective cohort study. Pol Arch Intern Med. 2019; 129: 97‑105. | Crossref
- Vistisen D, Andersen GS, Hansen CS, et al. Prediction of first cardiovascular disease event in type 1 diabetes mellitus: the steno type 1 risk engine. Circulation. 2016; 133: 1058‑1066. | Crossref
- Marx N, Federici M, Schütt K, et al. 2023 ESC Guidelines for the management of cardiovascular disease in patients with diabetes. Eur Heart J. 2023; 44: 4043‑4140.
- Tougaard NH, Theilade S, Winther SA, et al. Carotid‐femoral pulse wave velocity as a risk marker for development of complications in type 1 diabetes mellitus. J Am Heart Assoc. 2020; 9: e017165. | Crossref
ARTICLE INFORMATION