Quantitative stress perfusion cardiovascular magnetic resonance: clinical implications for patients with suspected myocardial ischemia
Key words: adenosine stress perfusion, cardiovascular magnetic resonance, coronary artery disease, quantitative perfusion

 CC BY 4.0
Quantitative stress perfusion cardiovascular magnetic resonance: clinical implications for patients with suspected myocardial ischemia
Introduction: Recent technical advances in stress perfusion cardiovascular magnetic resonance (CMR) imaging allow for myocardial blood flow (MBF) quantification (quantitative perfusion CMR [QP CMR]). However, clinical utility of QP CMR, as compared with conventional grayscale qualitative assessment (QA), is unknown.
Objectives: The study aimed to compare the clinical conclusions on ischemia detection derived from QA of conventional grayscale stress perfusion CMR images and QP CMR in a real‑world population of patients with suspected myocardial ischemia.
Patients and methods: This study retrospectively analyzed 101 patients with suspected myocardial ischemia referred for adenosine stress perfusion CMR imaging. QA of grayscale first‑pass perfusion CMR was performed by level 3 CMR experts. In QP assessment, stress and rest MBF (ml/g/min) were calculated for automatically determined myocardial segments. Each patient and coronary territory were classified by both QA and QP mapping, in a blind manner, as either ischemic or nonischemic.
Results: QP assessment classified more coronary territories as ischemic than QA (46% vs 17%; P <0.001). In the per‑patient analysis, QP analysis identified myocardial ischemia in 64 patients (63%), and QA in 40 (40%; P <0.001). Ischemia was diagnosed by QA but not by QP analysis in 7% of the patients (QA+/QP–). In 31% of the patients, QP assessment established a new diagnosis of myocardial ischemia (QA–/QP+).
Conclusions: QP CMR detects more ischemic coronary territories than QA and holds promise for identifying cases of myocardial ischemia that may be overlooked by QA alone in a real‑world patient population.
What's new?
This is the first real‑world patient population study to compare the clinical conclusions on ischemia detection derived from conventional grayscale qualitative assessment of stress perfusion cardiovascular magnetic resonance (CMR) imaging and quantitative perfusion CMR in patients with suspected myocardial ischemia. The study demonstrates that quantitative perfusion CMR identifies more ischemic coronary territories and reveals potential cases of myocardial ischemia that may be missed by qualitative assessment alone. Therefore, in a subset of patients, quantitative perfusion CMR may lead to different clinical conclusions than the conventional qualitative approach. This could significantly alter patient management and warrants further investigation in larger clinical trials.
Introduction
Stress perfusion cardiovascular magnetic resonance (CMR) imaging is an established accurate and noninvasive method for detection of myocardial ischemia in patients with suspected or known coronary artery disease (CAD).1-3 CMR has numerous strengths and advantages over other imaging modalities, including high spatial and temporal resolution, accurate assessment of myocardial viability and function, cost‑effectiveness, a lack of exposure to ionizing radiation, and an excellent safety profile.4 Moreover, in patients with stable CAD, stress perfusion CMR can have prognostic utility and is capable of effectively guiding coronary revascularization.5-9 Therefore, current guidelines recommend the use of stress perfusion CMR, among other imaging modalities, as the first‑line functional noninvasive diagnostic tool in patients with suspected obstructive CAD.1
Over the last decade, stress perfusion CMR has typically been performed using qualitative assessment (QA) of conventional grayscale first‑pass perfusion images, which provides excellent diagnostic accuracy but is highly dependent on the image reader’s level of training.10 Recent technical advancements have enabled quantification of myocardial blood flow (MBF) through quantitative perfusion CMR (QP CMR). Compared with QA, QP CMR has higher accuracy in identifying the extent of coronary disease in multivessel CAD.10,11 Moreover, QP CMR can effectively distinguish between obstructive 3‑vessel disease and coronary microvascular dysfunction (CMD), as well as detect CMD in cardiomyopathies, including hypertrophic cardiomyopathy.12,13 A recently published retrospective multicenter AQUA‑MBF (Assessment of Quantitative Myocardial Blood Flow Using Stress Cardiac Magnetic Resonance) study14 compared the diagnostic performance of QP CMR–derived MBF and myocardial perfusion reserve (MPR) with QA for detecting obstructive CAD in patients referred for stress CMR who underwent invasive coronary angiography (ICA) or cardiac computed tomography angiography (CCTA) within 6 months. The study showed that QP assessment had high reproducibility and identified obstructive CAD more accurately than QA performed by experienced CMR readers.14 However, the potential differences in clinical diagnosis and conclusions derived from QA and QP analysis in a real‑world patient cohort with suspected myocardial ischemia remain unknown, as QP CMR has not yet been widely integrated into daily clinical practice. Therefore, the aim of this study was to compare the clinical conclusions on ischemia detection derived from conventional grayscale QA and from QP CMR integrated into the workflow for a real‑world population of patients with suspected myocardial ischemia referred for adenosine stress perfusion CMR imaging.
Patients and methods
Study population
This study retrospectively analyzed patients with suspected myocardial ischemia referred to the Amsterdam University Medical Center (UMC), location VUmc, between June 2021 and July 2023 for adenosine stress perfusion CMR imaging. As part of a clinical routine, subsequent referral for ICA was at the discretion of the treating physician, who was aware of the results obtained only from the QA of first‑pass adenosine stress perfusion CMR images. The study complies with the 1964 Helsinki declaration and its later amendments, and was approved by the Medical Ethics Review Committee of the Amsterdam UMC, location VUmc (A2018.397.0001). All patients provided written informed consent to participate.
Cardiovascular magnetic resonance image acquisition
The patients were instructed to refrain from products containing caffeine or xanthine for at least 24 hours prior to the examination. Images were obtained using a 3T whole‑body MR scanner (Magnetom Vida, Siemens Healthcare, Erlangen, Germany). Perfusion imaging was performed using a dual‑bolus gadolinium‑based contrast agent (GBCA) administration scheme.15 After at least 3 minutes of constant intravenous infusion of adenosine at a dose of 140 μg/kg/min, stress arterial input function (AIF) and perfusion images were acquired. AIF images were obtained during intravenous administration of a prebolus of GBCA (DOTAREM, Guerbet, Villepinte, France; 0.5 mmol/ml) at a dose of 0.0075 mmol/kg, speed of 3 ml/s, flushed with 20 ml of saline, while perfusion images were obtained using a main bolus of GBCA (DOTAREM; 0.5 mmol/ml) at a dose of 0.075 mmol/kg, speed of 3 ml/s, flushed with 20 ml of saline.
Perfusion images were acquired using a saturation recovery turbo spoiled gradient echo sequence at every heartbeat over at least 50 beats in 3 parallel short‑axis slices at the basal, mid‑ventricular, and apical levels. The patients were asked to hold their breath for as long as possible. At the beginning of acquisition, 2 proton density–weighted images were obtained at all 3 levels for correcting surface‑coil signal‑intensity inhomogeneity. Typical in‑plane resolution of the myocardial perfusion images was 2.25 × 2.25 mm2, with a slice thickness of 8 mm (repetition time, 2.64 ms; echo time, 1.18 ms; inversion time, 125 ms; flip angle, 12 °; matrix size, 160 × 120), and a 2‑fold acceleration using GRAPPA/T‑pat. Rest AIF and perfusion images were acquired using identical scanning parameters, prebolus and bolus doses, and slice location at least 10 minutes after the end of adenosine administration. Late gadolinium enhancement (LGE) images were acquired 10–15 minutes after rest perfusion imaging, using a 2‑dimensional segmented inversion‑recovery gradient‑echo pulse sequence.
Invasive coronary angiography and fractional flow reserve measurements
ICA was performed using a standard protocol in at least 2 orthogonal directions per evaluated coronary artery segment. Prior to contrast injection, 0.2 ml of intracoronary nitroglycerine was administered to induce epicardial coronary vasodilation. Performing fractional flow reserve (FFR) measurements during ICA was at the discretion of the operator, and according to the currently available guidelines and recommendations. To induce maximal coronary hyperemia, intracoronary adenosine infusion (150 µg) was used. FFR was calculated as the ratio of the mean distal intracoronary pressure to the mean arterial pressure measured by the coronary catheter. Obstructive CAD was defined as FFR lower than or equal to 0.8, or greater than or equal to 70% diameter stenosis (DS) based on visual assessment of ICA if FFR measurements were not performed. Left main lesions were deemed obstructive at a DS greater than or equal to 50% in the absence of FFR measurements. Conversely, nonobstructive coronary artery was defined as an FFR greater than 0.8 or DS below 70%.
Cardiovascular magnetic resonance image analysis
QA of conventional grayscale first‑pass perfusion CMR images was performed on a clinical basis by level 3 CMR experts with over 8 years of experience in CMR. QP analysis was performed separately for research purposes by an operator who was blind to the QA results and patient demographics.
QP CMR postprocessing was performed using the cvi42 software (prototype version 2774, Circle Cardiovascular Imaging Inc., Calgary, Canada), allowing pixel‑wise QP analyses.14,16-18 In summary, the software automatically performed motion correction and corrected for coil‑induced signal inhomogeneities.19,20 To create time–signal intensity (SI) curves, the module detected AIF and myocardial regions of interest (ROIs), as well as key time points during the first‑pass perfusion.21 MBF quantification was based on the central volume principle described by Zierler22 for indicator‑dilution experiments, where the SI observed in the myocardium at each pixel was modeled as the convolution of the AIF and a residual function, for which its amplitude was the scalar MBF value. Therefore, the MBF for each pixel was determined by a process of deconvolution of a pixel’s myocardium SI curves and the AIF curve.16,22-24 Correction of improper automatic delineation of ROIs by the operator was allowed, with careful exclusion of the blood pool areas from the ROIs. Stress and rest MBF (ml/g/min) were calculated for automatically determined myocardial segments according to the American Heart Association (AHA) 16‑segment model. Adequate response to adenosine was determined based on stress MBF in QP analysis, heart rate (HR) increase (≥10 bpm) during adenosine stress, and presence of the splenic switch‑off phenomenon. Patients with insufficient response to adenosine were excluded from the analysis.
In QA, ischemia was defined by a stress perfusion defect extending beyond an area with LGE, or in the absence of LGE, by a perfusion defect involving 2 or more circumferential segments, or involving 2 or more slices. In QP, ischemia was identified when the stress MBF was equal to or less than the previously established cutoff value of up to 1.84 ml/g/min,15 extending beyond regions with LGE on the QP color pixel maps. In the absence of LGE, ischemia was determined by a stress MBF equal to or below the calculated cutoff value, affecting at least 2 circumferential segments or 2 slices on the QP color pixel maps. Accordingly, each patient and coronary territory were classified by both QA and QP analysis as either ischemic or nonischemic. A per‑vessel subanalysis comparing the conclusions derived from QA and QP assessment with the invasive reference standard was performed in only a subset of patients who underwent ICA. The patients with a history of coronary artery bypass grafting (CABG), spontaneous coronary dissection, or those in whom ICA was performed in non–ST‑segment elevation myocardial infarction (NSTEMI) were excluded from the analysis. In the per‑vessel subanalysis, conclusions from QA or QP assessment were classified as correct in 2 scenarios: 1) if a coronary perfusion territory was classified as ischemic on the CMR images, and the corresponding coronary artery had significant obstruction on ICA; or 2) if a coronary perfusion territory was classified as nonischemic on the CMR images, and the associated coronary artery was diagnosed nonobstructive on ICA.
Statistical analysis
Statistical analysis was performed using SPSS software (IBM SPSS Statistics 20.0, Chicago, Illinois, United States) and MedCalc (MedCalc Software 12.7.8.0, Mariakerke, Belgium) packages. Continuous variables are expressed as mean (SD) for normally distributed data or median with interquartile range for non‑normally distributed variables. Differences in categorical data were computed using the χ2 test or Fisher exact test for unpaired data, and the McNemar test for paired data. To assess clinical and imaging predictors of QP‑derived ischemia diagnosis in the absence of ischemia in QA (QA–/QP+ group), a backward likelihood ratio multivariable logistic regression analysis was performed, with the QA–/QP+ status as a dependent variable and sex, age, diabetes, hypertension, smoking (current or past), left ventricular end‑diastolic volume index (ml/m2), left ventricular ejection fraction (LVEF; %), and presence of LGE as explanatory variables. A P value below 0.05 was considered significant.
Results
Study population
A total of 117 patients were eligible for inclusion in the study. Of those, 14 (12%) were excluded from the analysis due to insufficient response to adenosine, and 2 were excluded due to technical issues with CMR image postprocessing. Therefore, the final assessment included 101 patients. Baseline characteristics of the study cohort are summarized in Table 1. The mean (SD) age was 63 (11) years and 62% of the patients were men. During CMR imaging, the mean (SD) HR increased from 68 (11) to 93 (16) bpm (P <0.001) after adenosine administration. Of the 50 patients who underwent ICA (mean [SD] time interval between CMR and ICA, 2.7 [1] months), 11 (22%) had prior CABG, 1 (2%) received ICA for NSTEMI, and 1 (2%) developed a spontaneous coronary dissection. Therefore, the per‑vessel analysis included 37 patients (111 vessels), and FFR was measured in 22 vessels (20%). Obstructive CAD was diagnosed in 18 patients (49%), including 6 with 2‑vessel disease and 2 with 3‑vessel disease. An overview of the study population is shown in the study flowchart (Figure 1), and baseline characteristics of the subpopulation included in the per‑vessel analysis are presented in Supplementary material, Table S1.
Parameter | Value | |
Categorical variables are presented as number and percentage. Continuous variables are expressed as mean (SD) for normally distributed data.
Abbreviations: BMI, body mass index; CABG, coronary artery bypass graft; CAD, coronary artery disease; MI, myocardial infarction; PCI, percutaneous coronary intervention | ||
Demographic data | ||
Age, y | 63 (11) | |
Male sex | 62 (61) | |
BMI, kg/m2 | 26.3 (4) | |
Medical history and risk factors | ||
Known CAD history | Overall | 46 (46) |
Prior CABG | 15 (15) | |
Prior PCI | 35 (35) | |
Prior MI | 25 (25) | |
Hypertension | 52 (52) | |
Dyslipidemia | 35 (35) | |
Diabetes mellitus | 14 (14) | |
Smoking | 39/100 (39) | |
Family history of CAD | 22/96 (23) | |
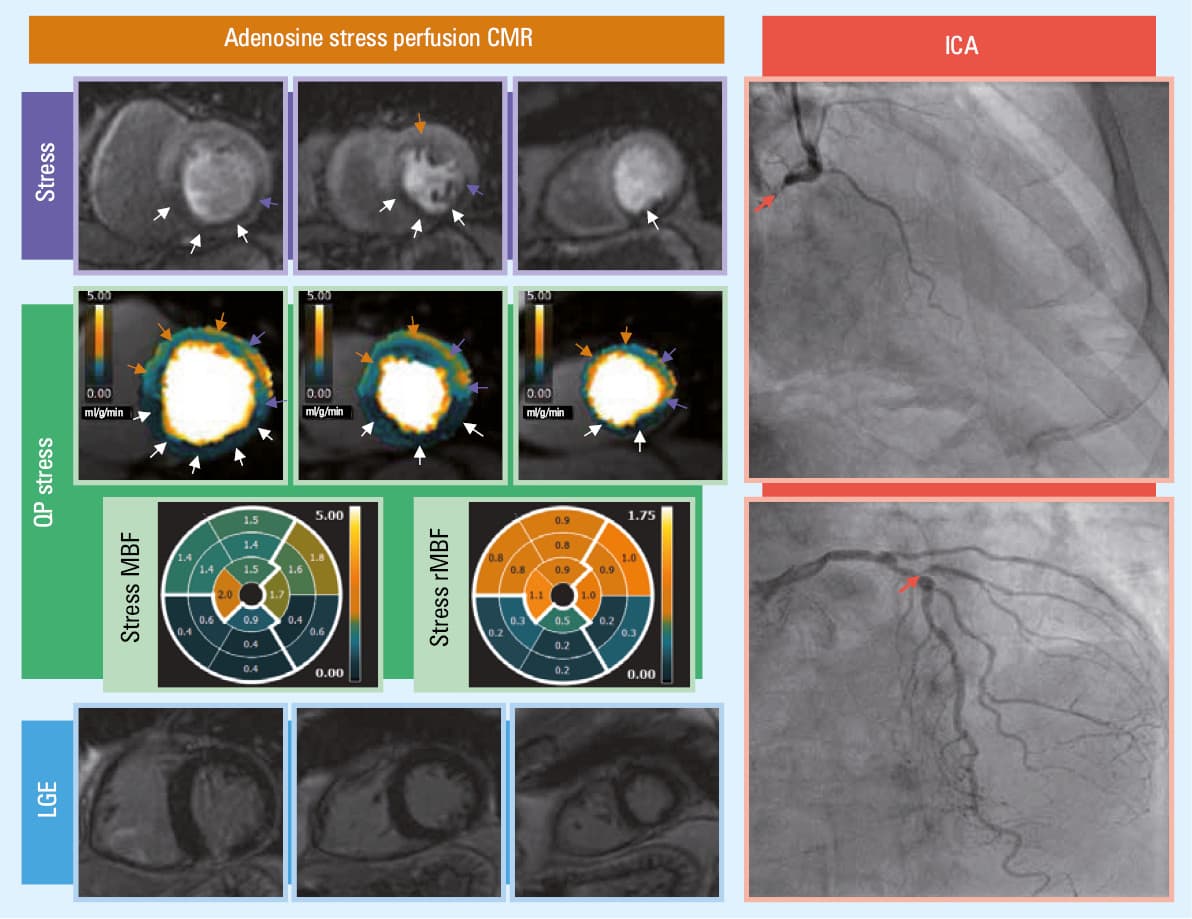
![Adenosine stress perfusion cardiovascular magnetic resonance imaging of a 72-year old man with 2-vessel disease. QA identified perfusion defects in the basal-mid inferoseptal / inferior / inferolateral segments and the inferior apical segment (in total, 7 segments in the RCA [white arrows] and possibly also the Cx [purple arrows] territories) and, with less certainty, a potential perfusion defect in the mid-ventricular anterior segment (1 segment in the LAD territory [orange arrow]). QP stress MBF maps showed extensive, transmural perfusion defects in the RCA (white arrows) and LAD (orange arrows) territories, partially involving also the Cx territory (purple arrows; 15 segments in total), with stress MBF values reduced up to 0.4 ml/g/min in the RCA territory and 1.4 ml/g/min in the LAD territory. Subsequent invasive coronary angiography showed a right dominant coronary arterial system with a small native Cx, a significant lesion (>70% DS) at the bifurcation of LAD/D1, and chronic total occlusion of the RCA with collateral filling from the LAD.Abbreviations: D1, first diagonal branch of left anterior descending artery; DS, diameter stenosis; LGE, late gadolinium enhancement; MBF, myocardial blood flow; rMBF, relative myocardial blood flow; others, see Figure 1 and Tables 1 and 2](/paim/_next/image/?url=https%3A%2F%2Fpamw.pl%2Fsites%2Fdefault%2Ffiles%2Fjson_zip_files%2Funcompressed%2F16975%2FIMAGES%2FKP_WEB__FIG_01.png&w=3840&q=75)
Diagnosis of myocardial ischemia derived from qualitative assessment and quantitative perfusion cardiovascular magnetic resonance analysis
In the per‑vessel analysis, QP assessment classified more coronary territories as ischemic than QA (46% vs 17%; P <0.001; Table 2). QP analysis identified 2‑vessel or 3‑vessel disease / global ischemia more frequently than QA (2‑vessel disease, 14% vs 4%, respectively; P = 0.02; 3‑vessel disease / global ischemia, 31% vs 4%, respectively; P <0.001). An example of a case with a higher ischemic burden diagnosed by QP analysis, as compared with QA, is shown in Figure 2.
Parameter | QP | QA | P value | |
Abbreviations: Cx, circumflex artery; LAD, left anterior descending artery; QA, qualitative assessment of conventional grey‑scale first‑pass stress perfusion cardiovascular magnetic resonance; RCA, right coronary artery; others, see Table 1 | ||||
Ischemic coronary territories, n (%) | All vessels (n = 303) | 140 (46) | 52 (17) | <0.001 |
LAD (n = 101) | 36 (36) | 18 (18) | <0.001 | |
RCA (n = 101) | 59 (58) | 23 (23) | <0.001 | |
Cx (n = 101) | 45 (45) | 11 (11) | <0.001 | |
Grading of CAD extent, n (%) | 1‑vessel (n = 101) | 19 (19) | 32 (32) | 0.04 |
2‑vessel (n = 101) | 14 (14) | 4 (4) | 0.02 | |
3‑vessel / global ischemia (n = 101) | 31 (31) | 4 (4) | <0.001 | |
Correctly classified vessels confirmed by ICA, n (%) | All vessels (n = 111) | 75 (68) | 87 (78) | 0.07 |
LAD (n = 37) | 26 (70) | 27 (73) | 0.1 | |
RCA (n = 37) | 24 (65) | 30 (81) | 0.18 | |
Cx (n = 37) | 25 (68) | 30 (81) | 0.51 | |
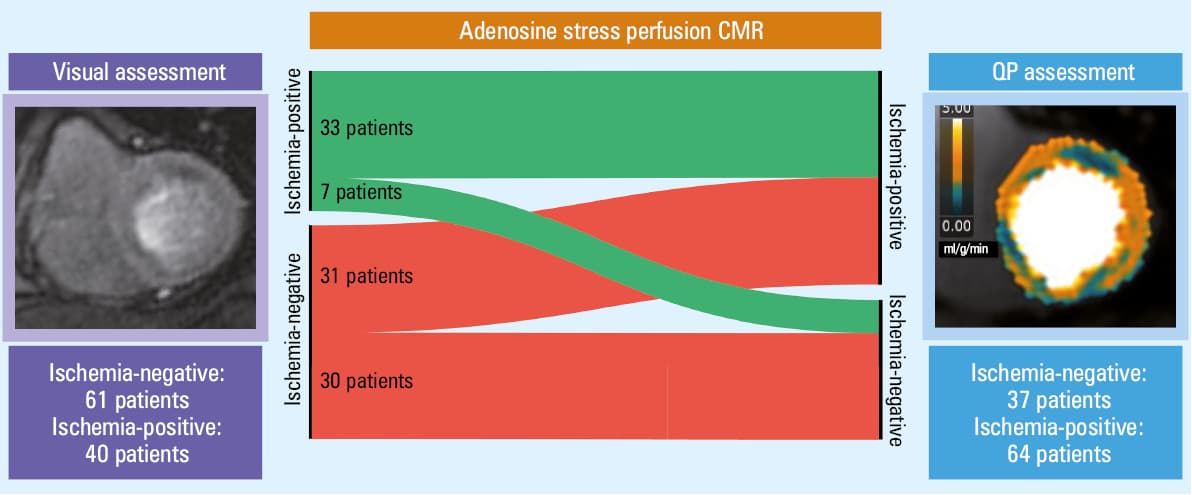
At the patient level, QP assessment identified ischemia in 64 individuals, and QA in 40 (P <0.001; Figure 3). Supplementary material, Table S2 presents patient demographics, clinical characteristics, and CMR parameters in the patients with and without a QP‑derived diagnosis of myocardial ischemia. Comparison of QP parameters in the patients with and without a QA‑derived diagnosis of myocardial ischemia is shown in Table 3. Between QP analysis and QA, 30 cases (30%) were concordant negative, while 33 (33%) were concordant positive for myocardial ischemia. In 7 patients (7%), ischemia was considered present in the QA but not in the QP analysis (QA+/QP–). In 31 patients (31%), QP assessment established a new diagnosis of ischemia (QA–/QP+ group; an example shown in Figure 4). In this patient cohort, 12 individuals (39%) were diagnosed with a subendocardial perfusion defect based n QP assessment. Multivariable logistic regression analysis showed that only male sex (odds ratio [OR], 8.63; 95% CI, 2.335–31.896) and higher LVEF (OR, 1.11; 95% CI, 1.019–1.209) were independent predictors of a new ischemia diagnosis by QP analysis in the absence of ischemia on QA (QA–/QP+; Supplementary material, Table S3).
Per‑patient analysis | |||
Continuous variables are expressed as mean (SD) for normally distributed data.
Abbreviations: MBF, myocardial blood flow; MPR, myocardial perfusion reserve; QA–, no myocardial ischemia diagnosis by qualitative assessment of conventional grayscale first‑pass stress perfusion cardiovascular magnetic resonance; QA+, myocardial ischemia diagnosed by qualitative assessment of conventional grayscale first‑pass stress perfusion cardiovascular magnetic resonance | |||
Parameter | QA+ (n = 40) | QA– (n = 61) | P value |
Rest MBF, ml/g/min | 1.04 (0.24) | 1.03 (0.24) | 0.87 |
Stress MBF, ml/g/min | 1.97 (0.76) | 2.51 (0.67) | <0.001 |
MPR | 2 (0.71) | 2.62 (0.89) | <0.001 |
Per‑vessel analysis | |||
Parameter | QA+ (n = 52) | QA– (n = 251) | P value |
Rest MBF (ml/g/min) | 1.03 (0.25) | 1.03 (0.27) | 0.99 |
Stress MBF (ml/g/min) | 1.77 (0.83) | 2.37 (0.76) | <0.001 |
MPR | 1.79 (0.71) | 2.46 (0.85) | <0.001 |
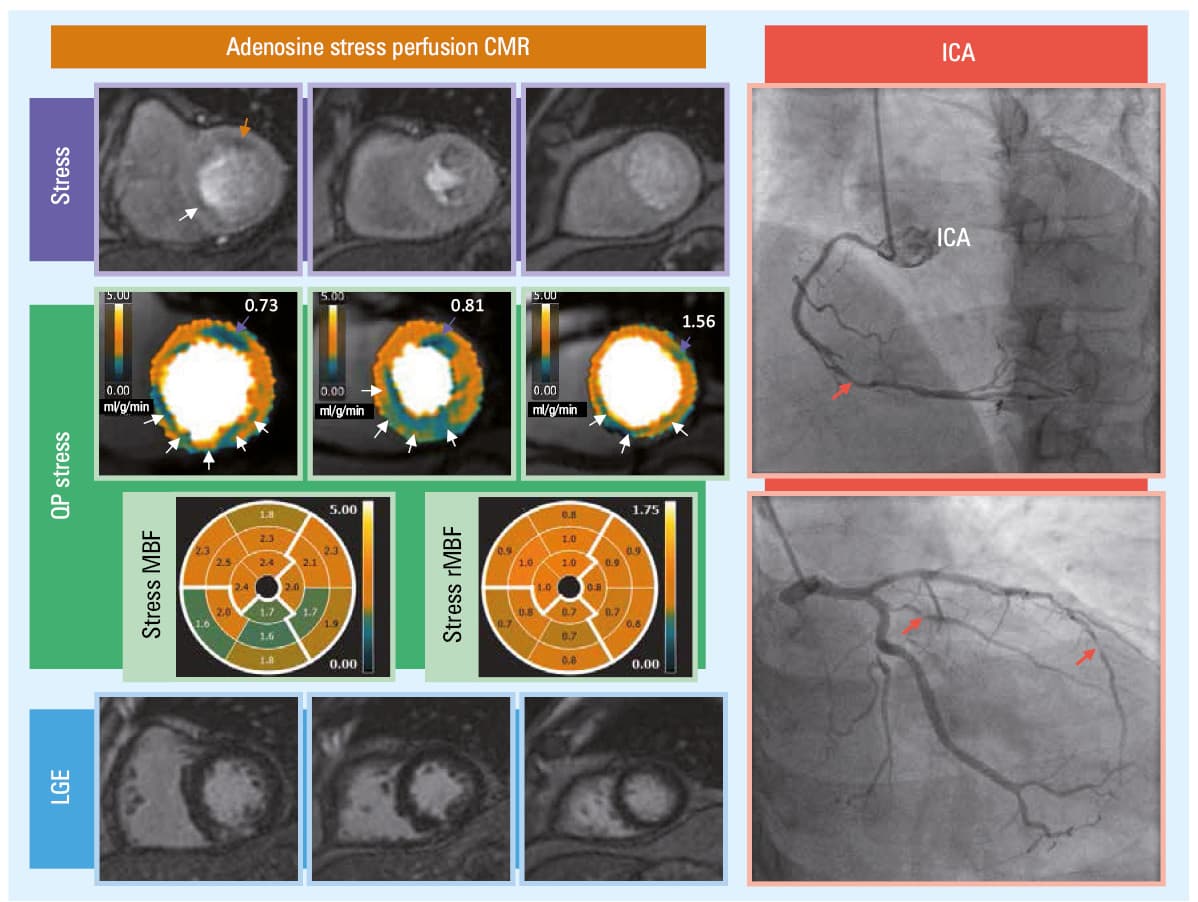
![Adenosine stress perfusion cardiovascular magnetic resonance imaging results of a 59-year old man with 3-vessel disease. QA identified a single perfusion defect in the basal anterior segment (LAD territory [orange arrow]) and, with less certainty (to be differentiated with a dark rim artifact), in the basal inferoseptal segment (RCA territory [white arrow]). QP stress MBF pixel maps showed extensive ischemia in the RCA territory (white arrow) which exceeded LGE (with stress MBF values reduced to 1.6 mg/ml/min), the basal and midventricular anterior / anterolateral segments (purple arrows), and partially also the apical segment. Subsequent invasive coronary angiography showed significant (>70% DS) lesions in the mid-RCA, intermediate branch, and distal LAD.Abbreviations: see Figures 1 and 2 and Table 2](/paim/_next/image/?url=https%3A%2F%2Fpamw.pl%2Fsites%2Fdefault%2Ffiles%2Fjson_zip_files%2Funcompressed%2F16975%2FIMAGES%2FKP_WEB__FIG_04.jpg&w=3840&q=75)
Subanalysis of the patients who underwent ICA showed that a presence or absence of obstructive CAD was correctly diagnosed by QP analysis in 68% and by QA in 78% of the vessels (P = 0.07). In the QA–/QP+ group, 8 patients underwent ICA. Further assessment of these patients showed correct classification of the CAD extent by QP analysis (Figure 5), functional coronary microvascular dysfunction (Supplementary material, Figure S1), global reduction of stress MBF (Supplementary material, Figure S2), potential occurrence of a dark‑rim artifact visible on QA which yielded a false‑positive QP result (Supplementary material, Figure S3), suggested possibility of scanning technical issue (Supplementary material, Figure S4), and overlapping of ischemic territories due to patient‑specific coronary artery anatomy (Supplementary material, Figure S5).
Discussion
This retrospective study sought to compare the clinical conclusions on ischemia detection derived from conventional grayscale QA and QP CMR in a real‑world population of patients with suspected myocardial ischemia referred for adenosine stress perfusion CMR imaging. Interestingly, QP analysis identified myocardial ischemia in a subgroup of patients who were categorized by QA as nonischemic; therefore, it holds promise for identifying cases of myocardial ischemia that may be overlooked by QA alone.
In the clinical setting, stress perfusion CMR, among other noninvasive myocardial perfusion imaging modalities, is applied to document ischemia and to guide coronary revascularization.1 Therefore, reliable identification of ischemic coronary territories is crucial for this purpose. In our study, QP assessment identified ischemia in a significantly higher number of coronary arteries, and more frequently diagnosed 2- and 3‑vessel ischemia, as compared with QA. Although these results could not be fully verified against the invasive gold standard, they seem to be in line with the findings of Kotecha et al,11 who observed a higher number of ischemic coronary territories on QP mapping, as compared with QA. In their study, verification with ICA as a reference standard showed that the QP‑derived diagnosis of 2- and 3‑vessel disease was correct in a higher number of patients than the QA‑derived diagnosis (2‑vessel disease, 71% vs 48%, respectively; P <0.001 and 3‑vessel disease, 87% vs 40%, respectively; P <0.001).11 As discussed by the authors, on QA of the patients with multivessel CAD, perfusion defects appeared most prominent in the coronary territory with usually the most severe stenosis, which made the perfusion defects in other coronary territories subtler or even visually nondetectable.11 In our study, the QP results could not be fully verified with ICA as a reference standard in all patients; however, based on the literature, it can be assumed that the higher ischemic burden observed on QP mapping is most probably true, at least in a substantial proportion of patients.
Interestingly, our results suggested that in clinical practice, myocardial ischemia in a subset of patients can be overlooked by QA alone, whereas QP assessment can help detect it. This was observed not only in the cases of balanced ischemia due to CMD, but also in the patients with obstructive CAD. Recently published results from the international multicenter observational AQUA‑MBF study demonstrated that MBF quantification using QP CMR improved the detection of obstructive CAD.14 In that study, stress MBF and MPR had areas under the curve (AUCs) of 0.9 (95% CI, 0.84–0.96) and 0.86 (95% CI, 0.8–0.93), respectively, for identification of ICA- or CCTA‑diagnosed obstructive CAD, while the AUCs for QA performed by 4 CMR experts ranged between 0.69 and 0.88.14 Importantly, QP analysis significantly increased sensitivity for detecting obstructive CAD, which aligns with our hypothesis that QP CMR can improve the diagnosis of myocardial ischemia in patients initially diagnosed as nonischemic with QA (in the AQUA‑MBF study, sensitivity of global mean stress MBF was 0.89 [95% CI, 0.74–0.92], of global mean MPR, 0.82 [95% CI, 0.66–0.89], and that of QA by 4 expert readers varied from 0.45 to 0.89).14 On the other hand, Biglands et al,25 in a CE‑MARC (Clinical Evaluation of Magnetic Resonance Imaging in Coronary Heart Disease) substudy, did not find QP assessment superior to QA, with both approaches showing excellent overall diagnostic accuracy (AUC for QA, 0.88 [95% CI, 0.81–0.95]; AUC for QP CMR, 0.89 [95% CI, 0.83–0.96]). Similarly, in the PACIFIC‑2 (Prospective Comparison of Cardiac PET, SPECT, and MRI Perfusion Imaging with Invasive Coronary Angiography in Patients with Prior CAD) substudy of symptomatic chronic coronary symptom patients with prior myocardial infarction and / or percutaneous coronary intervention, diagnostic accuracy of QP CMR was comparable to that of QA for the detection of hemodynamically significant CAD as defined by FFR (AUC for QA, 0.67 [95% CI, 0.59–0.75]; AUC for QP CMR, 0.66 [95% CI, 0.58–0.74]).26 In general, stress CMR perfusion images are acquired as a dynamic series of images captured during the transit of contrast through the myocardium.4 In clinical practice, these images are inspected visually to compare regions and identify relative hypoperfusion (ie, lower SI), which should persist beyond peak myocardial enhancement for at least several RR intervals.27 However, it may be presumed that if the SI difference is relatively low and is not sharply demarcated, visual inspection may be challenging. In a recent meta‑analysis, stress perfusion CMR demonstrated an AUC of 0.84 (95% CI, 0.77–0.89), with sensitivity of 81% (95% CI, 68%–89%) and specificity of 86% (95% CI, 75%–93%) in detecting hemodynamically significant coronary obstructions defined by FFR below 0.8 or below 0.75.5 Although the diagnostic accuracy is excellent, the reasons for false‑negative diagnoses of QA are not entirely clear. From a pathophysiological point of view, in the presence of coronary artery stenosis, decreased coronary blood flow resulting from the obstruction can be compensated by a decrease in microvascular resistance.28 Therefore, the microvascular reserve, that is, the ability to vasodilate during hyperemia, is closely related to the degree of stenosis severity. In mild stenoses, microvascular reserve is large, offering the potential to increase MBF after administration of adenosine. On the other hand, in more severe stenoses, the microcirculation is already dilated at rest, leading to a reduction in microvascular reserve and an adenosine‑induced increase in MBF.29 Though additional research is needed, it could be hypothesized that in the case of lesions of borderline severity and hemodynamic relevance, adenosine stress myocardial perfusion, despite being reduced, might still be adequate for a relatively quick distribution of contrast to the myocardium. Therefore, the relative reduction in SI may be too subtle for human observation, potentially resulting in false‑negative interpretations, whereas these nuances can be identified through objective pixel‑by‑pixel quantification. Indeed, a meta‑analysis by Ricci et al5 showed that sensitivity and AUC of QA of stress perfusion CMR for detection of more severe lesions (defined as FFR <0.75) were 92% and 0.89, respectively, while for FFR below 0.8, sensitivity and AUC were 79% and 0.83, respectively. Moreover, it has been shown that among the vessels with grayzone FFR values (0.75–0.82), only 17% of lesions had a major perfusion defect on QA of stress perfusion CMR, while another 7% had a minor perfusion defect.30 Notably, the relation between FFR and flow defect is not always concordant. As discussed by Johnson and Gould,31 some lesions exhibit a significant epicardial pressure gradient, resulting in low FFR, without any relative or absolute flow impairment. On the other hand, certain lesions generate minimal pressure gradient leading to a high FFR, whereas imaging shows a relative or absolute flow defect.31 Nevertheless, our results showed significant differences between QP assessment and QA, which could imply underperformance of QA in ischemia detection. In our study, the logistic regression model for predicting a QP‑derived ischemia diagnosis in the absence of ischemia on QA also demonstrated that male sex and higher LVEF values were independently associated with a QA–/QP+ outcome. This finding partially aligns with the results reported by Szekely et al,32 who demonstrated that male sex, along with increasing age and diabetes, was independently associated with lower stress MBF values in patients with suspected or established chronic coronary syndrome, regardless of coronary artery stenosis. In addition, LVEF was also independently associated with a QA–/QP+ outcome. It can be speculated that a relatively low image frame rate in QA may affect visual interpretation, particularly in the patients with a short myocardial contrast transit time due to higher HRs and / or stronger cardiac contraction (ie, higher LVEF). Conversely, the QP technique may be less influenced by these factors, providing a more robust pixel‑by‑pixel calculation of myocardial perfusion. However, these hypotheses require further investigation in large multicenter randomized trials to evaluate the diagnostic performance and clinical relevance of QP CMR, as well as its impact on patient outcomes in real‑world cohorts.
This study showed that although QP analysis was capable of reclassifying a case to indicate the absence of ischemia, assessment of QP pixel maps alone may also give some false‑positive results due to misclassification of a dark rim artifact as a true subendocardial perfusion defect. Notably, our study was performed using a 3T scanner, which is known to be more susceptible to this type of artifact. QP analysis has been suggested as a potential tool to differentiate between a true perfusion defect and a dark rim artifact; however, in this study, some of the dark rim artifacts had stress MBF values below the cutoff value for ischemia detection, which may be misleading in routine diagnostic workup.33 In QA, the problem of a dark rim artifact has been well known for decades, and several criteria for its differentiation from true perfusion defect have been established.27 Detection of a dark rim artifact may be subjective and reliant on the QA of contrast inflow dynamics into the LV and myocardium. These artifacts are typically most pronounced when the contrast agent enters the LV blood pool and they persist transiently until reaching the peak enhancement in myocardial contrast. Moreover, dark rim artifacts lead to a reduction in SI as compared with baseline myocardial SI, and appear mainly in the phase‑encoding direction.27 These subtleties cannot be taken into account when analyzing only QP maps, which provide numerical perfusion values without allowing the experienced CMR imaging reader to assess these nuances.27 It seems reasonable to assess QP along with QA, especially when a 3T scanner is utilized, to reduce uncertainties and avoid false‑positive QP diagnoses caused by dark rim artifacts being mistaken for subendocardial ischemia.
The integration of QP CMR into routine clinical practice presents several practical challenges that must be addressed. First, the implementation of QP analysis requires a dedicated imaging sequence and postprocessing software. Second, comprehensive training of the CMR team, including radiographers and CMR readers, is essential to develop the necessary expertise and ensure accuracy and consistency. While these factors represent an upfront investment of time, effort, and financial resources, the higher clinical yield achieved through QP analysis can provide a significant return on investment, making it a worthwhile and valuable approach in the long term.
Limitations
Due to the retrospective and real‑world nature of our study, some limitations are inevitable. A significant limitation of this study is the lack of validation against ICA and FFR measurement as a gold standard in all patients. Consequently, the diagnostic accuracy of QP analysis and QA cannot be definitely verified. To fully evaluate the clinical utility of QP CMR in a real‑world population of patients, further prospective, well‑designed randomized trials are warranted to provide robust evidence and address the limitations of our study. In addition, the single‑center cohort design poses a risk of a potential sample bias by reflecting the specific demographics and clinical practices of a single institution. To address these limitations, further multicenter validation studies are warranted to confirm the findings across multiple centers, enhance the generalizability of the results, and provide a more comprehensive understanding of the role of QP CMR in clinical practice across various CMR laboratories.
We were also not able to adjust the results to patient‑specific coronary anatomy and used a standard AHA 16‑segment model of myocardial segmentation. This could potentially influence the per‑territory results (ie, a higher number of ischemic circumflex artery territories, while in fact these segments could show reduced stress MBF due to ischemia in the dominant right coronary artery territory). Finally, although QP CMR is a promising method for MBF quantification with demonstrated high diagnostic accuracy in detecting obstructive CAD, it remains a research tool requiring validation in large‑scale studies.
Conclusions
Application of QP CMR allows for detecting a higher number of ischemic coronary territories as compared with QA in a clinical setting. Notably, QP CMR has the potential to detect cases that may be overlooked by QA alone, necessitating further investigation in larger clinical trials. The implementation of QP CMR in the diagnostic workflow can therefore substantially influence patient management after stress perfusion CMR. Further large multicenter randomized trials are warranted to assess the diagnostic performance and clinical relevance of QP CMR, as well as its impact on patient outcomes in a real‑world cohort.
- Vrints C, Andreotti F, Koskinas KC, et al. 2024 ESC Guidelines for the management of chronic coronary syndromes. Eur Heart J. 2024; 45: 3415‑3537.
- Greenwood JP, Maredia N, Younger JF, et al. Cardiovascular magnetic resonance and single‑photon emission computed tomography for diagnosis of coronary heart disease (CE‑MARC): a prospective trial. Lancet. 2012; 379: 453‑460.
- Arai AE, Schulz‑Menger J, Berman D, et al. Gadobutrol‑enhanced cardiac magnetic resonance imaging for detection of coronary artery disease. J Am Coll Cardiol. 2020; 76: 1536‑1547.
- Patel AR, Salerno M, Kwong RY, et al. Stress cardiac magnetic resonance myocardial perfusion imaging: JACC review topic of the week. J Am Coll Cardiol. 2021; 78: 1655‑1668. | Crossref
- Ricci F, Khanji MY, Bisaccia G, et al. Diagnostic and prognostic value of stress cardiovascular magnetic resonance imaging in patients with known or suspected coronary artery disease: a systematic review and meta‑analysis. JAMA Cardiol. 2023; 8: 662‑673. | Crossref
SUPPLEMENTARY MATERIAL
ARTICLE INFORMATION