Ambulatory glucose profile in a patient with type 1 diabetes and deferred insulin treatment


 CC BY-NC-SA 4.0
Ambulatory glucose profile in a patient with type 1 diabetes and deferred insulin treatment
In August 2020, a 27‑year‑old man reported to an outpatient diabetes clinic with new‑onset diabetes mellitus. Before the visit, the patient was on 1500 mg of metformin for several days. His random blood glucose level was 18.3 mmol/l, fasting glucose level, 17 mmol/l (reference range [RR], 3.9–5.6 mmol/l), and glycated hemoglobin (HbA1c), 10.8% (94.5 mmol/mol). The patient presented with polyuria and polydipsia, but no significant weight loss or ketoacidosis. He received diabetes education and was prescribed mealtime glulisine and glargine U300 once daily with an appropriate dosage guide. A 2‑week follow‑up visit was scheduled, with laboratory tests and further educational sessions. The patient missed the appointment.
In April 2024, he made a new appointment at the diabetes clinic. For almost 4 years he had not been taking insulin or any other diabetes medications. He intermittently used a continuous glucose monitoring device (CGM; FreeStyle Libre 2, Abbott Diabetes Care Ltd., Witney, United Kingdom) and had an average glucose level of approximately 350 mg/dl (19.4 mmol/l; Figure 1A). Type 1 diabetes (T1D) was confirmed with autoantibody testing. Fasting serum C‑peptide level was 0.2 nmol/l (RR, 0.36–1.45 nmol/l), with concurrent fasting glycemia of 16.1 mmol/l, indicating preserved but severely impaired β-cell function. HbA1c was 10.1%, equivalent to the mean glycemia of 240 mg/dl (13.5 mmol/l), a clinically significant discrepancy with the CGM result. No common causes of a falsely decreased HbA1c concentration, such as renal insufficiency, liver disease, or anemia, were diagnosed.1 Interference with vitamin C could not be ruled out, but its effect should not bias the CGM results by more than 20 mg/dl upward.2 As the patient resorted to alternative therapies, an effect of vitamin E ingestion on the HbA1c level could explain the difference.3
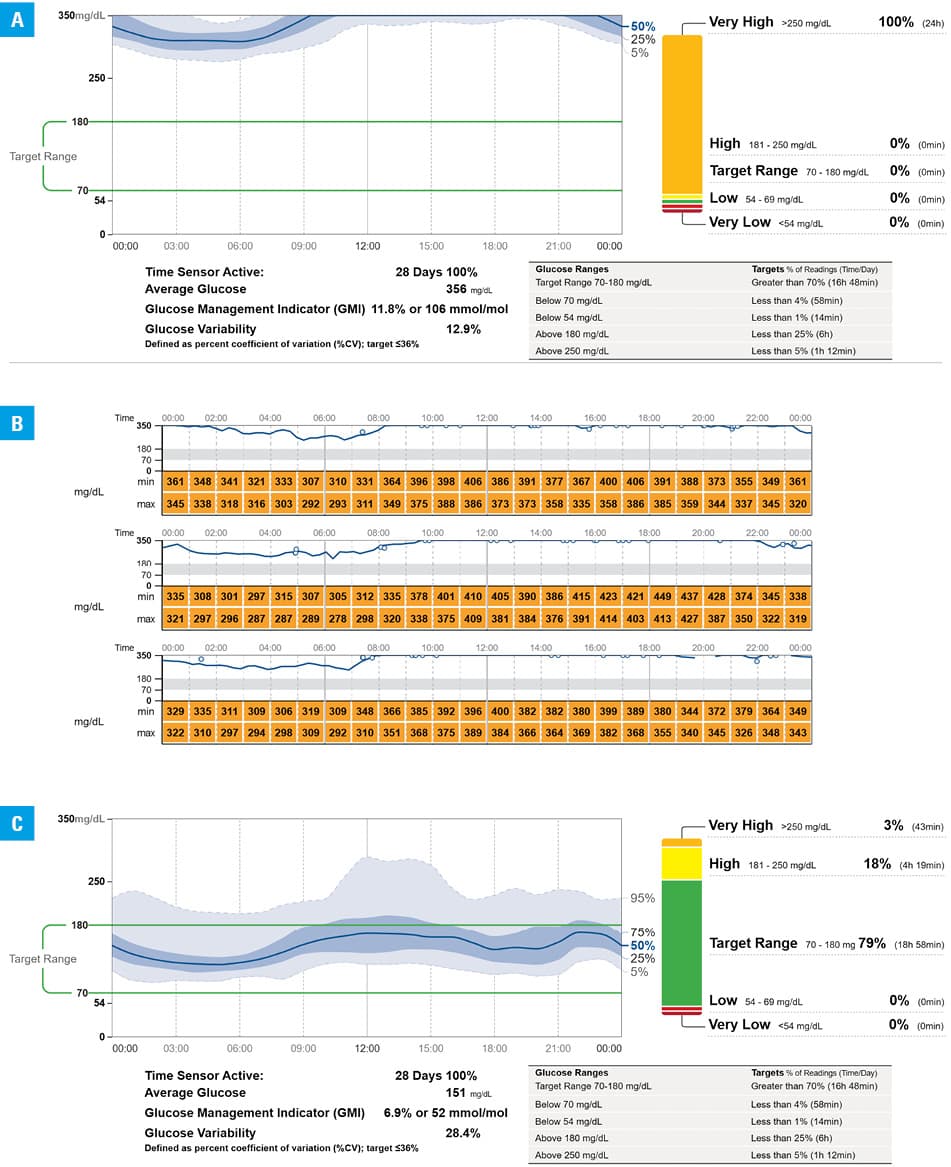
This case presents an unusual ambulatory glucose profile of a patient with untreated overt T1D. Figure 1A shows a period (January 2024) with complete CGM data, during which 100% of recorded glucose values were above 250 mg/dl. A virtually identical pattern could be observed during all periods of CGM use before the start of insulin therapy. Glucose levels were surprisingly uniform, characterized by a very low (12.9%) coefficient of variation. Figure 1B presents data from 3 consecutive days with hourly glucose ranges, illustrating this high uniformity.
A memorable case report published in 20074 described a 29‑year‑old man who developed T1D with a latent phenotype in 1909. He survived 14 years until insulin discovery, and died at the age of 88 years without advanced microvascular complications. Our report presents a case of a patient who developed T1D over 100 years after insulin discovery, yet refrained from its use for almost 4 years. Unfortunately, he developed mild albuminuria of 54 mg/g (6.1 mg/mmol) and painful peripheral neuropathy. Initial screening did not indicate diabetic retinopathy. After a period of regular insulin treatment (average daily dose of 35 U; 0.45 U/kg body weight), the patient has maintained very good glycemic control,5 as shown in Figure 1C (October 2024), with high treatment adherence and overall good prognosis.
- Homa K, Majkowska L. Difficulties in interpreting HbA(1c) results. Pol Arch Med Wewn. 2010; 120: 148‑154. | Crossref
- Heinemann L. Interferences with CGM systems: practical relevance? J Diabetes Sci Technol. 2022; 16: 271‑274. | Crossref
- Ceriello A, Giugliano D, Quatraro A, et al. Vitamin E reduction of protein glycosylation in diabetes: new prospect for prevention of diabetic complications? Diabetes Care. 1991; 14: 68‑72. | Crossref
- Brostoff JM, Keen H, Brostoff J. A diabetic life before and after the insulin era. Diabetologia. 2007; 50: 1351‑1353. | Crossref
- Battelino T, Danne T, Bergenstal RM, et al. Clinical targets for continuous glucose monitoring data interpretation: recommendations from the international consensus on time in range. Diabetes Care. 2019; 42: 1593‑1603.
ARTICLE INFORMATION