Serum testosterone levels and their association with selected anthropometric parameters obtained by dual-energy X-ray absorptiometry: a population-based study
Key words: body mass index, dual-energy X-ray absorptiometry, free testosterone, population study, total testosterone


 CC BY-NC-SA 4.0
Serum testosterone levels and their association with selected anthropometric parameters obtained by dual-energy X-ray absorptiometry: a population-based study
Introduction: Testosterone plays an important role in men’s health.
Objectives: The aim of the study was to assess serum concentrations of total testosterone (tT) and free testosterone (fT) in men and to investigate the association of their levels with anthropometric parameters.
Patients and methods: A cross‑sectional population‑based survey was conducted among 701 men aged 20–64 years included in the Bialystok PLUS study (Poland). Dual‑energy X‑ray absorptiometry was used to assess body composition.
Results: Median (interquartile range [IQR]) serum tT concentration was 4.39 (3.4–5.7) ng/ml, and median (IQR) serum fT concentration was 339.41 (277.4–403.7) pmol/l. In the overall study population and among men aged 20–34 years, tT concentrations were negatively associated with body fat mass and android fat distribution. Among men aged 35–49 years, tT levels were negatively associated with body fat mass and android fat distribution, but positively associated with lean body mass. In the 50–64 years age group, tT concentrations were negatively related to body fat mass and positively related to lean body mass. Across the entire cohort and within each age subgroup, lower fT concentrations were linked to higher body fat mass. A positive relationship between lean body mass and fT levels was noted in the 35–49 years age group.
Conclusions: In the overall population and across all age groups, higher fat mass was linked to lower serum tT and fT concentrations. In younger men, an android pattern of fat distribution was associated with lower tT levels, whereas greater lean body mass in older men was tied to higher tT and fT concentrations. Testosterone levels are significantly related not only to body weight, but also to body composition.
What's new?
This study provides a comprehensive analysis of serum testosterone concentrations in the population of men aged between 20 and 64 years. We also analyzed, gathered up to the present, these epidemiologic data on testosterone serum levels in relation to selected anthropometric parameters, such as body fat mass, body fat distribution, and lean body mass measured with dual‑energy X‑ray absorptiometry. We found age- and body composition–related differences in serum testosterone concentrations. It seems that increased body fat mass, and particularly android body fat distribution, coexist with lower serum testosterone levels. Higher body lean mass is associated with higher serum testosterone levels. These data can serve as a basis for further epidemiologic investigations to examine this important phenomenon from a male health perspective.
Introduction
Testosterone plays an important role in male reproduction, including stimulation of Sertoli cells and spermatogenesis.1 Testosterone is not only associated with male reproduction, it also impacts other areas of male physiology, such as muscle growth, stimulation of bone mineralization, erythropoiesis, and cognitive functions.2 The currently available scientific literature from the United States, Scandinavia, and Israel describes a continuous decline in serum levels of testosterone in men from the 1970s to the 2000s.3-6 Changes in lifestyle and other health factors have been shown to be closely associated with declines in total testosterone (tT), free testosterone (fT), and sex hormone–binding globulin (SHBG). Weight gain has a significant impact on the decline in male sex hormones.6 Other possible reasons for the drop in testosterone levels could be related to changing dietary habits. A continuous increase of phytoestrogens in the contemporary diet has been proposed as a cofactor.7 Lower testosterone levels also result from excessive alcohol consumption.8 Environmental pollution has a negative effect on serum testosterone concentrations in the male population.9 The contemporary environment and lifestyle are undergoing rapid and significant transformation, which may further influence serum testosterone levels in men. We noticed a lack of recent data regarding serum testosterone levels in the general population.
The objective of this study was to assess the serum concentrations of tT and fT in men from the general population–based Bialystok PLUS study10 from Poland, and to examine possible associations between selected anthropometric parameters and tT and fT concentrations.
Patients and methods
A cross‑sectional population‑based survey was conducted among participants of the Bialystok PLUS study. This is a population‑based cohort study conducted in the north‑eastern region of Poland, the details of which have been described in our previous publications.10,11 The present study was conducted among men residing in Bialystok, aged between 20 and 64 years, who were surveyed at the research center between 2018 and 2023.
Bialystok PLUS population selection
Bialystok PLUS study participants were randomly selected from the Bialystok residents in the proportions reflecting the general population of the city.10
On an annual basis, specifically in the middle of each year, after June 30th, the Municipal Office in Bialystok provides us with a pseudonymized list of Bialystok’s citizens. This list is subsequently used as the basis for the calculation of demography statistics by the National Statistical Office in Poland.
The dataset was limited to individuals aged 20–79 years, with categories based on sex and 5‑year intervals (20–24, 25–29, etc.), resulting in a total of 24 subcategories. A random sample of citizens was selected from each subcategory, with the number of individuals selected being sufficient to yield a distribution of proportions similar to that observed in the city’s population. Following the sampling process, the identifiers of the selected citizens were transmitted back to the Municipal Office. This enabled us to obtain their names and addresses, which were subsequently used to contact them. The citizens selected in the above‑described process were then invited to participate in the study in a letter, and they were encouraged to contact the researchers by telephone or email to schedule a visit. Subsequently, invitations were sent to those who had not responded, and a second and even third set of letters were sent after a period of time had elapsed to those who continued failing to respond. The same process was repeated each year. No exclusion criteria were applied, although certain subpopulations were not subjected to all examinations (eg, oral glucose tolerance test in diabetics).12
Selection of the study group
A total of 5345 residents were invited to participate in the survey between November 15, 2018 and September 4, 2023. The total number of examined participants was 1991. We focused on the male population only, so women (n = 1103) were excluded from the analysis. We arbitrarily included men aged 20–64 years.13 We decided to exclude participants who were taking any of the following medications: hormones and related substances (anatomical therapeutic chemical [ATC] code L02A) or androgens (ATC code G03B). A total of 701 men were then included in the final group. The study selection process is shown as a flowchart (Supplementary material, Figure S1).
Data collection
Data collection was conducted by trained personnel in accordance with standardized procedures. The tests were performed in a reproducible manner, in accordance with validated Standard Operating Procedures.12 Information on age, sex, and medical history was obtained by personal interviews.14,15
Anthropometric measurements, such as height, weight (InBody 770 analyzer, InBody Co., Ltd. Seoul, Korea), circumference of waist and hips (SECA 201 tape, Hamburg, Germany) were taken in accordance with World Health Organization standards.16 Based on these findings, we calculated body mass index (BMI; weight in kilograms divided by height in meters squared) and waist‑to‑hip ratio (WHR; a ratio between waist and hip circumference). Body composition measurements were performed using dual‑energy X‑ray absorptiometry (DEXA, GE Healthcare Lunar, Madison, Wisconsin, United States) as described previously.17 For further analyses, we divided the body mass into 3 components: fat mass, lean mass, and bone mass. Using the region of interest (ROI) program, total fat (TF), gynoid fat (GF), android fat (AF), total lean (TL), gynoid lean (GL), and android lean (AL) mass were measured automatically. Fat mass index (FMI) and lean mass index (LMI) were calculated as fat, lean, and visceral mass in kilograms divided by height in meters squared. The appendicular skeletal muscle (ASM) mass was calculated as a sum of the lean muscle mass of the upper and lower extremities, and ASM index (ASMI) was adjusted with height (ASM/height2 [kg/m2]). For the android ROI, the lower boundary was at the pelvic section, the upper boundary was situated above the pelvic section, positioned at a point 20% of the way up from the pelvic section to the neck section, and lateral boundaries were the arm sections. For the gynoid ROI, the upper boundaries were below the pelvic cut line by 1.5 times the height of the android ROI, gynoid ROI height equaled to 2 times the height of the android ROI, and lateral boundaries were the outer leg cuts. The A/G ratio was calculated as the ratio of the fat in the android (central) region to the fat in the gynoid (hip and thigh) region. The G/TF ratio was calculated as the ratio of the gynoid fat to the total fat. Subsequently, the A/TF ratio was calculated as the ratio of the android body fat to the total body fat.
Peripheral venous blood samples were collected at a morning visit after at least 8 hours of fasting. Serum creatinine was determined by the enzymatic colorimetric method with Cobas e111 analyzer (Roche, Meylan, Isère, France). Estimated glomerular filtration rate (eGFR) was calculated according to the 2021 Chronic Kidney Disease Epidemiology Collaboration equation.18
The serum concentration of tT, SHBG, follicle‑stimulating hormone (FSH), luteinizing hormone, cortisol, prolactin (PRL), and dehydroepiandrosterone (DHEA) were determined with the electrochemiluminescence method using the Cobas e411 analyzer (Roche). The empirical free testosterone (EFT) was calculated according to the methods described by Ly and Handelsman19 with the formulas outlined below.
Model 1: EFT‑lo = −6.593 + 19.304 tT + 0.056 SHBG − 0.0959 tT × SHBG, and
Model 2: EFT‑hi = −52.65 + 24.4 TT − 0.704 SHBG − 0.0782 tT × SHBG − 0.0584 tT2.
Model 1 was used for low serum testosterone levels (<5 nmol/l; EFT‑lo), and model 2 was used for high serum testosterone levels (≥5 nmol/l; EFT‑hi). tT and SHBG were provided in nmol/l. The negative values of fT were changed to 0.
Ethical issues
The study conformed to the principles of the Declaration of Helsinki, as reflected by an a priori approval of the ethics committee of the Medical University of Bialystok (R‑I‑002/108/2016). All participants provided their written informed consent. This manuscript was written in accordance with the STROBE statement, which provides guidelines for reporting of observational studies (Supplementary material).
Statistical analysis
Descriptive statistics were presented as medians and interquartile ranges (IQRs) for quantitative variables, and counts with percentages for categorical variables. The normality of distribution was assessed using the Shapiro–Wilk test. Variables exhibiting skewness greater than 0.5 were log‑transformed to approximate normality. Comparisons of tT, fT, and SHBG levels across age groups were performed using 1‑way analysis of variance on the log‑transformed values. The Tukey post‑hoc tests were used to identify significant pairwise differences between the 3 age groups. All P values for these group comparisons are reported in the corresponding boxplots, which display a raw (not log‑transformed) scale for ease of interpretation. Associations between serum levels of tT and clinical variables, as well as between serum levels of fT and clinical variables were analyzed using simple and multiple linear regression models. Multiple regression models were adjusted for age (Model 1), age and FMI (Model 2), and age, FMI, and WHR (Model 3). Prior to the regression analysis, multicollinearity was assessed by examining the Pearson correlation coefficients between independent variables and covariates. The independent variables that exhibited a strong correlation (|r| >0.8) with any covariate were excluded from the multiple regression models to prevent multicollinearity issues. The variables excluded due to strong correlation were annotated accordingly in the results. The regression models were presented using variable coefficients (B), P values, and coefficients of determination (R² or adjusted R²). Regression coefficients (B) presented in the Tables represent nonstandardized estimates. For independent variables measured in their original units, a 1‑unit increase is associated with a B‑unit change in the target variable. In instances where an independent variable is natural log‑transformed, while the target variable remains in its original units, the coefficient B is interpreted differently. A 1%-increase in the independent variable corresponds to a B × ln(1.01) ≈ 0.00995B change in the dependent variable. For practical interpretation, this is approximately equivalent to a B/100 unit change, with all other variables held constant. To address multiple comparisons in the regression analyses, we controlled the false discovery rate (FDR) using the Benjamini–Hochberg procedure. Associations with FDR‑adjusted P values below 0.05 were considered significant. P values from these tests were reported to assess the significance of the observed differences between the age groups, and were annotated on the corresponding boxplots. The statistical hypotheses were verified at a significance level of 0.05. Whiskers were determined using the standard rule of 1.5 × IQR beyond the first and third quartile. Outliers were removed from the visual presentation to emphasize the main data distribution but were included in the statistical analysis. The statistical analysis was performed using Python software version 3.10 (Python Software Foundation, Wilmington, North Carolina, United States) and Jupyter Notebook version 4.0.7 (Project Jupyter, NumFOCUS, Austin, Texas, United States). The following libraries were utilized: pandas (version 2.2.1), numpy (version 1.26.4), scipy.stats (version 1.11.4), and statsmodels (version 0.14.1).
Results
Median (IQR) age of the study population was 43 (33–54) years. Median (IQR) serum tT concentration was 4.39 (3.4–5.7) ng/ml, median (IQR) serum fT concentration was 339.41 (277.4–403.7) pmol/l, and median (IQR) SHBG concentration was 35.47 (26.2–49.2) ng/ml. The laboratory parameters analyzed in the study are presented in Table 1.
Variable | Age, y | Reference range | Median | IQR | |
Abbreviations: eGFR: estimated glomerular filtration rate; IQR, interquartile range | |||||
Total testosterone, ng/ml | 20–49 | 2.49–8.36 | 4.39 | 3.4–5.7 | |
≥50 | 1.93–7.4 | ||||
Free testosterone, pmol/l | 20–49 | 198–619 | 339.41 | 277.4–403.7 | |
≥50 | 163–473 | ||||
Sex hormone–binding protein, nmol/l | 20–49 | 18.3–54.1 | 35.47 | 26.2–49.2 | |
≥50 | 20.6–76.7 | ||||
Cortisol, µg/dl | – | 6.02–18.4 | 12.95 | 10–15.6 | |
Dehydroepiandrosterone, µg/dl | 20–24 | 211–492 | 254.6 | 175.6–343.8 | |
25–34 | 160–449 | ||||
35–44 | 88.9–427 | ||||
45–54 | 44.3–331 | ||||
55–64 | 51.7–295 | ||||
Luteinizing hormone, mIU/ml | – | 1.7–8.6 | 5.19 | 3.9–6.6 | |
Follicle‑stimulating hormone, mIU/ml | – | 1.5–12.4 | 4.84 | 3.3–6.8 | |
Prolactin, µIU/ml | – | 86–324 | 204.6 | 159–262.9 | |
Creatinine, µmol/l | – | 0.7–1.2 | 0.89 | 0.8–1 | |
eGFR, ml/min/1.73 m2 | – | ≥60 | 102.44 | 92.9–111.1 | |
Median (IQR) BMI of the study population was 27.08 (24.6–30.2) kg/m2, median (IQR) WHR was 0.93 (0.9–1), median (IQR) FMI was 7.82 (6.1–9.7) kg/m2, median (IQR) LMI was 18.45 (17.3–20) kg/m2, and median (IQR) ASMI was 8.93 (8.1–9.7) kg/m2. The details are shown in Table 2.
Variable | Median | IQR |
Abbreviations: A, android; ASM, appendicular skeletal muscle; ASMI, appendicular skeletal muscle index; BMI, body mass index; FMI, fat mass index; G, gynoid; LMI, lean mass index; WHR, waist to hip ratio; others, see Table 1 | ||
Height, cm | 179.2 | 174.7–183.6 |
Body mass, kg | 87.3 | 78.7–98 |
BMI, kg/m2 | 27.08 | 24.6–30.2 |
Waist circumference, cm | 94 | 86–102 |
Hip circumference, cm | 100.5 | 96–106 |
WHR | 0.93 | 0.9–1 |
Total fat mass, kg | 25.21 | 19.9–31.4 |
FMI, kg/m2 | 7.82 | 6.1–9.7 |
Total lean mass, kg | 59.91 | 54.9–64.7 |
LMI, kg/m2 | 18.45 | 17.3–20 |
Visceral mass, kg | 1.46 | 0.9–2.2 |
A/G fat ratio | 0.73 | 0.6–0.9 |
A/total fat ratio | 0.1 | 0.1–0.1 |
G/total fat ratio | 0.14 | 0.1–0.2 |
ASM, kg | 28.56 | 25.9–31.6 |
ASMI, kg/m2 | 8.93 | 8.1–9.7 |
Median serum concentrations of tT, fT, and SHBG were assessed in the following subpopulations according to participants’ age: 20–34 years old, 25–39 years old, and 40–64 years old. Detailed data are shown in Table 3 and Figure 1.
Age, y | Participants, n | Total testosterone, ng/ml | Free testosterone, pmol/l | Sex hormone–binding globulin, nmol/l |
Data are shown as median and interquartile range. | ||||
20–34 | 198 | 4.7 (3.47–5.79) | 359.83 (296.35–431.31) | 31.14 (23.36–40.83) |
35–49 | 272 | 4.34 (3.36–5.68) | 342.9 (280.57–402.2) | 33.34 (24.77–46.3) |
50–64 | 231 | 4.21 (3.24–5.6) | 307.86 (261.75–375.15) | 43.35 (32.11–56.89) |
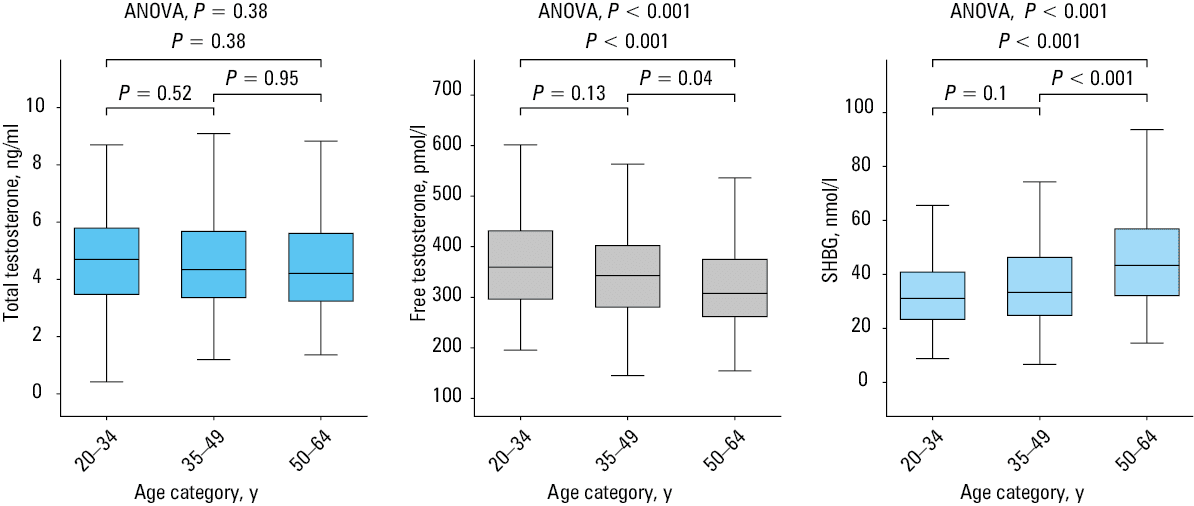
In addition, the concentrations of tT, fT, and SHBG in the study population by 5‑year age range are presented in Supplementary material (Table S1 and Figure S2).
Analysis of serum concentration of total testosterone and selected anthropometric parameters
In the subsequent analysis, the dependent variable was serum concentration of tT. In the univariable analysis, SHBG, FSH, PRL, and all selected anthropometric parameters were significantly associated with serum concentration of tT. No association was observed between serum levels of tT and age within the study population. In the multiple linear regression model adjusted for age (Model 1), all selected anthropometric parameters remained significantly related to serum concentration of tT. However, the association with FSH was insignificant. In the multiple linear regression model adjusted for age and FMI (Model 2), WHR and fat distribution parameters were significant. A higher WHR and android body fat distribution were associated with lower tT serum concentrations. Accordingly, the subsequent Model 3 was adjusted for age, FMI, and WHR. The G/total fat ratio was still significantly positively associated with tT concentration, whereas for the A/G ratio the association was negative (Table 4).
Variable | Univariable analysis | Model 1 | Model 2 | Model 3 | ||||||||
B | P value | R2 | B | P value | Adjusted R2 | B | P value | Adjusted R2 | B | P value | Adjusted R2 | |
Model 1: adjusted for age
Model 2: Model 1 adjusted for FMI
Model 3: Model 2 adjusted for WHR
a Variables with a skewed distribution were log‑transformed prior to regression analysis.
b Excluded due to strong correlation (|r| >0.8) between independent variable and covariate (FMI)
| ||||||||||||
Age, y | –0.002 | 0.22 | 2 | – | – | – | – | – | – | – | – | – |
Sex hormone–binding globulina, nmol/l | 0.53 | <0.001 | 0.408 | 0.606 | <0.001 | 0.474 | 0.517 | <0.001 | 0.495 | 0.51 | <0.001 | 0.497 |
Cortisola, µg/dl | 0.085 | 0.08 | 0.005 | 0.08 | 0.08 | 0.004 | –0.036 | 0.52 | 0.206 | –0.025 | 0.71 | 0.22 |
Dehydroepiandro- steronea, µg/dl | –0.018 | 0.54 | 1 | –0.064 | 0.08 | 0.004 | –0.052 | 0.2 | 0.208 | –0.049 | 0.28 | 0.222 |
Luteinizing hormonea, mIU/ml | 0.05 | 0.15 | 0.003 | 0.053 | 0.1 | 0.003 | 0.065 | 0.07 | 0.211 | 0.062 | 0.1 | 0.224 |
Follicle‑stimulating hormonea, mIU/ml | –0.056 | 0.046 | 0.007 | –0.051 | 0.08 | 0.004 | –0.053 | 0.1 | 0.21 | –0.048 | 0.15 | 0.223 |
Prolactina, µIU/ml | 0.087 | 0.03 | 8 | 0.081 | 0.03 | 0.006 | 0.117 | 0.01 | 0.218 | 0.11 | 0.01 | 0.231 |
eGFR, ml/min/1.73 m2 | –0.001 | 0.23 | 2 | –0.003 | 0.02 | 0.007 | –0.002 | 0.15 | 0.209 | –0.002 | 0.35 | 0.221 |
BMIa, kg/m2 | –1.012 | <0.001 | 153 | –1.084 | <0.001 | 0.157 | –b | –b | –b | –b | –b | –b |
WHR | –1.83 | <0.001 | 101 | –2.381 | <0.001 | 0.12 | –0.979 | 0.002 | 0.22 | – | – | – |
FMIa, kg/m2 | –0.473 | <0.001 | 195 | –0.518 | <0.001 | 0.207 | – | – | – | – | – | – |
LMI, kg/m2 | –0.039 | <0.001 | 35 | –0.039 | <0.001 | 0.031 | –0.001 | 0.88 | 0.205 | 0.004 | 0.71 | 0.219 |
Visceral massa, kg | –0.231 | <0.001 | 184 | –0.308 | <0.001 | 0.236 | –b | –b | –b | –b | –b | –b |
A/G fat ratio | –0.694 | <0.001 | 129 | –0.951 | <0.001 | 0.166 | –0.487 | <0.001 | 0.233 | –0.41 | 0.005 | 0.234 |
A/total fat ratio | –9.001 | <0.001 | 167 | –11.589 | <0.001 | 0.204 | –b | –b | –b | –b | –b | –b |
G/total fat ratio | 5.322 | <0.001 | 58 | 7.232 | <0.001 | 0.071 | 3.978 | <0.001 | 0.225 | 3.017 | 0.03 | 0.228 |
ASMI, kg/m2 | –0.082 | <0.001 | 53 | –0.082 | <0.001 | 0.049 | –0.01 | 0.54 | 0.206 | –0.004 | 0.81 | 0.219 |
In the cohort of young men aged 20–34 years, similar parameters were related to serum concentration of tT in the univariable analysis and in Model 1, with the exception of LMI. In Model 2, the A/G ratio and WHR remained negatively related with tT. In the final Model 3, no other anthropometric measurements were associated with tT concentration. In this group, the association of tT concentrations with FSH, PRL, and SHBG was particularly strong (Supplementary material, Table S2).
In the cohort of men aged 35–49 years, an additional association was identified between LMI and ASMI in Model 3. In this age group, significant associations were observed between serum concentrations of tT and renal function parameters, with lower eGFRs associated with higher tT concentrations. In this group, tT concentrations exhibited a negative association with DHEA and a positive association with SHBG (Supplementary material, Table S3).
In the group of men aged 50–64 years old, the differences in serum concentrations of tT were associated with differences in FMI, LMI and ASMI (Supplementary material, Table S4).
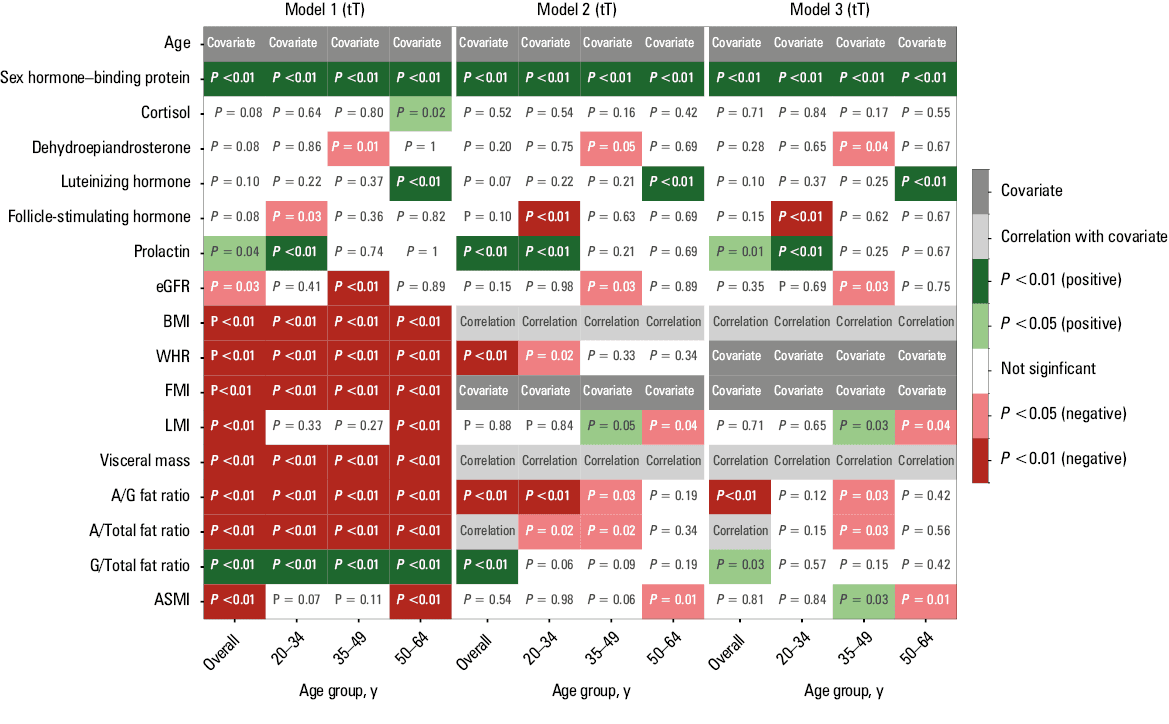
In conclusion, there was no association between serum concentration of tT and age within the study group. In the overall study population and in the group aged 20–34 years, serum concentrations of tT were negatively related to body fat mass and android fat distribution. In the group of men aged 35–49 years, serum concentrations of tT were negatively associated with body fat mass and android fat distribution and positively associated with body lean mass. However, tT concentration was mainly related to body fat mass and body lean mass in the group of men aged 50–64 years. In Figure 2, we present a heatmap that succinctly summarizes the findings.
Analysis of serum concentration of free testosterone and selected anthropometric parameters
In the subsequent analysis, the dependent variable was the serum concentration of fT. In the univariable analysis, age, SHBG, FSH, DHEA, PRL, and all anthropometric parameters were significantly associated with serum concentration of fT. In the multiple linear regression model adjusted for age (Model 1), only the association with DHEA was no longer significant. In the multiple linear regression model adjusted for age and FMI (Model 2), SHBG, FSH, and PRL remained significant. In Model 3, there was a significant positive association between SHBG, prolactin, and FSH and serum concentration of fT (Table 5).
Variable | Univariable analysis | Model 1 | Model 2 | Model 3 | ||||||||
B | P value | R2 | B | P value | Adjusted R2 | B | P value | Adjusted R2 | B | P value | Adjusted R2 | |
Model description: see Table 4
a Variables with a skewed distribution were log‑transformed prior to regression.
b Excluded due to strong correlation (|r|>0.8) between independent variable and covariate (FMI)
Abbreviations: see Table 4 | ||||||||||||
Age, y | –0.004 | <0.001 | 0.029 | – | – | – | – | – | – | – | – | – |
Sex hormone–binding proteina, nmol/l | 0.216 | <0.001 | 0.107 | 0.277 | <0.001 | 0.187 | 0.517 | <0.001 | 0.495 | 0.182 | <0.001 | 0.228 |
Cortisola, µg/dl | 0.069 | 0.06 | 0.005 | 0.056 | 0.13 | 0.03 | –0.036 | 0.89 | 0.206 | –0.007 | 0.96 | 0.171 |
Dehydroepiandro- steronea, µg/dl | 0.052 | 0.02 | 0.008 | –0.015 | 0.63 | 0.027 | –0.052 | 0.93 | 0.208 | –0.005 | 0.96 | 0.171 |
Luteinizing hormonea, mIU/ml | –0.005 | 0.87 | 0 | 0.002 | 0.93 | 0.026 | 0.065 | 0.93 | 0.211 | <0.001 | 0.98 | 0.171 |
Follicle‑stimulating hormonea, mIU/ml | –0.101 | <0.001 | 0.034 | –0.077 | <0.001 | 0.043 | –0.053 | 0.001 | 0.21 | –0.081 | 0.002 | 0.19 |
Prolactina, µIU/ml | 0.091 | 0.002 | 0.014 | 0.069 | 0.02 | 0.034 | 0.117 | 0.005 | 0.218 | 0.096 | 0.006 | 0.185 |
eGFR, ml/min/1.73 m2 | 0 | 0.87 | 0 | –0.003 | 0.002 | 0.04 | –0.002 | 0.054 | 0.209 | –0.002 | 0.11 | 0.221 |
BMIa, kg/m2 | –0.736 | <0.001 | 0.131 | –0.697 | <0.001 | 0.131 | –b | –b | –b | –b | –b | –b |
WHR | –1.478 | <0.001 | 0.107 | –1.507 | <0.001 | 0.104 | –0.979 | 0.07 | 0.22 | – | – | – |
FMIa, kg/m2 | –0.346 | <0.001 | 0.169 | –0.338 | <0.001 | 0.167 | – | – | – | – | – | – |
LMI, kg/m2 | –0.025 | <0.001 | 0.022 | –0.02 | 0.007 | 0.036 | –0.001 | 0.53 | 0.205 | 0.01 | 0.39 | 0.173 |
Visceral massa, kg | –0.169 | <0.001 | 0.159 | –0.186 | <0.001 | 0.16 | –b | –b | –b | –b | –b | –b |
A/G fat ratio | –0.508 | <0.001 | 0.112 | –0.537 | <0.001 | 0.11 | –0.487 | 0.07 | 0.233 | –0.119 | 0.44 | 0.173 |
A/total fat ratio | –6.467 | <0.001 | 0.139 | –6.769 | <0.001 | 0.137 | –b | –b | –b | –b | –b | –b |
G/total fat ratio | 3.981 | <0.001 | 0.053 | 3.51 | <0.001 | 0.051 | 1.272 | 0.22 | 0.169 | 0.509 | 0.81 | 0.171 |
ASMI, kg/m2 | –0.047 | <0.001 | 0.028 | –0.042 | 0.001 | 0.045 | 0.008 | 0.67 | 0.166 | 0.012 | 0.52 | 0.172 |
In the group of young men aged 20–34 years, in the univariable analysis in Model 1, similar parameters were related to serum concentration of fT (BMI, WHR, visceral mass, A/G ratio, A/total fat ratio), except for LMI and ASMI. In Models 2 and 3, none of the body mass parameters remained associated with fT level (Supplementary material, Table S5).
In the group of men aged 35–49 years, body fat mass and body lean mass parameters were most strongly associated with fT concentration. In this age group, serum concentrations of fT were associated with renal function parameters. Lower eGFR was associated with higher serum concentrations of fT (Supplementary material, Table S6).
In the group of men aged 50–64 years, serum concentrations of fT depended on body fat mass only (Supplementary material, Table S7).
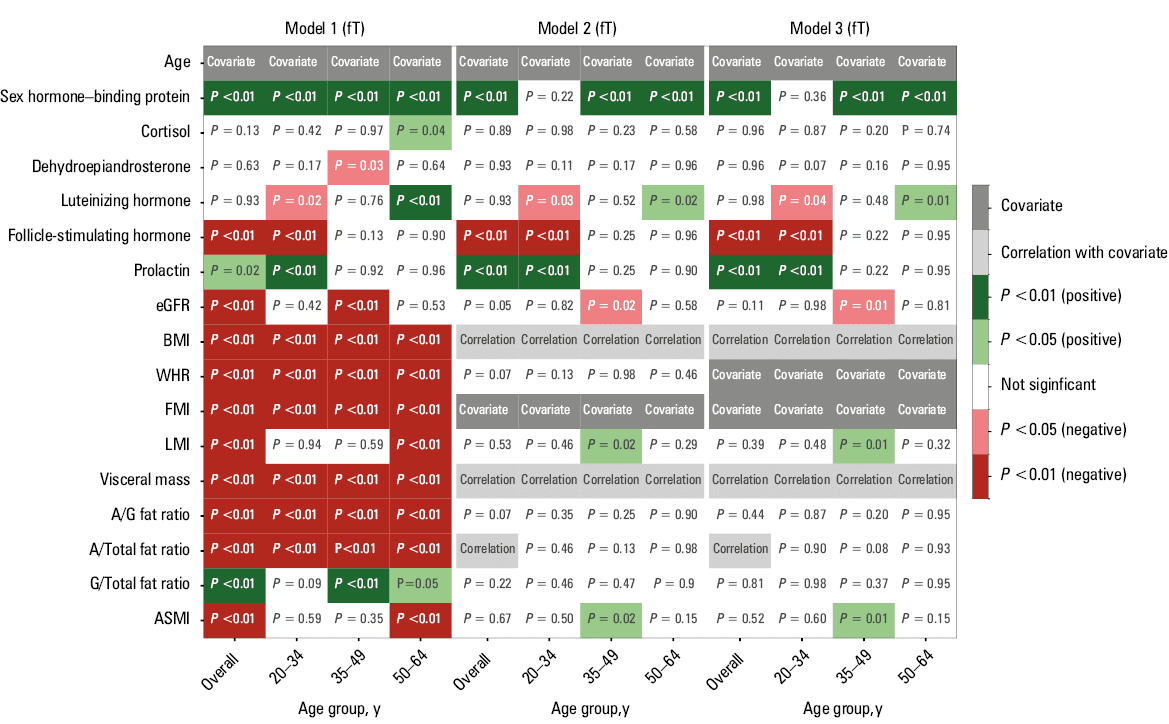
We found that serum concentrations of fT decreased with age within the study population. In the total study group and in the younger men (aged 20–34 years), serum concentration of fT was negatively associated with body fat mass and android fat distribution. In the age groups of 35–49 and 50–64 years, serum concentrations of fT were most strongly negatively associated with body fat mass and positively associated with body lean mass. In Figure 3, we present a heatmap that succinctly summarizes the findings.
Discussion
The analysis of our study cohort demonstrated that median (IQR) serum concentration of tT was 4.39 (3.4–5.7) ng/ml and median serum concentration of fT was 339.41 (277.4–403.7) pmol/l. There was no association between serum concentration of tT and age within the study population, while serum concentration of fT decreased with age. Serum concentration of tT in the entire group was negatively associated with greater body fat mass and android body fat distribution. However, this association changed with age. Higher body fat mass and android body fat distribution were associated with lower serum concentrations of tT in the younger men. In the older group, we observed no association of tT levels with body fat mass distribution, but a positive association with body lean mass was visible. Similarly, in the overall cohort and within each age subgroup, lower fT concentrations were associated with higher body fat mass. However, a positive association between lean body mass and fT levels was observed only among men aged 35–49 years.
There are limited data available on serum levels of tT and fT that are representative of the general population of Poland. Hereby, we report on tT and fT levels in men in the Bialystok PLUS study population. The mean values of tT and fT serum levels that we obtained in our population are similar to those reported in previous research.20 In the past decades, studies have shown that serum concentrations of tT and fT were lower in the older population than the younger ones.4,21,22 In our study, this phenomenon was no longer observed for tT concentrations. According to the current literature, it is still true that serum testosterone levels decrease individually with age.24 It is just that at present the younger men have similarly low serum levels of tT that are concurrently observed in the older population. Grandys et al23 found no significant difference in tT concentrations between younger and older men. This suggests ongoing decrease in serum concentrations of tT in the young population. In the National Health and Nutrition Examination Survey, Vesper et al24 found that tT concentrations in the United States population were higher at the age of 55–60 years than at 35 and 80 years. However, the authors speculated that this may have been related to increased testosterone supplementation in men over the age of 40 years. Kelsey et al25 showed that serum concentrations of tT peak at 19 years of age, and thereafter decline slowly with an individual’s aging. They also found no evidence of a decline in tT concentrations after 40 years of age into old age.25
In our study, serum levels of fT were lower in older than younger men. This is in line with current epidemiologic literature.26-28
As confirmed by the Naelitz et al,29 elevated serum levels of PRL are a known cause of male hypogonadism, which results in testosterone deficiency, low libido, and erectile dysfunctions. In our study, serum concentration of tT was positively associated with serum PRL level. In a study by Sodi et al,30 exogenous testosterone supplementation caused an increase in PRL levels, which could be explained by aromatization of exogenous testosterone to estradiol, which then could be responsible for stimulation of the anterior lobe of the pituitary gland resulting in increased PRL production.
Obesity is widely recognized as a major public health problem, and its prevalence has increased significantly in recent decades.31 Obesity is one of the causes of male hypogonadism. Adipose tissue in men has higher aromatase activity, which is responsible for converting testosterone to estradiol.32 Differentiation of pluripotent stem cells into adipocytes can be promoted by testosterone deficiency, resulting in an increased risk of obesity.33-35 Measurements of BMI and WHR are among the main tools used to assess obesity, and they are most commonly used in studies evaluating the relationship between tT levels and obesity. Many researchers have investigated the relationship between tT and anthropometric parameters. Our study showed that body mas and body fat mass were negatively associated with serum concentration of tT adjusted for age. This negative association between serum levels of tT and higher body mass was also demonstrated in studies from China,36 Turkey37 or the United States.38 Baydilli et al39 found that after adjusting for age, there was a significant negative correlation between increasing BMI and tT levels. However, there are papers showing no association between tT and BMI after adjustment for age.40 Ma et al41 found a negative association between body fat and testosterone levels in men. In our work, we showed not only a relationship between body fat mass and serum testosterone levels, but also a significant association between serum testosterone levels and body fat distribution and body lean mass. Similar findings were published by Shamin et al,42 who reported that a higher proportion of android fat negatively correlated with tT concentration. Osuna et al43 found a significant negative correlation between tT levels and BMI in an obese population.
Another study demonstrated that serum levels of tT are associated with muscle mass.44 Our results also showed a positive association between serum concentration of tT and lean body mass in the older age group only.
Limitations
Despite providing valuable insights into tT and fT levels in the general population, this study has several limitations. First, the cross‑sectional design precludes establishing causality between observed hormone levels and potential influencing factors (eg, age, lifestyle, comorbidities). Second, although the sample was intended to be representative, regional and demographic biases may limit wider applicability of the results. Third, confounding variables, such as dietary habits or undiagnosed medical conditions were not fully accounted for, which may have affected the results. On the other hand, we also verified the use of medications from the groups of hormones and related substances (ATC code L02A) and androgens (ATC code G03B) that might affect testosterone levels. Individuals taking these drugs were excluded from the study. Fourth, we did not account for potential seasonal variations in testosterone levels. However, diurnal fluctuations were minimized by collecting blood samples always at the same time of day. Finally, we assumed a linear relationship in our regression analyses. This approach may overlook nonlinear relationships between testosterone levels and anthropometric parameters. Future research should explore potential nonlinear associations using alternative modelling approaches. These limitations should be considered when interpreting the study findings and in the design of future research.
Conclusions
In our study, serum levels of tT in the general population did not differ in different age groups; however, fT levels decreased with age. Serum concentrations of testosterone were related to body fat mass, body fat distribution, and body lean mass. In the age categories, they depended on different parameters. In the overall population and across all age groups, higher fat mass was linked to lower serum concentrations of tT and fT. In younger men, an android pattern of fat distribution was associated with lower tT levels, whereas greater lean body mass in older men was tied to higher tT and fT concentrations.
- Finkelstein JS, Lee H, Burnett‑Bowie SA, et al. Gonadal steroids and body composition, strength, and sexual function in men. N Engl J Med. 2013; 369: 1011‑1022. | Crossref
- Finkelstein JS, Lee H, Leder BZ, et al. Gonadal steroid‑dependent effects on bone turnover and bone mineral density in men. J Clin Invest. 2016; 126: 1114‑1125. | Crossref
- Andersson AM, Jensen TK, Juul A, et al. Secular decline in male testosterone and sex hormone binding globulin serum levels in Danish population surveys. J Clin Endocrinol Metab. 2007; 92: 4696‑4705. | Crossref
- Nyante SJ, Graubard BI, Li Y, et al. Trends in sex hormone concentrations in US males: 1988‑1991 to 1999‑2004. Int J Androl. 2012; 35: 456‑466. | Crossref
- Perheentupa A, Mäkinen J, Laatikainen T, et al. A cohort effect on serum testosterone levels in Finnish men. Eur J Endocrinol. 2013; 168: 227‑233. | Crossref
SUPPLEMENTARY MATERIAL
ARTICLE INFORMATION