
Prediabetes‑related inflammatory biomarkers modulate left ventricular diastolic function in patients with heart failure with preserved ejection fraction

 CC BY 4.0
Prediabetes‑related inflammatory biomarkers modulate left ventricular diastolic function in patients with heart failure with preserved ejection fraction
CC BY 4.0
Introduction
Prediabetes is a metabolic state characterized by elevated blood glucose levels that are higher than normal but below the diagnostic threshold for type 2 diabetes (T2D).1 Patients with prediabetes are at a high risk of progression to T2D, and are more likely to develop heart failure (HF) than the general population. Left ventricular diastolic dysfunction (LVDD) is an early indicator of cardiac damage that impairs LV filling and stroke volume, increasing the risk of HF and adverse cardiovascular outcomes.2 It is the most commonly implicated mechanism in the pathogenesis of HF with preserved ejection fraction (HFpEF). LVDD is increasingly recognized as a metabolic consequence of various cardiac, vascular, and noncardiac abnormalities, such as diabetes mellitus.3,4
Our recent research explored the impact of inflammation on LVDD, highlighting a strong relationship between inflammatory responses and cardiac remodeling in individuals with LVDD.5 These findings prompted further investigation into the specific role of prediabetes‑related inflammation in HFpEF patients with LVDD. Given the increasing use of insulin resistance (IR) indices as noninvasive tools for assessing glucose metabolism abnormalities, it is clinically significant to identify the most reliable IR index for evaluating prediabetic states in HFpEF patients with LVDD. Several IR indices, including the triglyceride glucose (TyG) index, estimated glucose disposal rate (eGDR), triglyceride / high‑density lipoprotein cholesterol (TG/HDL‑C) ratio, metabolic score for insulin resistance (METS‑IR), and homeostatic model assessment of insulin resistance (HOMA‑IR), have been widely used in IR assessment due to their simplicity and noninvasiveness. Identifying the optimal index for predicting LVDD in prediabetes would enhance our understanding of the relationship between prediabetes‑related inflammation and LVDD.
This study compared the predictive value of 5 IR indices to identify the most reliable one for assessing prediabetes associated with LVDD. Furthermore, it examined prediabetes‑related inflammatory biomarkers and evaluated the impact of prediabetes on prognosis in HFpEF patients with LVDD, providing deeper insights into the relationship between prediabetes, inflammation, and LVDD (Supplementary material, Figure S1).
Patients and methods
Study cohort
Study participants were screened and recruited at the Affiliated Hospital of Jiangsu University, between March 2017 and January 2018, based on the following inclusion criteria: 1) a diagnosis of HFpEF; 2) age above 18 years. The diagnostic criteria for HFpEF are listed in Supplementary material, Methods. Patients were excluded for the following reasons: valvular heart disease or a history of cardiac surgery, myocardial infarction, atrial fibrillation, mitral stenosis or severe mitral calcification, severe mitral or aortic regurgitation, malignancy, hypothyroidism, lack of clinical follow‑up data, and poor‑quality echocardiographic images. Individuals with unavailable echocardiographic or laboratory data were also excluded. Left ventricular diastolic function (LVDF) was assessed using echocardiography, with LVDD grading performed according to the 2016 American Society of Echocardiography / European Association of Cardiovascular Imaging guidelines.6
The enrolled patients were divided into 2 groups based on LVDF parameters measured on echocardiography: the LVDD group (n = 76) and the non‑LVDD group (n = 44).
Validation cohort
The study findings were validated using an external cohort comprising 513 patients admitted to the inpatient ward of the Department of Cardiology at the Affiliated Hospital of Jiangsu University between 2021 and 2022. The inclusion criteria for this cohort were identical to those applied in the study cohort.
Insulin resistance indices
The IR indices were calculated using the following formulas: 1) TyG index = ln(TG [mg/dl] × glycemia [mg/dl]/2)7,8; 2) eGDR (mg/kg/min) = 21.158 − (0.09 × waist circumference [cm]) − (3.407 × hypertension [yes = 1, no = 0]) − (0.551 × glycated hemoglobin [HbA1c; %])9,10; 3) METS‑IR = ln(2 × glycemia [mg/dl] + TG [mg/dl]) × body mass index (kg/m2)/ ln(HDL‑C [mg/dl])11; 4) TG/HDL‑C ratio = TG (mg/dl)/HDL‑C (mg/dl)10,12; and 5) HOMA‑IR = fasting plasma glucose (mmol/l) × fasting insulin (mIU/l)/22.5.13
Follow‑up
The patients in the study cohort were followed regularly at 3, 6, 9, 12, 18, 24, and 30 months, while those in the validation cohort were followed at 3, 6, 12, 18, and 24 months. Follow‑up assessments were conducted through clinical visits and telephone interviews to document the occurrence of the primary end point, which included all‑cause mortality and major cardiac events, defined as cardiac death, acute myocardial infarction, hospitalization for acute HF, and stroke. Given the observational nature of this study, no interventions were made that would affect the diagnostic procedure or treatment plans.
Identification of differentially expressed genes and functional enrichment analysis
Differentially expressed genes (DEGs) in the HFpEF expression profile (GSE192886) were identified using the R package “limma” (v3.44.3; R Foundation for Statistical Computing, Vienna, Austria), with the selection criteria set to an adjusted P value below 0.05 and an absolute value of log2 fold change greater than 0.5. The DEGs were visualized using the “pheatmap” and “ggplot2” (v1.0.12) R packages. The Gene Ontology (GO) and Kyoto Encyclopedia of Genes and Genomes pathway enrichment analyses of the DEGs were performed using the R package “clusterProfiler” (v3.16.1).
Statistical analysis
Descriptive statistics were expressed as either mean (SD) or median (interquartile range) based on the data distribution. Continuous variables were analyzed using the analysis of variance or the Mann–Whitney test, as appropriate. Bivariate correlations were assessed using the Spearman rank correlation tests. A receiver operating characteristic (ROC) curve analysis was conducted. The Youden index was used to identify the optimal cutoff point (calculated as sensitivity + specificity – 1) for each IR index. The Cox proportional hazard regression models were built to evaluate the relationships between individual IR indices, prediabetes‑related inflammatory biomarkers, and the primary end point. Survival curves for the primary end point were analyzed using the Kaplan–Meier method and log‑rank tests. All statistical analyses were performed using the SPSS software, version 19 (IBM Corp., Chicago, Illinois, United States) and GraphPad Prism, version 8 (GraphPad Software, San Diego, California, United States). P values below 0.05 were considered significant.
Ethics
This study was approved by the Ethics Committee of the Affiliated Hospital of Jiangsu University (SWYXLL20170601). Due to changes in hospital requirements, a separate approval was obtained for the analysis of the validation cohort (SWYXLL20200121‑2). All patients provided their informed consent to participate in the study.
Results
Baseline characteristics
Baseline clinical and echocardiographic characteristics of the study group (n = 120) are presented in Supplementary material, Tables S1 and S2. In comparison with the non‑LVDD group, the patients with LVDD exhibited higher systolic blood pressure, HbA1c concentration, tricuspid regurgitation velocity, left atrial volume index, ratio of peak velocity of early diastolic transmitral flow to peak velocity of early diastolic mitral annular motion (E/e′) at the septum, e′ velocity at the septum, E/e′ ratio at the lateral wall, and average E/e′ ratio. Conversely, these patients demonstrated lower color flow propagation velocity, e′ velocity at the lateral wall, and average e′ velocity than the non‑LVDD group.
Identification of prediabetes‑related inflammatory biomarkers associated with left ventricular diastolic dysfunction in patients with heart failure with preserved ejection fraction
To identify prediabetes‑related inflammatory biomarkers specifically associated with LVDD, first, inflammatory biomarkers associated with prediabetes and LVDD were identified in the whole study cohort. Next, inflammatory response–related DEGs in the HFpEF patients were identified using the GSE192886 dataset. By cross‑referencing abnormal inflammatory biomarkers associated with prediabetes, LVDD, and HFpEF, we identified prediabetes‑related inflammatory biomarkers specific to LVDD in HFpEF patients.
A total of 27 inflammatory biomarkers were analyzed using the Luminex assay (Luminex Corp., Austin, Texas, United States) to identify specific inflammatory biomarkers associated with prediabetes in LVDD patients. Among these, the levels of interleukin (IL)-6, IL‑8, IL‑17, and C‑C motif chemokine ligand 5 (CCL5) were significantly higher in the LVDD patients with prediabetes than in those without prediabetes (Figure 1A; Supplementary material, Figure S2A).
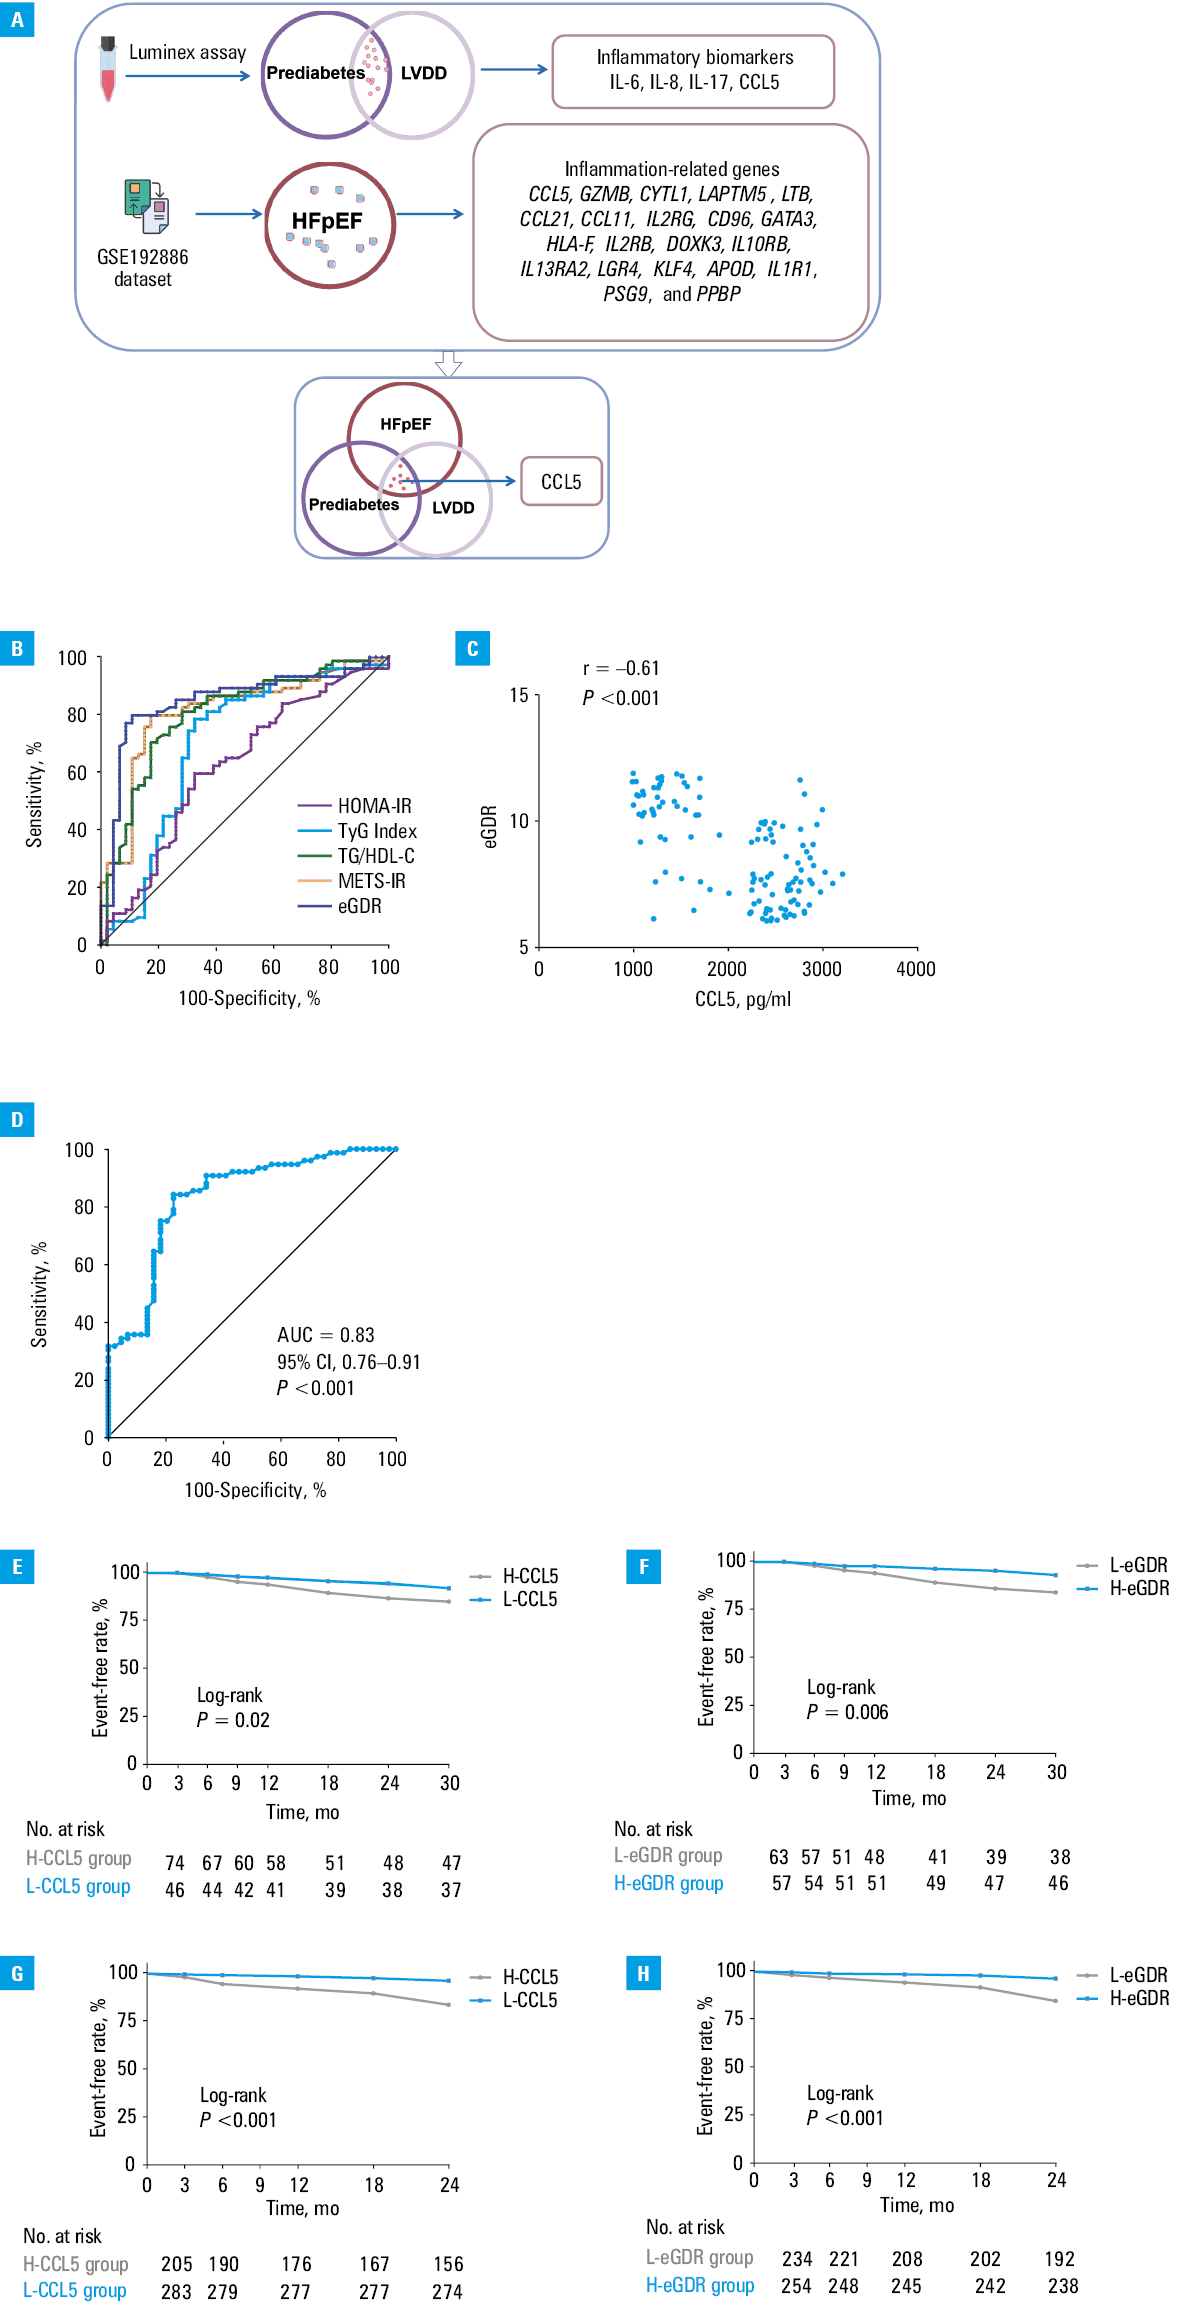
Abbreviations: AUC, area under the curve; CCL5, C‑C motif chemokine ligand 5; eGDR, estimated glucose disposal rate; HFpEF, heart failure with preserved ejection fraction; HOMA‑IR, homeostatic model assessment of insulin resistance; IL, interleukin; LVDD, left ventricular diastolic dysfunction; METS‑IR, metabolic score for insulin resistance; TG/HDL‑C, the triglyceride / high‑density lipoprotein cholesterol ratio; TyG index, the triglyceride glucose index
The GSE192886 dataset was used to further evaluate the inflammatory profile in HFpEF patients. A total of 243 DEGs were identified in the epicardial adipose tissue of these patients, including 146 upregulated and 97 downregulated genes. These DEGs are visualized using volcano plots and heatmaps (Supplementary material, Figure S2B). The results of the GO analysis are shown in Supplementary material, Figure S3. Furthermore, overlap analysis of inflammatory response–related genes from the Human Protein Atlas and GSE192886 dataset identified 21 inflammatory response–related genes among the 243 DEGs, including 15 upregulated and 6 downregulated ones (Supplementary material, Table S3).
Among the identified genes, CCL5 was the only significant one overlapping with the prediabetes‑related biomarkers (IL‑6, IL‑8, IL‑17, and CCL5) identified using the Luminex assay (Figure 1A). These findings suggest that CCL5 may potentially serve as a prediabetes‑related inflammatory biomarker in HFpEF patients with LVDD. We found that CCL5 levels were significantly elevated in the LVDD group, as compared with the non‑LVDD group (P <0.001; Supplementary material, Figure S4A).
Identification of the optimal insulin resistance index for predicting prediabetes in patients with heart failure with preserved ejection fraction and left ventricular diastolic dysfunction
In the study cohort, the left ventricular end‑diastolic pressure, measured via LV catheterization, was used to represent LV stiffness. We observed that all analyzed IR indices (TyG index, METS‑IR, TG/HDL‑C ratio, eGDR, and HOMA‑IR) were significantly associated with LV stiffness. The TyG index (R = 0.44; P <0.001), METS‑IR (R = 0.71; P <0.001), TG/HDL‑C (R = 0.61; P <0.001), and HOMA‑IR (R = 0.27; P = 0.003) positively correlated with LVEDP, while a negative correlation with LVEDP was observed for eGDR (R = −0.73; P <0.001; Supplementary material, Figure S5).
The ROC analysis demonstrated significant diagnostic accuracy of all 5 IR indices (Figure 1B). Among them, eGDR exhibited the highest diagnostic accuracy in predicting LVDD (area under the curve [AUC] = 0.85; 95% CI, 0.77–0.92; P <0.001), with a cutoff value of 9.11. Based on the eGDR cutoff value, the patients were divided into 2 groups with low (L) and high (H) eGDR (L‑eGDR group, eGDR <9.11; n = 63; H‑eGDR group, eGDR ≥9.11; n = 57). The eGDR value correlated negatively with CCL5 levels (R = −0.61; P <0.001; Figure 1C). Furthermore, CCL5 levels were markedly elevated in the L‑eGDR group, as compared with the H‑eGDR group (P <0.001; Supplementary material, Figure S4B), suggesting that CCL5 potentially reflects the inflammatory state associated with prediabetes.
Association of prediabetes and prediabetes‑related biomarkers with left ventricular diastolic dysfunction and clinical trajectory
The relationship between inflammatory biomarkers and LVDD was assessed using multivariable‑adjusted models. The Cox regression analysis showed that lower eGDR (hazard ratio [HR], 1.55; 95% CI, 1.21−2.09) and elevated CCL5 levels (HR, 1.57; 95% CI, 1.13−2.11) were significantly associated with an increased risk of LVDD (Supplementary material, Figure S4C and Table S4). In the ROC analysis, CCL5 demonstrated significant diagnostic utility in predicting LVDD (AUC = 0.83; 95% CI, 0.76–0.91; P <0.001; Figure 1D), with a cutoff value of 1698 pg/ml. Based on this threshold, the patients were categorized into 2 groups: the L‑CCL5 group (CCL5 <1698 pg/ml; n = 46) and the H‑CCL5 group (CCL5 ≥1698 pg/ml; n = 74). During 30 months of follow‑up, 36 participants (30%) reached the composite primary end point. Elevated CCL5 levels and reduced eGDR were significantly associated with a higher incidence of adverse cardiac events and all‑cause mortality (Figure 1E and 1F).
Validation of prediabetes and prediabetes‑related biomarkers in an independent cohort
In the validation cohort, the patients were classified into 2 groups based on LVDF parameters measured on echocardiography: the LVDD group, comprising individuals with different LVDD grades (n = 229); and the non‑LVDD group, comprising individuals with normal LVDF (n = 284). Baseline clinical and echocardiographic characteristics of the patients in the validation cohort are presented in Supplementary material, Tables S5 and S6. eGDR values were elevated in the non‑LVDD group, as compared with the LVDD group (P <0.001), whereas CCL5 levels were reduced in the non‑LVDD group, as compared with the LVDD group (P <0.001; Supplementary material, Figure S6A and S6B).
The validation cohort was further stratified into 2 groups based on the eGDR cutoff value: the L‑eGDR group (eGDR <9.11; n = 254) and the H‑eGDR group (eGDR ≥9.11; n = 259). The proportion of patients with normal LVDF was analyzed across these groups. We observed a higher proportion of patients with normal LVDF in the H‑eGDR group than in the L‑eGDR group (P <0.001; Supplementary material, Figure S6C). The patients were also stratified based on the CCL5 cutoff value into the L‑CCL5 group (CCL5 <1698 pg/ml; n = 290) and the H‑CCL5 group (CCL5 ≥1698 pg/ml; n = 223). The Kaplan–Meier curves showed that the individuals with lower eGDR and higher CCL5 levels were at a significantly increased risk of the primary end point occurrence (Figure 1G and 1H).
Discussion
To our best knowledge, this study is the first to investigate the relationship between prediabetes‑related inflammation and prognosis in HFpEF patients with LVDD. By enrolling a unique cohort of patients with LVDD who underwent LV catheterization, we ensured a standardized definition of LVDD based on physiological criteria. Additionally, this study evaluated the most effective IR index for predicting LVDD in prediabetic states. The results indicated that prediabetes and a prediabetes‑related biomarker, CCL5, were significantly associated with an increased risk of LVDD, providing valuable prognostic information for this condition.
Metabolic disorders, particularly prediabetes, play a crucial role in the development of HF. Prediabetes contributes to the pathogenesis of obesity, T2D, chronic renal failure, and cardiovascular disease.14 In prediabetic states, several pathophysiological changes, including metabolic disturbances, oxidative stress, endothelial dysfunction, heightened inflammation, and renin‑angiotensin‑aldosterone system hyperactivity contribute to cardiovascular comorbidities, such as hypertension, coronary disease, metabolic syndrome, kidney disease, and obesity.15,16 Although prediabetes is recognized as a major risk factor for LVDD, the precise mechanisms by which it contributes to LVDD remain elusive. LVDD is modulated by myocardial relaxation and chamber stiffness, and abnormal glucose metabolism plays a crucial role in its pathogenesis. Chronic glucose dysregulation increases LV diastolic stiffness and reduces chamber compliance, resulting in adverse cardiac remodeling.17 For instance, cardiomyocyte stiffness is elevated in patients with diabetes, and chronic exposure to abnormal glucose metabolism induces a mild proinflammatory state. This proinflammatory state promotes endothelial senescence, systemic endothelial dysfunction, and coronary microvasculature impairment, leading to adverse ventricular remodeling and cardiac fibrosis.18 Several indices, including the TyG index, METS‑IR, TG/HDL‑C ratio, eGDR, and HOMA‑IR, are considered reliable indicators of IR.9 Among these, we identified eGDR as the most diagnostically accurate index for predicting LVDD, highlighting its potential as a simple, reproducible, and pragmatic marker for assessing prediabetes.
Furthermore, this study investigated the relationship between prediabetes‑related inflammation and LVDD. The results showed that elevated CCL5 levels were associated with lower eGDR and a higher incidence of adverse cardiac events and all‑cause mortality in the LVDD patients. CCL5 is well known for its role in stimulating immune cell migration as well as activation of T cells, macrophages, platelets, endothelial cells, and vascular smooth muscle cells in cardiovascular disease.19,20 In this study, CCL5 emerged as a potent inflammatory biomarker, mediating adverse cardiovascular effects through its inflammatory properties and potential contributions to LVDD in prediabetic individuals. These findings suggest that prediabetes potentially exacerbates inflammatory responses, leading to increased LV diastolic stiffness and reduced chamber compliance, thus promoting the progression of LVDD.
Several randomized controlled trials have investigated the effects of anti‑inflammatory agents on cardiovascular events in patients with atherosclerosis, hypertension, and other cardiovascular disorders.21 For example, sodium‑glucose cotransporter 2 inhibitors have been shown to reduce systemic inflammation. Our findings suggest that anti‑inflammatory therapy targeting CCL5 may serve as a promising therapeutic strategy for managing LVDD associated with glucose metabolism dysregulation.
This work has several limitations. First, it was a single‑center study with a small sample size, underscoring the need for further larger, multicenter studies. Second, the 5 IR indices were only assessed at the baseline, precluding evaluation of their changes during the follow‑up period. Third, the impact of exercise training and anti‑inflammatory diets could not be evaluated due to incomplete data during the study. Further research in diverse populations is required to validate and expand these findings.
In conclusion, this study demonstrated that prediabetes adversely affects LVDF, induces inflammatory responses, and increases the incidence of adverse cardiac events and all‑cause mortality, primarily through the modulation of CCL5 expression. Anti‑inflammatory therapies targeting CCL5 should be explored as a potential strategy for managing LVDD, particularly in HFpEF patients with prediabetes.
- Jin J. What is prediabetes? JAMA. 2023; 330: 2404. | Crossref
- Nagueh SF. Left ventricular diastolic function: understanding pathophysiology, diagnosis, and prognosis with echocardiography. JACC Cardiovasc Imaging. 2020; 13: 228‑244. | Crossref
- Jeong EM, Dudley SC, Jr. Diastolic dysfunction. Circ J. 2015; 79: 470‑477. | Crossref
- Plitt GD, Spring JT, Moulton MJ, Agrawal DK. Mechanisms, diagnosis, and treatment of heart failure with preserved ejection fraction and diastolic dysfunction. Expert Rev Cardiovasc Ther. 2018; 16: 579‑589. | Crossref
- Xu L, Chen G, Liang Y, et al. T helper 17 cell responses induce cardiac hypertrophy and remodeling in essential hypertension. Pol Arch Intern Med. 2021; 131: 257‑265. | Crossref
SUPPLEMENTARY MATERIAL
ARTICLE INFORMATION