Independent and combined associations between exposure to ambient air pollutants and mortality: a case-crossover study
Key words: air pollution, ambient temperature, case-crossover study, mixture, mortality


 CC BY-NC-SA 4.0
Independent and combined associations between exposure to ambient air pollutants and mortality: a case-crossover study
Introduction: Previous studies suggest that short‑term exposure to air pollution is associated with an increased risk of mortality. However, understanding of the combined effects of exposure to various air pollutants on mortality is limited.
Objectives: This study aimed to quantify a short‑term association between exposure to various air pollutants and death risk in the Qingpu District of Shanghai, and to evaluate the modifying effect of ambient temperature on this association.
Patients and methods: We collected daily death records from 2013 to 2019 in the Qingpu District of Shanghai. A time‑stratified case‑crossover design and conditional logistic regression modeling were employed to estimate death risk associated with exposure to air pollutants. Additionally, we utilized weighted quantile sum regression to identify the predominant air pollutants influencing death risk.
Results: For per 10 μg/m3-increase in particulate matter less than or equal to 2.5 μm in diameter (PM2.5), 8‑hour moving average concentrations for ozone (O3-8h), SO2, and NO2 concentrations, the odds ratio (95% CI) of nonaccidental death increased by a maximum of 1.009 (1.002–1.017), 1.017 (1.008–1.027), 1.051 (1.015–1.089), and 1.027 (1.010–1.045), respectively. A majority of air pollutants (excluding CO) were strongly associated with an elevated respiratory death risk, but only O3-8h and SO2 were positively associated with cardiovascular death at lag‑2 day. There was a significant positive association between the exposure to mixtures of air pollutants and both nonaccidental and respiratory death, with PM2.5 and SO2 identified as major contributors, respectively. Furthermore, the detrimental effects of O3-8h significantly intensified as temperatures rose.
Conclusions: Environmental exposure to ambient air pollutants was associated with increased death risk, especially at high temperature.
What's new?
Previous research on mortality primarily focused on understanding the combined effects of various air pollutants and has neglected the fact that they are interrelated. We analyzed data from the Qingpu District of Shanghai for the years 2013–2019 to investigate how changes in various air pollutants were associated with mortality. We found associations between individual and combined ambient air pollutants and mortality, as well as interactions between high temperatures and ozone in their effects on mortality. Our study provides evidence to support mechanistic investigations into the relationship between air pollution and mortality and informs comprehensive air pollution management strategies.

Introduction
Exposure to ambient air pollution is one of the major environmental risk factors worldwide, particularly in developing countries.1 Previous epidemiologic cohort studies from North America and Europe have established a link between increased all‑cause mortality and adverse health outcomes, primarily due to lung cancer, respiratory diseases, and cardiovascular illnesses in the case of chronic exposure to ambient air pollution.2-4 For instance, a United States–based cohort study found that for every 10 μg/m3-increase in the concentration of particulate matter less than or equal to 2.5 μm in diameter (PM2.5), the risk of death rises by 7%.5 Similarly, a multicenter European study demonstrated that long‑term exposure to traffic‑related air pollutants, such as PM2.5 and NO2, significantly increases mortality rates from lung cancer and chronic obstructive pulmonary disease (COPD).6 In China, a large‑scale epidemiologic study involving 1.6 million adults also demonstrated a significant association between exposure to PM2.5 and all‑cause mortality, with older adults being particularly vulnerable.7 Therefore, as a potentially modifiable risk factor, air pollution plays a crucial role in efforts to reduce mortality risk.
Emerging research supports biological and molecular mechanisms that establish a causal link between air pollution and increased mortality risk.8-10 Mechanistic studies indicate that exposure to air pollution may elevate the risk of death by disrupting brain function and activating the hypothalamic‑pituitary‑adrenal axis, causing abnormal serotonergic neurotransmission, and triggering neuroinflammation.8,9 Furthermore, biological mechanisms have been proposed through which exposure to PM may exacerbate cardiopulmonary toxicity associated with metabolic diseases.10 However, findings from different subgroups of patients vary, likely influenced by factors such as age, sex, and socioeconomic status.5-7 Some studies have reported no significant association between air pollution and mortality risk in certain populations, possibly due to limitations in measurement methods.4,11 Many studies rely on monitoring data collected over a limited period of time to estimate exposure levels, and focus only on the health effects of a single air pollutant, which may introduce biases in the exposure‑response relationship.4,11 Additionally, temperature may moderate the relationship between air pollution and mortality risk.12 For example, a multicity study by Qian et al13 found that the adverse health effects of PM2.5 were more pronounced in high‑temperature conditions. This suggests that the interaction between temperature and air pollution could exacerbate mortality risks. Another study further confirmed that the combined effects of air pollution and extreme temperatures significantly increase the risk of cardiovascular diseases. Specifically, in environments with extreme temperatures, high concentrations of PM (such as PM2.5) were more likely to trigger heart attacks, particularly among women and the elderly.14 Despite this, research on combined exposures remains limited, especially in coastal areas of China.15 Due to the lack of sufficient monitoring data, epidemiologic evidence on the health effects of multipollutant and meteorologic factor combinations is still inadequate. Therefore, future studies should further investigate the interaction between air pollution and temperature on mortality risk and more closely analyze different exposure patterns to address the current knowledge gap.
To fill this gap, our study employed a case‑crossover design to investigate the short‑term effects of exposure to PM2.5, 8‑hour moving average concentrations for ozone (O3-8h), NO2, SO2, and CO on death rate in the Qingpu Distric of Shanghai, China, from 2013 to 2019. We explored a potential impact of modifiers, such as age, sex, and season, to gain insights into the vulnerability of specific subgroups. Additionally, the study assessed the short‑term effects on death resulting from exposure to a combination of air pollutants. It also examined the combined impact of temperature and air pollution interactions on death.
Patients and methods
Study design
A time‑stratified case‑crossover design was employed to investigate the association between air pollutants and both nonaccidental and cause‑specific deaths. In this design, each person was considered a case on the date of death and served as their own matched control before and / or after the date of death within the same month (ie, a time stratum).16 Specifically, each case was treated as a case day on the date of death and matched with 3 or 4 control days that fell on the same weekday as the case day within the time stratum.17 This approach helps control for the effects of weekly, seasonal, and long‑term time trends.18 For instance, deaths occurring on Saturday, August 11, 2018, were defined as the time stratum, with that date designated as the case day, while all other Saturdays in August 2018 (August 4, 18, and 25) were identified as the corresponding control days. This design allows for adequate control of individual factors (eg, sex, age, race, or marital status) that are time‑invariant or unlikely to change significantly across time strata.18
Data collection
As one of the representative regions in the Yangtze river delta, the Qingpu District is designated as a key demonstration zone for the Yangtze river delta integration strategy, reflecting its role in the regional economic and ecological cooperation. It covers an area of 668.5 km2 and has a resident population of approximately 1.266 million. Administratively, the Qingpu District consists of 3 subdistricts (streets)—typically urbanized areas with dense populations—and 8 towns that include both urban and rural communities. All 11 subdivisions are directly governed by the district, with no hierarchical dependency between streets and towns.19 This study primarily focuses on the permanent residents of these 3 streets and 8 towns in the region.
Information on the deaths (both at home and health care facilities) was collected from the cause‑of‑death registration system of the Centre for Disease Control and Prevention in the Qingpu District, Shanghai. These data spanned from March 21, 2013 to June 30, 2019, and included details such as sex, date of birth, date of death, age at death, and the code for the underlying cause of death. The International Classification of Diseases, Tenth Revision, was employed to categorize reported fatalities into nonaccidental (A00–R99), cardiovascular (I00–I99), and respiratory (J00–J99) categories, after excluding accidental deaths. For each of the 22 149 individuals who died from nonaccidental causes in Qingpu, Shanghai, China, between 2013 and 2019, we collected data on the cause of death, date of death, usual residence address, and sociodemographic characteristics. Among these, 6712 individuals died of diseases of the cardiovascular system, while 3275 individuals died specifically of diseases of the respiratory system.
Air pollutants and meteorological data
Data on air pollution were provided by the Shanghai Municipal Bureau of Ecology and Environment, and we focused on mean daily concentrations of PM2.5 (μg/m3), SO2 (μg/m3), NO2 (μg/m3), O3-8h (μg/m3), and CO (mg/m3) from 3 air monitoring stations in the Qingpu District (including Xiayang, YingPu, and Zhujiajiao subsites) located in the center of the study area. Detailed descriptions of these instruments and methodologies were given in a previous study.20
The meteorological data for this study were mainly extracted from the data of automatic meteorological observation stations in Qingpu District from 2013 to 2019, including the average daily temperature (°C) and relative humidity, and the values of each pollutant were taken as the average value of each station.
Statistical analysis
In this study, demographic characteristics, ambient air pollutants, and meteorological conditions for continuous variables were reported as mean (SD), while categorical variables were expressed as number and percentage. The relationships between PM2.5, O3-8h, NO2, SO2, CO, and meteorological parameters were assessed using correlation coefficients. Additionally, a conditional logistic regression model was employed to evaluate the impact of a brief exposure to air pollution on the likelihood of overall and cause‑specific death.21 We also presented composition‑death relationships for single days (lag 0 to lag 7 days) and moving average lags (lag 01 to lag 07 days) to account for the delayed effects of ambient air pollution. Lag‑01 was defined as the 2‑day moving average of the day of death and the day prior, and so forth. The date of death was recorded as lag‑0, while the day before was designated as lag‑1. We also assigned single‑day and moving average delays to each control day using the same methodology. In this study, we utilized a case‑crossover design and conditional logistic regression analysis to adjust for individual characteristics, including economic factors. A natural spline function with 3 degrees of freedom was employed in all models to account for relative humidity and temperature.22 To investigate the key patterns in the relationship between air pollution and death, we generated exposure‑response curves using air pollutant exposure modeled as a 3‑degree of freedom natural spline function during the periods when each air pollutant was most significantly associated with death. If a nonlinear correlation was observed, a 2‑piece‑wise linear regression model was employed to calculate the threshold effect.
Utilizing weighted quantile sum (WQS) regression analysis, this study further investigated the collective and individual impact of 5 air contaminants on nonaccidental deaths as well as system‑specific death.23 We selected exposure windows during which the majority of air contaminants exhibited a strong association with death. This technique employs weighted indices as individual exposure variables within a linear model, assigning weights based on air pollution quartiles. The data were divided into training (40%) and validation (60%) subgroups. For each air pollutant in the training subset, we calculated the WQS mixed exposure index by taking a weighted average of over 10 000 bootstrap resamples.23 In the validation subset, we assessed the association between the likelihood of death and the WQS index. The odds ratio (OR) with 95% CI was used to demonstrate the association between death and each one‑quarter increase in all compounds within the mixture.
By applying conditional logistic regression modeling, we further assessed the modifying effect of temperature on the relationship between air pollution and death. First, the impact of air pollutants on death varies continuously with temperature, as demonstrated by the discrete simulation of the atmospheric pollutant‑temperature response surface represented by temperature stratification.24 The relationship between air pollution and temperature was then analyzed using the cross‑product of temperature categories (low [<25th percentile], medium [25th–75th percentile], and high [>75th percentile]) with atmospheric contaminants.24 Finally, by incorporating a multiplicative interaction term between ambient temperature and air pollutants, we evaluated the interaction effects.
Subsequently, a variety of sensitivity tests were conducted to assess the reliability of our findings. First, a stratified subgroup analysis was conducted based on age (<65 years and ≥65 years) and sex (men and women). The study period was divided into warm and cold seasons according to the case date, allowing for stratified analyses to identify the seasonal patterns in the relationship between constituents and death. We defined the months of April through September as the warm season and the months of October through March as the cold season. A 2‑sample z test was employed to compare the differences in effects across the various stratifications.25 Secondly, we employed a temperature stratification model based on the findings from the bivariate modeling in order to determine whether there is variability in the effects of air pollutants on health outcomes across different temperature levels.
All analyses were performed using R software (version 4.3.2; R Foundation for Statistical Computing, Vienna, Austria). Two‑sided P values below 0.05 were considered significant.
Ethics
Due to the design of the study, no approval of an ethics committee and patient consent were necessary.
Results
Baseline characteristics of the study participants
The basic characteristics of nonaccidental deaths from 2013 to 2019 are presented in Table 1. The analysis included 22 149 nonaccidental deaths, of which 3275 (14.8%) were attributable to respiratory disorders and 6712 (30.3%) to cardiovascular conditions. The average age of the deceased was 78 years, with approximately 85% being over the age of 65. Men accounted for about 52.7% of the deceased, and 51.8% of the cases occurred during the warmer months, from April to September.
Characteristic | Value | Percent |
Data are presented as frequency or mean (SD).
Abbreviations: ICD‑10, International Classification of Diseases, Tenth Revision | ||
Total nonaccidental (ICD‑10 code, A00–R99) | 22 149 | 100 |
Case days | 22 149 | – |
Control days | 75 306 | – |
Sex | ||
Men | 11 683 | 52.7 |
Women | 10 466 | 47.3 |
Age at death, y | 77.9 (13) | – |
<65 | 3277 | 14.8 |
65–80 | 7329 | 33.1 |
>80 | 11 543 | 52.1 |
Season at death | ||
Cold (October to March) | 10 415 | 47 |
Warm (April to September) | 11 734 | 53 |
Cause of death | ||
Cardiovascular diseases (ICD‑10 code, I00–I99) | 6712 | 33 |
Respiratory diseases (ICD‑10 code, J00–J99) | 3275 | 14.7 |
Summary statistics for air pollutants and meteorological conditions on case days are presented in Supplementary material, Table S1 and Figure S1. The mean case‑day exposures to PM2.5, O3-8h, NO2, SO2, and CO were 55.7, 107, 40.6, and 16 μg/m3, and 0.75 mg/m3, respectively. The mean case‑day air temperature was 17.4 °C, and the relative humidity was 75.2%. The Spearman correlation coefficients (rs) between the daily atmospheric pollutants and meteorological factors are shown in Supplementary material, Figure S2. The majority of air pollutants were significantly and positively correlated (excluding O3-8h), with medium‑to‑high rs ranging from 0.47 to 0.67.
Associations of air pollutants with the probability of death
Significant associations were identified between exposure to PM2.5 (lag 3, lag 03, lag 04, lag 05), O3-8h (lag 1, lag 2, lag 02, lag 03, lag 04), NO2 (lag 0, lag 1, lag 3, lag 01, lag 02, lag 03, lag 04, lag 05, lag 06, lag 07), and SO2 (lag 3, lag 4, lag 02, lag 03, lag 04, lag 05, lag 06, lag 07) and nonaccidental death (Figure 1; Supplementary material, Table S2). Notably, the estimated ORs (95% CI) for PM2.5 at lag 04, O3-8h at lag 03, SO2 at lag 07, and NO2 at lag 06 concerning nonaccidental deaths reached their maximum values of 1.009 (1.002–1.017), 1.017 (1.008–1.027), 1.051 (1.015–1.089), and 1.027 (1.010–1.045), respectively. The nonlinear relationships between atmospheric pollutants and nonaccidental deaths were significant (P value for nonlinearity <0.001 for PM2.5, O3-8h, and NO2, P value for nonlinearity = 0.003 for SO2), as illustrated in Supplementary material, Figure S3. After evaluating the associations using 2‑piece‑wise linear regression models, the cutoff points for atmospheric pollutants (including PM2.5, O3-8h, SO2, and NO2) related to nonaccidental deaths were determined to be 38.4, 100.5, 21.9, and 36.6 μg/m3, respectively.
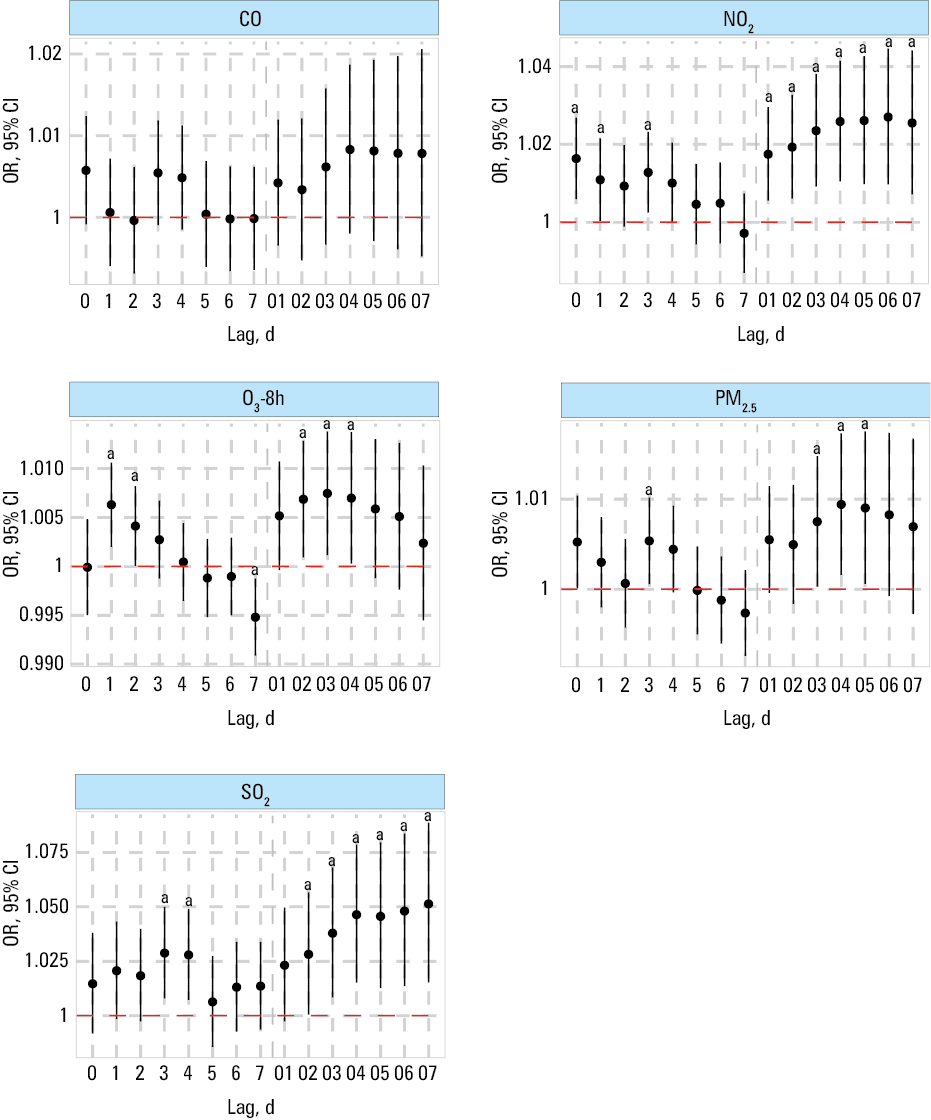
a Regression results significant for P <0.05
Abbreviations: O3-8h, maximum 8‑h moving average concentrations for ozone; PM2.5, particulate matter with diameter ≤ 2.5 µm
Supplementary material Figures S4 and S5 display the OR estimates (with 95% CI) for cardiovascular and respiratory deaths per interquartile range increase in ambient air pollutants. Similarly, exposure to air pollutants significantly elevated the risk of respiratory death due to cardiovascular disease at a lag of 07 days, with an OR (95% CI) of 1.029 (1.005–1.053) for PM2.5, 1.137 (1.054–1.226) for SO2, 1.068 (1.022–1.116) for NO2, and 1.041 (1.009–1.073) for CO (Supplementary material, Table S3). For cardiovascular death, significant associations were identified only for O3-8h (lag 1, lag 2, lag 02, lag 03) and SO2 (lag 2), while no evident associations were observed for the remaining air pollutants (PM2.5, NO2, and CO; Supplementary material, Table S4). To assess whether ambient air pollutants and reproductive lifespan had a nonlinear dose‑response relationship, smooth curve fits based on generalized additive models were also prepared. After controlling for all factors, the results demonstrated a linear relationship between the majority of ambient air pollutants (excluding O3-8h) and cause‑specific death (Supplementary material, Figures S6 and S7). The nonlinear relationship between O3-8h and cardiovascular death was significant (P value for nonlinearity <0.001), with the cutoff point determined to be 99.3 μg/m3 (Supplementary material, Figure S6).
Association of a combination of air pollutants with death
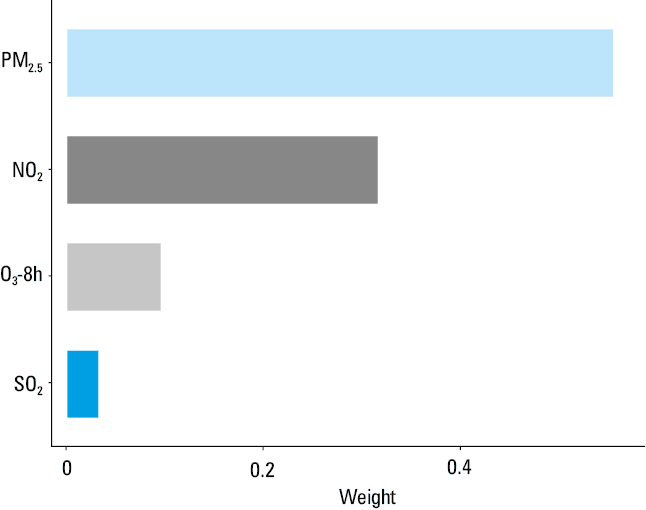
We selected a lag of 03 days as the study period to examine the short‑term associations of the exposure to mixed air pollutions on nonaccidental deaths, as this is when the majority of air pollutants were significantly associated with nonaccidental fatalities. In the single‑pollutant analysis, pollutants other than CO strongly correlated with nonaccidental fatalities at lag 03 days. Exposure to a combination of PM2.5, O3-8h, NO2, and SO2 was significantly associated with an increased rate of nonaccidental fatalities (OR, 1.03; 95% CI, 1.01–1.05). The WQS model, illustrated in Figure 2, was employed to quantify the contribution of the assessed air pollutants to nonaccidental fatalities. The WQS model also identified PM2.5 (weight = 0.557) and NO2 (weight = 0.316) as significant contributors to the overall association (Figure 3; Supplementary material, Table S5).
Abbreviations: see Figure 1
![Odds ratio (with 95% CI) of nonaccidental mortality associated with 10 μg/m3-increase in PM2.5, O3-8h, SO2, NO2, and 0.1 mg/m3-increase in CO by a time lag of 0–7 and 01–07 days. The relationship between air pollution and temperature was then analyzed using the cross-product of temperature categories (low [<25th percentile], medium [25th–75th percentile], and high [>75th percentile]) with atmospheric contaminants. Note: dots and vertical lines represent point estimates and 95% CIs of ambient air pollutants at individual lag days.
a Regression results significant for P <0.05
Abbreviations: see Figure 1](/paim/_next/image/?url=https%3A%2F%2Fpamw.pl%2Fsites%2Fdefault%2Ffiles%2Fjson_zip_files%2Funcompressed%2F17036%2FIMAGES%2FKP_WEB__FIG_03.png&w=3840&q=75)
Abbreviations: see Figure 1
In the single‑pollutant analysis of cardiovascular death, the only significant association was observed between O3-8h and SO2 levels at different lag days. Consequently, we further assessed the impact of the air pollutant mixture on respiratory death. We selected a lag of 05 days as the period for analysis, as this was when most air pollutants showed significant associations with respiratory death. The results indicated that the air pollutant combination was significantly and positively associated with respiratory death (OR, 1.1; 95% CI, 1.05–1.15), with SO2 and PM2.5 identified as the primary contributors (Figure 3; Supplementary material Table S5).
Interactive effects of temperature and air pollutants on death
Across various temperature levels, Figure 4 and Supplementary material Figures S8 and S9 illustrate the lag patterns of air pollutants on both overall and cause‑specific death. In general, there was a stronger association between an increase in O3-8h level and death at high than low air temperature. For example, at low, medium, and high air temperature, a percentage increase in cardiovascular death of −0.06% (95% CI, −0.29% to 0.18%), 0.02% (95% CI, −0.10% to 0.14%), and 0.13% (95% CI, 0.02%–0.25%) was associated with every 10 μg/m3 in O3-8h at lag 04 days (P = 0.001; Supplementary material, Table S6).
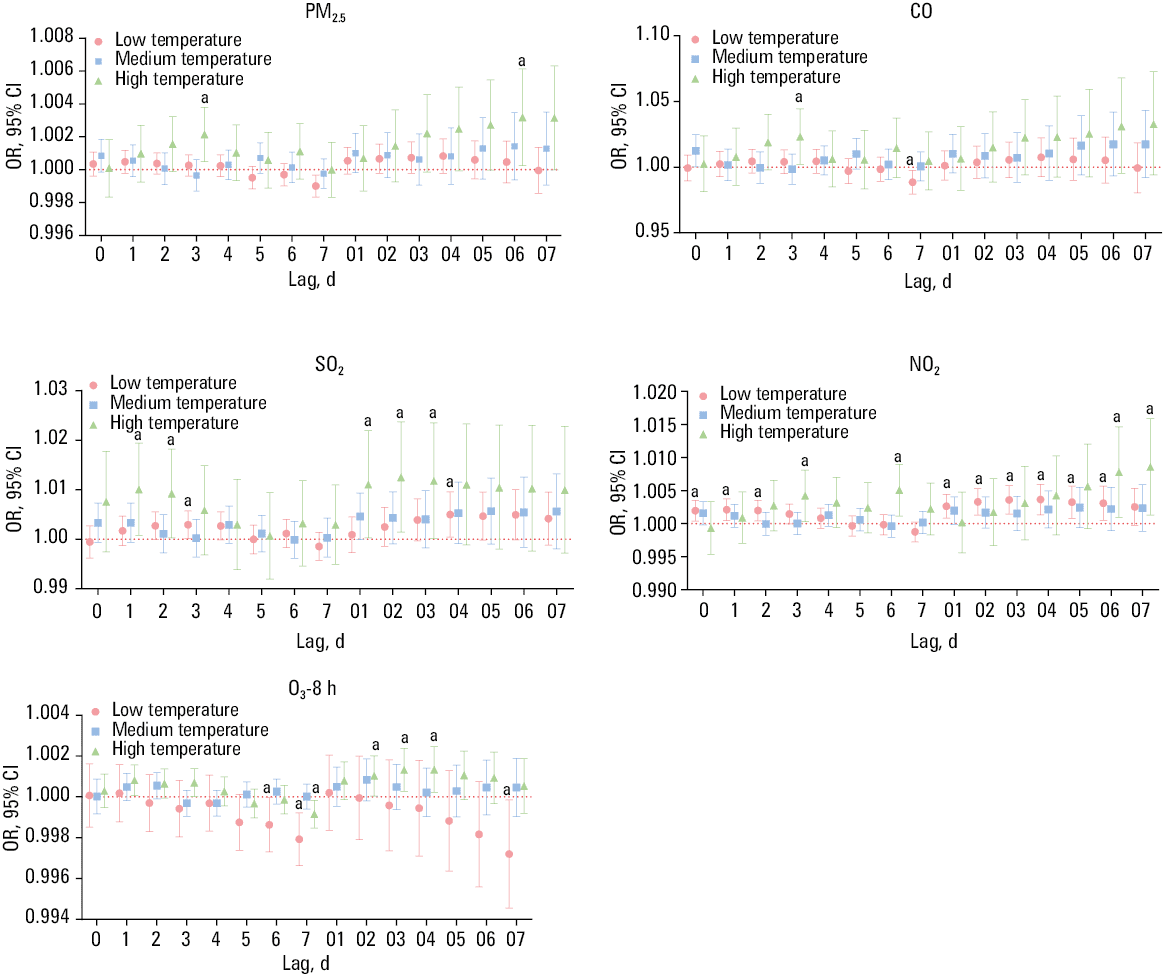
a Regression results significant for P <0.05
Abbreviations: see Figure 1
Sensitivity analyses
Table 2 presents the subgroupspecific excess risks (ERs; 95% CI) for cardiovascular, respiratory, and nonaccidental deaths associated with the exposure to ambient air pollution, categorized by age and sex. The sex‑specific findings indicate that women are at a significantly higher risk than men for nonaccidental death due to exposure to PM2.5 and NO2. For instance, the ER for PM2.5 was 0.96% (95% CI, 0.21%–1.72%) for women and 0.16% (95% CI, –0.54% to 0.87%) for men (P = 0.02). A similar trend was observed in the relationship between the atmospheric pollutants and respiratory death, with PM2.5 and SO2 showing a more pronounced association with respiratory death among women. Additionally, stronger positive associations between the air pollutants (including SO2, O3-8h, and CO) and respiratory death were identified in younger individuals than those aged 65 years and older. However, the associations of all air pollutants with death did not vary significantly by season.
Subgroup | PM2.5 | NO2 | SO2 | O3-8h | CO |
Nonaccidental | |||||
a Percentage changes in odds ratios of death per 10 μg/m3-increase in PM2.5, O3-8h, NO2, and SO2, and per 0.1 mg/m3-increase in CO ([OR−1] × 100%) with their 95% CI were estimated.
b Significant percentage change (P <0.05)
Abbreviations: see Figure 1 | |||||
Sex | |||||
Men | 0.16 (–0.54 to 0.87) | 1.2 (–0.23 to 2.64) | 0.35 (–2.73 to 3.54) | –0.16 (–0.84 to 0.52) | 0.46 (–0.45 to 1.37) |
Women | 0.96 (0.21–1.72)b | 2.13 (0.6–3.69)b | 2.73 (–0.65 to 6.23) | 0.15 (–0.56 to 0.87) | 0.72 (–0.26 to 1.7) |
Age, y | |||||
<65 | 1.23 (–0.13 to 2.62) | 2.87 (0.08–5.74)b | 1.07 (–4.78 to 7.29) | 0.81 (–0.43 to 2.06) | 1.35 (–0.4 to 3.13) |
≥65 | 0.43 (–0.13 to 0.99) | 1.43 (0.3–2.58)b | 1.52 (–0.97 to 4.07) | –0.16 (–0.7 to 0.38) | 0.45 (–0.27 to 1.17) |
Season | |||||
Warm | 0.74 (–0.32 to 1.81) | 1.99 (–0.18 to 4.22) | 4.5 (–0.81 to 10.08) | 0.06 (–0.54 to 0.65) | 0.52 (–0.76 to 1.82) |
Cold | 0.48 (–0.11 to 1.08) | 1.69 (0.48–2.92)b | 0.7 (–1.86 to 3.34) | –0.23 (–1.16 to 0.71) | 0.61 (–0.17 to 1.39) |
Cardiovascular | |||||
Sex | |||||
Men | –0.51 (–1.87 to 0.87) | 0.69 (–2.01 to 3.48) | –2.75 (–8.66 to 3.55) | 0.02 (–1.3 to 1.35) | 0.09 (–1.66 to 1.87) |
Women | 1.11 (–0.16 to 2.39) | 2.06 (–0.47 to 4.66) | 1.99 (–3.85 to 8.17) | 0.49 (–0.69 to 1.69) | 0.89 (–0.74 to 2.55) |
Age, y | |||||
<65 | 0.5 (–2.09 to 3.16) | 1.63 (–3.4 to 6.93) | 5.74 (–6 to 18.95) | 0.53 (–1.8 to 2.92) | 2.3 (–1.04 to 5.75) |
≥65 | 0.33 (–0.64 to 1.31) | 1.4 (–0.54 to 3.37) | –0.89 (–5.24 to 3.66) | 0.24 (–0.68 to 1.17) | 0.34 (–0.91 to 1.61) |
Season | |||||
Warm | 0.91 (–0.99 to 2.85) | 1.99 (–1.86 to 6) | 4.69 (–4.99 to 15.34) | 0.25 (–0.81 to 1.32) | 1.27 (–1.05 to 3.65) |
Cold | 0.24 (–0.84 to 1.34) | 1.36 (–0.8 to 3.56) | –1.49 (–6.19 to 3.44) | 0.15 (–1.53 to 1.87) | 0.22 (–1.19 to 1.64) |
Respiratory | |||||
Sex | |||||
Men | –0.13 (–1.74 to 1.5) | 0.93 (–2.34 to 4.31) | –2.25 (–8.94 to 4.93) | –0.18 (–1.84 to 1.52) | –0.29 (–2.35 to 1.81) |
Women | 2.01 (0.21, 3.84)b | 1.94 (–1.79 to 5.81) | 9.77 (2.06–18.08)b | 0.65 (–1.22 to 2.55) | 1.58 (–0.76 to 3.98) |
Age, y | |||||
<65 | 2.58 (–0.6 to 5.86) | 3.61 (–2.45 to 10.05) | 24.36 (9.44–41.31)b | 4.47 (1.21–7.83)b | 5.74 (1.72–9.93)b |
≥65 | 0.76 (–0.51 to 2.05) | 1.34 (–1.28 to 4.04) | 2.68 (–2.74 to 8.4) | 0.11 (–1.22 to 1.45) | 0.39 (–1.26 to 2.06) |
Season | |||||
Warm | –0.01 (–2.75 to 2.81) | 0.39 (–5.12 to 6.23) | 8.7 (–4.64 to 23.91) | 0.61 (–1 to 2.24) | –0.64 (–3.92 to 2.76) |
Cold | 1.05 (–0.38 to 2.5) | 1.8 3(–1.15 to 4.91) | 1.83 (–4.08 to 8.11) | –0.75 (–3.09 to 1.65) | 0.9 (–0.99 to 2.83) |
Moreover, to investigate the interaction between temperature and air pollution, we employed response surfaces as an experimental tool. Our findings showed that the effects of PM2.5, NO2, and CO at extreme temperature levels (both low and high) were more pronounced than those observed in the moderate temperature range for all 3 health outcomes (Supplementary material, Figures S10–S12). When comparing the low‑temperature layer with the other temperature layers, we found that air pollutants significantly influenced both death of specific cause and all‑cause death for O3-8h and SO2. Additionally, there were regions where the fitted response surface approached zero. The bivariate response suggested that temperature may affect the relationship between PM2.5 and death.
Discussion
We assessed the acute effects of various air contaminants on daily death in this time‑stratified case‑crossover study. Only O3-8h was found to be associated with an increased risk of cardiovascular death, while exposure to PM2.5, NO2, and SO2 was linked to nonaccidental and respiratory death. Additionally, a significant association was identified between the combined exposure to 5 air pollutants and both nonaccidental and respiratory death. Among these pollutants, PM2.5 and SO2 exhibited the most pronounced associations. Furthermore, at high temperatures, as compared with moderate and low temperatures, O3-8h exposure resulted in a markedly greater increase in the likelihood of death (P <0.05). These findings may contribute to a deeper understanding of the harmful effects of hazardous components in China’s ambient particulate pollution on human health.
To our knowledge, this is a time‑stratified case‑crossover study with one of the longest time‑span that provides a comprehensive assessment of the association between individual air pollutants and their mixtures with death. Prior research has primarily focused on the potential risks associated with specific air pollutants, particularly PM2.5, in relation to nonaccidental or all‑cause mortality. For instance, a cohort study from Denmark26 with average follow‑up of 17 years examined the risk of death linked to ambient PM in the general population. It found that for every 5 μg/m3-increase in PM2.5, the hazard ratio for all‑cause / nonaccidental mortality ranged from 1.09 to 1.13. A study conducted in Nanjing, China, from 2004 to 2019, collected daily mortality data from the city’s residents. It demonstrated that mortality displacement related to total cardiovascular and cerebrovascular disease deaths within 30 days was associated with PM2.5, PM10, NO2, and SO2 concentrations.27 Based on Polish data from the years 2011–2018, Dąbrowiecki et al28 also found that PM2.5, PM10, NO2, and SO2 pollution was associated with an increased risk of COPD exacerbation requiring hospitalization. By synthesizing the findings of a meta‑analysis, positive associations between pollutants and all‑cause mortality were identified for PM10 (relative risk [RR], 1.0041; 95% CI, 1.0034–1.0049), PM2.5 (RR, 1.0065; 95% CI, 1.0044–1.0086), NO2 (24‑h average; RR, 1.0072; 95% CI, 1.0059–1.0085), and O3 (RR, 1.0043; 95% CI, 1.0034–1.0052).29 Similarly to previous studies, our findings also indicated a positive association between air pollution and death. However, some studies that reported no significant association between air pollution (such as NO2 and SO2) and mortality contradicted our results.4,11 The heterogeneity of the results may stem from variations among the studies in the selection of exposure data (including single and mixed air pollutants, as well as data from monitoring stations or predictive models), the selection of study participants (entire populations or specific subgroups), and the methodologies employed (such as time‑series or case‑crossover studies). Our research utilized a case‑crossover study design that incorporated a mixed exposure model, which thoroughly accounted for and adjusted the effects of other air pollutants, thereby enhancing the comprehensiveness and accuracy of the results. Overall, our study contributes to the evidence linking air pollution to death and presents novel findings from research conducted in China between 2013 and 2019. This research addresses the gap in relevant studies regarding the effects of exposure to mixed air pollutants on death in China.
The association between air pollution and death has been linked to a variety of potential mechanisms, including oxidative stress, inflammation, dysregulation of the cardiac autonomic nervous system, vascular dysfunction, thrombosis, and atherosclerosis.30 Exposure to air pollutants, particularly PM2.5, has previously been associated with elevated levels of circulating proinflammatory biomarkers, plaque formation, and increased platelet and fibrinogen concentration (measured via coagulometric activity).31 In addition, elevated levels of these factors are directly involved in the coagulation cascade, leading to the formation of a fibrin network that promotes thrombus formation. Simultaneously, fibrinogen binds to integrins (eg, αvβ3) on the surface of endothelial cells, which increases the risk of damage to the vessel wall.32 Inhaled PM has been demonstrated in animal studies to significantly reduce total myocardial blood flow, increase coronary vascular resistance, and activate platelets and thrombin.33 Additionally, airborne pollutants, such as PM and O3-8h, can continually and synergistically generate reactive hydroxyl radicals, which may lead to respiratory illnesses and inflammation of the airways.34 Moreover, through neuroimmune interactions, coexposure to PM2.5 and O3-8h may contribute to the development of adverse health outcomes.35
According to our findings, temperature modifies the association between ozone and death, and high temperatures can further amplify the harmful effects of ozone. Most previous research has either examined the effects of pollutants and meteorological conditions in isolation or investigated the moderating role of temperature on the relationship between daily mortality and atmospheric pollutants using 2‑pollutant models.26,27,29 A multicenter study conducted across 8 European cities and regions demonstrated that O3-8h is moderately‑to‑strongly positively correlated with temperature, and that O3-8h significantly increases mortality risk under high‑temperature conditions, as compared with moderate and low‑temperature conditions.36 Several hypotheses have been proposed, despite the fact that the underlying biological mechanisms linking temperature and O3-8h to mortality are not fully understood. First, because temperature and O3-8h effects share similar pathophysiological pathways, they may have synergistic effects on the cardiovascular system.37 Elevated cholesterol levels, inflammatory responses, and increased blood viscosity and coagulability are all associated with temperature fluctuations, whether high or low.38 Second, elevated temperatures alter physiological responses to harmful substances and increase thermoregulatory stress, making individuals more susceptible to the detrimental effects of air pollution (eg, O3-8h).39 Third, as people tend to spend more time outdoors and open windows during warmer months, population exposure to air pollution (such as O3-8h) may rise.40 Meanwhile, ozone shows a seasonal variability, with high temperatures leading to increased ozone levels, which further elevate the risk of ozone‑related deaths.39
In accordance with other research, we also found that young adults41,42 and women may be more vulnerable to air pollutants,43,44 such as PM2.5 and O3-8h than older individuals and men. Women may exhibit greater physiological responses to air pollution and demonstrate higher airway responsiveness, which could explain this susceptibility.45 Younger individuals may be more sensitive to air pollution due to longer time spent outdoors and more frequent commuting, leading to higher actual exposure levels.46 In particular, PM2.5 and gaseous pollutants, such as ozone, are often more concentrated in the areas with heavy traffic, such as urban Shanghai.47 Simultaneously, vulnerable individuals aged 65 years and older may have died prematurely from prior exposures, while survivors tend to exhibit greater resilience to pollution, such as tolerance to chronic inflammation.48 Numerous additional factors, such as education and marital status, which could influence the relationship between air pollution and death, fall outside the scope of this study and require further investigation.
Strengths and limitations
Our study has several strengths. To more effectively account for specific confounders that remained constant over time, we employed a case‑crossover design. This research, based on long‑term surveillance data, provides new evidence that exposure to various air pollutants increases likelihood of death in China. This finding could significantly influence regional environmental and public health regulations. Furthermore, we utilized the WQS model to assess the impact of exposure to a combination of multiple air pollutants on death, potentially offering valuable insights into the complex mechanisms underlying the relationship between pollutant mixtures and death. Lastly, our study provides first‑hand epidemiologic evidence of the association between multiple air pollutants and meteorological conditions on death in the general population.
The study also has some limitations. First, exposure to air pollutants was classified based on monitoring sites rather than the residential addresses of each fatal case, which may result in some degree of unavoidable exposure misclassification. This nondifferential measurement error could skew our results toward zero, leading to an underestimation of the true relationship. Second, to validate our findings regarding the robustness of the data, additional large cohort studies are necessary. Our data were derived solely from typical district‑level statistics in Shanghai, China. Third, we lacked sufficient data on the impact of individual behavioral risk factors (such as drinking and smoking habits) on participant death.22 Although employing a case‑crossover approach suggests that certain fixed‑term confounders are fully controlled, it is not feasible to assess other potential individual risk factors without documentation of these specifics. Moreover, the statistical WQS model does not consider the actual levels of exposure or toxic properties of each air pollutant. Finally, due to data unavailability, our analyses could not account for the confounding influence of seasonal influenza.
Conclusions
The study found that both individual and combined ambient air pollutants are associated with respiratory and nonaccidental death. This underscores the necessity for integrated air pollution control, prioritizing PM2.5 and SO2. Additionally, we found that high temperatures may amplify the associations of O3-8h with daily death. Our findings reinforce the existing body of evidence linking mortality to air pollution, and serve as a guide for the development of intervention and mortality prevention programs.
- Achilleos S, Kioumourtzoglou MA, Wu CD, et al. Acute effects of fine particulate matter constituents on mortality: a systematic review and meta‑regression analysis. Environ Int. 2017; 109: 89‑100. | Crossref
- Shi L, Rosenberg A, Wang Y, et al. Low‑concentration air pollution and mortality in American older adults: a national cohort analysis (2001‑2017). Environ Sci Technol. 2022; 56: 7194‑7202. | Crossref
- Chen J, Hoek G. Long‑term exposure to PM and all‑cause and cause‑specific mortality: a systematic review and meta‑analysis. Environ Int. 2020; 143: 105974. | Crossref
- Stafoggia M, Oftedal B, Chen J, et al. Long‑term exposure to low ambient air pollution concentrations and mortality among 28 million people: results from seven large European cohorts within the ELAPSE project. Lancet Planet Health. 2022; 6: e9‑e18. | Crossref
- Pope CA, Ezzati M, Dockery DW. Fine‑particulate air pollution and life expectancy in the United States. N Engl J Med. 2009; 360: 376‑386. | Crossref
SUPPLEMENTARY MATERIAL
ARTICLE INFORMATION