Differences between office, home, and 24-hour ambulatory blood pressure monitoring in pregnant women with preeclampsia and uncomplicated hypertension
Key words: automated blood pressure monitoring, home blood pressure measurement, office blood pressure measurement, preeclampsia, pregnancy hypertension

 CC BY 4.0
Differences between office, home, and 24-hour ambulatory blood pressure monitoring in pregnant women with preeclampsia and uncomplicated hypertension
Introduction: Definition and management of arterial hypertension are based on office blood pressure measurement (OBPM), both in the general and pregnant population. However, in clinical practice, home BPM (HBPM) or 24‑hour ambulatory BP monitoring (ABPM) seem to be more accurate. Data on differences between BP assessment methods in pregnancy are scarce.
Objectives: We aimed to assess the BP profiles during pregnancy and compare the results of HBPM, OBPM, and ABPM performed simultaneously, in real clinical setting, with respect to hypertensive status and development of preeclampsia (PE).
Patients and methods: In the years 2017–2023, a total of 241 women were examined prospectively each month throughout pregnancy, and at 6–8 weeks, 6 months, and 1 year postdelivery. On each visit, HBPM, OBPM, and ABPM data were collected.
Results: Forty normotensive controls and 201 hypertensive (HT) women were recruited. PE developed in 49 cases (HT+PE). BP of the controls differed markedly from complicated (HT+PE) and uncomplicated HT for all 3 methods (P <0.05), and there were significant differences between the HT+PE and HT groups from 23 weeks of gestation until delivery: in the PE group systolic BP / diastolic BP was higher for OBPM (by 4/4.5–10/6 mm Hg), HBPM (by 4.2/3.6–7.1/8.4 mm Hg), and night‑time ABPM (by 9/5–16.5/9 mm Hg). At the same time, daytime ABPM differences were mostly insignificant.
Conclusions: Considerably higher BP values indicated PE on HBPM, OBPM, and night‑time ABPM readings, as compared with uncomplicated HT, even 2 months before average time of PE recognition. Night‑time ABPM seems to have the strongest predictive and diagnostic value for early PE recognition.
What's new?
This is the first study to examine and prospectively compare monthly blood pressure (BP) profiles developed with 3 basic clinical methods of noninvasive BP assessment, such as ambulatory 24‑hour monitoring, office BP measurement, and home BP measurement in pregnant women, with respect to their hypertensive status. The study showed not only significantly lower BP in normotensive pregnancies than those properly controlled with antihypertensive treatment, but also relevant differences between uncomplicated hypertensive pregnancies and those in which preeclampsia will develop. The most evident differences were noted for mean night‑time BP values on automated 24‑hour monitoring that were higher in future preeclamptic women. This method of BP assessment seems to have the strongest potential for early detection of maternal risk for preeclampsia.

Introduction
Hypertensive disorders affect approximately 10% of pregnancies, and are a significant risk factor for maternal and fetal morbidity and mortality.1 They are also an important contributor to the incidence of small‑for‑gestational age newborns and preterm births.1 The majority of adverse effects associated with arterial hypertension (AH) during pregnancy are attributable to preeclampsia (PE), a multiorgan, heterogeneous, and progressive disorder. It is vital that women at a risk of developing this complication are identified early in antenatal care.2 An uncomplicated, healthy pregnancy is characterized by several hemodynamic changes in the cardiovascular system, such as reduction in peripheral vascular resistance, and an increase in cardiac output, heart rate, and circulatory blood volume, which result in lower blood pressure (BP) during the first trimester and a gradual elevation of BP in the second half of pregnancy.3,4 However, the definition of AH is the same for pregnant and nonpregnant women. It is generally based on office BP measurement (OBPM) supported by home BPM (HBPM) between visits. There is no difference in the guidelines for pregnant and nonpregnant women regarding the recognition of AH and starting antihypertensive treatment. Recent European guidelines state that 24‑hour ambulatory BP monitoring (ABPM) is not mandatory in the monthly management of pregnancy.5 However, it should be considered in various clinical situations, such as confirming hypertension that requires medical treatment, detecting the white coat effect or masked hypertension, and PE.5-7
Based on clinical observations and conclusions from an increasing number of studies, it is clear that the values of BP considered normal during pregnancy should be lower than those in the general population. Furthermore, these norms must be gestational time–dependent. Premature significant elevation of BP in the course of pregnancy may indicate an increased risk of PE, with consequences for the mother and child.8,9 Early detection of high‑risk populations based on different physiological BP trajectories will allow for the initiation of preventive measures and continued monitoring under the supervision of tertiary specialist centers. Most studies on this subject are based on retrospective data and meta‑analyses, which typically assess BP just once per trimester, or studies that focus on 1 or 2 methods of BP measurement. There is a clear need for comparison of monthly BP values during pregnancy with 3 methods, such as OBPM, HBPM, and ABPM in the same pregnant population in a prospective manner.
This study aimed to assess BP profiles during pregnancy, and compare 3 methods of BP assessment, that is, HBPM, OBPM, and ABPM, used simultaneously in real clinical setting with respect to hypertensive status and development of PE. We also evaluated the association of earlier elevation of BP, if present, and development of hypertensive complications.
Patients and methods
Study design and participants
A prospective longitudinal study comparing 3 methods of BP assessment (OBPM, HBPM, and ABPM) was performed among 241 pregnant women admitted between May 2017 and October 2023 to our outpatient clinic. Exclusion criteria were age below 18 years, recognized schizophrenia or bipolar disorder, and a history of heart failure. The patients were examined monthly throughout pregnancy from enrolment until delivery, and at 3 visits at 6–8 weeks, 6 months, and 1 year postdelivery. The visits during pregnancy were scheduled individually every 4 weeks, starting from the day of the first visit in the outpatient center. The schedule was flexible, allowing for necessary changes, depending on the patient clinical status and BP control. A total of 1232 visits were performed, and their details were included in the analysis of the examined population. The entire study was initiated and performed by the investigators, and no financial incentives were suggested by the device manufacturers.
On each visit, data on the patient current clinical status, presence of complications (based on prenatal ultrasound, laboratory findings, and clinical assessment), and HBPM reading results from 7 days preceding the visit were collected. The patients measured BP at home 3 times a day (2 measurements on each occasion) for at least 7 days before the next visit, using their own electronic BP arm‑cuff devices. At the onset of the study, each patient was instructed on the correct technique and conditions for measurements, in line with the latest regulations.10-12 HBPM results were compared with OBPM performed with a validated OMRON‑705I unit (OMRON Healthcare, Inc. Kyoto, Japan) and with those of ABPM. OBPM was documented as an average value from 3 consecutive measurements taken at least 60 second apart, between 8 AM and 11 AM, in a calm environment, and a temperature‑controlled room. The measurements were taken in accordance with the European Society of Hypertension (ESH) and the European Society of Cardiology (ESC) guidelines in the presence of an examining physician.10-12 ABPM was performed with a validated device (AND TM‑2430; A&D Company, Limited; Tokyo, Japan), with measurements done every 15 minutes during the day (7 AM to 10 PM) and every 30 minutes at night. The patients were instructed to follow a similar daily routine with minimal restrictions, and were inquired about the actual time of night‑time sleep during monitoring to ensure accurate analysis of individual data. BP series were excluded from the analysis if they contained spans of more than 2 hours with no BP measurements.
Data on parity, smoking, comorbidities, usage of acetylsalicylic acid (ASA), body mass, time and route of delivery, and the newborn condition were collected and included in the analysis. Pharmacotherapy in hypertensive patients was managed based on current BP results and patient clinical status in accordance with the guidelines, and individualized and adjusted on each visit with a priority to achieve good BP control.10-12 For the purpose of further statistical analysis, all participants were ultimately diagnosed as normotensive (control group), uncomplicated hypertensive (HT group), or hypertensive with PE (HT+PE group).
Definitions
AH in the study was recognized based on the result of ABPM, when mean systolic BP (SBP) / diastolic BP (DBP) values were 135/85 mm Hg or higher during the day and 120/70 mm Hg or higher at night‑time. Differentiation between gestational hypertension (appearing after 20 weeks of gestation in a previously normotensive woman, resolving at 42 days postpartum) and chronic AH (present before pregnancy or before 20 weeks of gestation, and still persisting at 42 days postdelivery) was performed depending on the time of recognition and postpartum BP values. PE was defined in accordance with the recent ESH/ESC guidelines5 as AH accompanied by 1 or more of the following new‑onset conditions at or after 20 weeks of gestation: proteinuria, acute kidney injury, liver involvement, neurological complications, hematological disorders, and uteroplacental dysfunction.
Ethics
The study was approved by the bioethics committee at the Poznan University of Medical Sciences (141/07 and 1171/19), and all recruited patients provided their written informed consent to participate.
Statistical analysis
The study data were collected and managed with research electronic data capture tools hosted at our university.13 Statistical analyses were completed with Statistica package (TIBCO Software Inc., Palo Alto, California, United States). Comparisons between 2 groups were done with the Mann‒Whitney test, and comparisons between more than 2 groups were performed with the Kruskal‒Wallis analysis of variance test with multiple comparisons (Dunn post hoc test), as not all variables had normal distribution (tested with the Shapiro‒Wilk test). Comparisons between more than 2 groups with variables on a nominal scale were performed using the χ2 test for multidimensional contingency Tables. A P value below 0.05 was recognized as significant for all statistical tests. The receiver operating characteristic (ROC) curves with area under the curve and Bland–Altman plots are available in Supplementary material.
Results
Forty normotensive women (control group) and 201 women with AH (145 with preexisting AH and 56 with gestational AH) were included in the study. PE developed in 49 hypertensive women (33.8%; HT+PE), including 18.6% of the women with chronic AH and 39.3% of those with gestational AH. PE was recognized on average at 32.8 (range, 20–39) weeks of gestation. The basic characteristics of the studied population are presented in Table 1, and the number of participants at each visit is given in Table 2. The women who developed PE (HT+PE) delivered significantly earlier, and body mass of the newborn and their Apgar score in the first minute of life were markedly lower (P <0.05) than in the women with uncomplicated AH or controls. There were no significant differences between the control group and uncomplicated hypertensive pregnancies in terms of the aforementioned parameters. There was a clear association between the premature birth and delivery via caesarean section, as well as increased recognition of intrauterine growth restriction and the lack of ASA use for prevention of PE development. There were no significant differences in age, parity, smoking status, body mass index before pregnancy, percentage of obesity, body mass gain, or gestational diabetes between the analyzed groups. There were 8 incidents of obstetric failure, with no predilection toward any of the analyzed groups: 3 miscarriages (not related to elevated BP), 2 intrauterine fetal deaths (one at 23 weeks of gestation related to severe early PE, and the other related to trisomy 18), and 3 deaths of newborns after preterm delivery (unrelated to elevated BP or antihypertensive treatment).
Parameter | All (n = 241) | Normotensive controls (n = 40) | Uncomplicated hypertensive patients (n = 152) | Hypertensive patients with preeclampsia (n = 49) |
Data are presented as number (percentage) or median (interquartile range).
Abbreviations: ASA, acetylsalicylic acid; BMI, body mass index; DM, diabetes mellitus; FGR, fetal growth restriction; IFG, impaired fasting glucose; IGT, impaired glucose tolerance; IUD, intrauterine death; wg, week of gestation | ||||
Age, y | 34 (31–38) | 33 (30–35) | 34 (30.5–38) | 36 (31–38) |
BMI before pregnancy, kg/m2 | 27.2 (22.2–32) | 27.2 (22.8–32.4) | 27.6 (22.7–31.9) | 26.3 (20.8–32) |
Obesity (prepregnancy BMI ≥30 kg/m2) | 76 (31.5) | 15 (37.5) | 47 (30.9) | 14 (28.6) |
Weight gain in pregnancy, kg | 14 (9–18) | 13.5 (10–15.5) | 14 (9–19) | 12 (9–18) |
Hyperlipidemia | 31 (12.9) | 4 (10) | 16 (10.5) | 11 (22.4) |
Pregestational glucose level abnormalities (IFG, IGT, DM) | 45 (18.7) | 5 (12.5) | 31 (20.4) | 9 (18.4) |
Gestational diabetes | 74 (30.7) | 9 (22.5) | 50 (32.9) | 15 (30.6) |
Serum creatinine level, mg/dl | 0.64 (0.58–0.72) | 0.62 (0.57–0.7) | 0.63 (0.58–0.71) | 0.69 (0.61–0.8) |
Nulliparity | 90 (37.3) | 12 (30) | 53 (34.9) | 25 (51) |
Multiparity | 151 (62.7) | 28 (70) | 99 (65.1) | 24 (49) |
Smoking | 65 (27) | 10 (25) | 45 (29.6) | 10 (20.4) |
ASA in pregnancy | 199 (82.6) | 37 (92.5) | 132 (86.8) | 30 (61.2) |
Time of delivery, wg | 38 (37–39) | 38.5 (38–40) | 38 (38–39) | 37 (35–38) |
Premature birth | 36 (14.9) | 3 (7.5) | 13 (8.5) | 20 (40.8) |
Cesarean section | 132 (54.8) | 17 (42.5) | 75 (49.34) | 40 (81.6) |
Newborn body mass at birth, g | 3090 (2530–3480) | 3355 (2955–3740) | 3220 (2833–3500) | 2320 (1700–2640) |
FGR | 51 (21.2) | 2 (5) | 16 (10.5) | 33 (67.3) |
Apgar score at 1 min | 10 (9–10) | 10 (10–10) | 10 (10–10) | 10 (8–10) |
Apgar score at 10 min | 10 (10–10) | 10 (10–10) | 10 (10–10) | 10 (9–10) |
Newborn female sex | 107 (44.4) | 12 (30) | 66 (43.4) | 29 (59.2) |
Miscarriage / IUD / newborn death | 8 (3.3) | 1 (2.5) | 5 (3.3) | 2 (4.1) |
Visit | Normotensive control group (n = 40) | Uncomplicated hypertensive patients (n = 152) | Hypertensive patients with preeclampsia (n = 49) |
Data are presented as number (percentage).
Abbreviations: see Table 1 | |||
<15 wg | 11 (27.5) | 53 (34.9) | 9 (18.4) |
15–18 wg | 22 (55) | 86 (56.6) | 11 (22.5) |
19–22 wg | 26 (65) | 87 (57.2) | 17 (34.7) |
23–26 wg | 23 (57.5) | 97 (63.8) | 19 (38.8) |
27–30 wg | 26 (65) | 101 (66.5) | 22 (44.9) |
31–34 wg | 27 (67.5) | 100 (65.8) | 22 (44.9) |
35–41 wg | 16 (40) | 80 (52.6 | 13 (26.5) |
6–8 weeks postpartum | 9 (22.5) | 89 (58.6) | 33 (67.4) |
6 months postpartum | 5 (12.5) | 64 (42.1) | 31 (63.3) |
>12 months postpartum | 5 (12.5) | 44 (29) | 21 (42.9) |
The SBP/DBP values as per OBPM, HBPM, and ABPM are presented in Table 3. The BP values of the control group were lower than those of both the complicated (HT+PE) and uncomplicated hypertensive pregnant patients (HT), according to all 3 methods of BP assessment at most stages of pregnancy and postpartum (P <0.05; Table 3).
Visit | Normotensive control group (n = 40) | Uncomplicated hypertensive patients (n = 152) | Hypertensive patients with preeclampsia (n = 49) | |||||||||
OBPM | HBPM | Daytime ABPM | Night‑time ABPM | OBPM | HBPM | Daytime ABPM | Night‑time ABPM | OBPM | HBPM | Day time ABPM | Night‑time ABPM | |
a Significant difference between the control normotensive group and the uncomplicated hypertensive group (P <0.05)
b Significant difference between the control normotensive group and the preeclamptic hypertensive group (P <0.05)
Abbreviations: ABPM, automated 24‑hour blood pressure monitoring; HBPM, home blood pressure measurement; OBPM, office blood pressure measurement; others, see Table 1 | ||||||||||||
<15 wg | 122.5 (116–134) / 71 (66–78) | 114.1 (100–119.1) / 69.8 (64–71.8) | 119 (115–123) / 74 (70–78) | 103 (99–110) / 62 (58–63) | 132 (126–136.5) / 76.7 (71–84.5) | 122a (117.3–129.8) / 77.4a (72.9–82.7) | 134a (124.8–140) / 79a (73.5–84.3) | 114a (109–123) / 66.5a (61.2–71.5) | 134.3 (119–144.3) / 87 (75–94) | 121.1 (112.9–133.6) / 78.8b (75–94.9) | 127 (119.5–140) / 81b (77–83.5) | 123.5 (104–137.7) / 74.3b (68–76) |
15–18 wg | 115 (110–123) / 67 (63–72) | 113.2 (108.5–117.6) / 69.3 (64.7–73) | 118 (113–121) / 71 (68–72) | 101 (95–104) / 56 (54–58) | 128a (119–135) /74a (67–84) | 120.6a (116.2–127.3) / 77.3a (70.1–83) | 129a (123–135.5) / 78a (71–84) | 109a (104–117) / 63a (59–69) | 125b (117–135) / 75b (67–81.5) | 125.3b (114.6–129.4) / 79.9b 74.4–88.1) | 132b (118–146) / 77.3b (75.5–89) | 111b (107–144) / 68.5b (63–77) |
19–22 wg | 117 (115–122) / 67 (64–71) | 112.9 (104.7–117) / 69.9 (66.6–72.9) | 117 (114.5–121.5) / 71 (65.5–74) | 98 (93.5–105) / 57 (54.5–59.5) | 123a (117.5–128) / 73a (67–81) | 120.6a (113.4–126.5) / 75a (69.6–81.3) | 127a (122–136) / 77a (72–82) | 110a (103–118) / 64a (58–69) | 124b (115–141) / 75.5b (68–89.5) | 124.5b (115.1–128.5) / 79.6b (71.6–84.8) | 132b (117–144) / 76.5b (70.5–87) | 123.5b (100–145.2) / 71b (58–87.3) |
23–26 wg | 114.5 (107.5–118) / 68 (64–70) | 112.68 (107.2–118) / 70.1 (66.1–71.9) | 118.5 (115–126) / 73 (69–77) | 100 (95–104) / 59 (53–62) | 123a (116–128) / 73a (67–79) | 119.6a (112.8–125.4) / 74.9a (69.2–80.7) | 128a (123–135) / 76a (73–81) | 109a (103–116) / 63a (58–68.5) | 127b (125–134) / 77.5b (72–83) | 126.8b (124–131.4) / 79.4b (74.4–82.1) | 131b (126–140) / 77.5b (75–82) | 125.5b (108–140) / 72b (62–80) |
27–30 wg | 111 (107–115) / 67.5 (63–71) | 110,6 (107.3–117.5) / 70.4 (66.4–73.4) | 117 (114–122) / 71 (69–76) | 98 (93–100) / 58 (54–60) | 120a (114–127) / 74a (68–79) | 120.9a (113.7–123.9) / 74.5a (69.7–80.4) | 128a (121–135) / 76.5a (72–82) | 108a (102–118) / 64a (59–70) | 130b (125–135) / 79b (72–86) | 127.9b (120.4–133.3) / 81.8b (78–85.5) | 130b (124–138) / 80.5b (73–85) | 123b (109–135) / 71.5b (67–74) |
31–34 wg | 111 (106–118) / 70 (64–75) | 111.7 (106–118.6) / 70.5 (67.4–73.4) | 120 (115–126) / 75 (72–77) | 99 (96–104) / 59 (55–62) | 120a (115–127) / 75a (71–82) | 121.2a (115.6–126.8) / 76.6a (71.3–81.2) | 131a (124–136) / 78a (73–83) | 113a (108–120) / 65a (61–71) | 127b (123–134) / 80b (74–86) | 127.4b (118.3–131.2) / 80.2b (76.8–83.7) | 136.8b (127–141) / 82.8b (76–87.5) | 125.5b (117.5–134.5) / 73.5b (68.5–77.5) |
35–41 wg | 111 (103–119) / 69.5 (63–76) | 113.8 (109.9–121.7) / 72.7 (67.2–76.2) | 121 (118.3–125.3) / 73.8 (69.8–77.5) | 105 (102–106.8) / 60 (56.5–65.8) | 121.5a (117–129) / 78a (73–83) | 121.9a (116.9–127.2) / 77.3a (73.3–83.3) | 134a (127–141) / 81a (77–85) | 119a (111–125.5) / 69a (65–74.5) | 129b (127–132) / 84b (82–88) | 126.1b (121.8–131.1) / 83.5b (75.3–87) | 135b (131–137) / 82b (76–88) | 128b (120–136) / 78b (72–82) |
6–8 weeks postpartum | 116 (113–120) / 71 (66.5–72) | 112.9 (107.2–117.1) / 72.9 (71.1–74.9) | 119 (116–119) / 76 (73–79) | 107.5 (106–112.5) / 64 (60–68) | 126a (121–135) / 75a (70–83) | 119.4a (113.5–124.4) / 78.2 (73.1–83) | 133a (126–140) / 83a (77–87) | 118a (109–128) / 69 (63–75) | 125b (120–132) / 80b (71–86) | 118.4 (114.5–129.7) / 80.3b (73.2–86.9) | 135b (125–139) / 84b (78–89) | 113 (107–124) / 70 (63–77) |
6 months postpartum | 116 (115–117) / 69 (63–72) | 110.5 (108.7–121.3) / 72.6 (70.8–75.4) | 126 (125–127) /78 (77–79) | 105 (104–110) / 63 (61–67) | 127a (120–136) / 77a (70–83) | 120.4 (115.6–124.3) / 78.4 (73.9–82.7) | 135a (127–140) / 83 (77–87) | 115a (108–122) / 66 (62–73) | 128b (117–132) / 76b (71–83) | 119.3 (110.1–126.3) / 79.2 (74.4–83.6) | 135b (123–140) / 83 (77–88) | 118 (107–127) / 68 (63–75) |
>12 months postpartum | 114 (113–115) / 68 (66–70) | 115.1 (110.6–121.7) / 77.6 (73.3–83.2) | 121 (119–122) / 75 (75–76) | 103 (101–106) / 60 (59–62) | 124a (119.5–135.5) / 75.5a (68.5–84.5) | 118.1 (115.8–123.6) / 78 (74.8–82.8) | 132.5a (127.5–138) / 81a (75.5–86.5) | 115a (107.5–125) / 64.5a (62.5–71.5) | 129b (116–134) / 79b (71–83) | 114.6 (107.3–128) / 75.4 (70.8–83.2) | 132 (124–139) / 82b (78–85) | 110b (107–114) / 66 (61–70) |
The differences in HBPM, OBPM, and ABPM values between the 2 hypertensive groups (ie, HT+PE and HT alone) are shown in Table 4. The PE patients, as compared with uncomplicated hypertensive patients, had higher SBP and DBP values on OBPM from 23 weeks of gestation until delivery (P <0.05). PE was recognized on average at 32.8 (range, 20–39) weeks of gestation. The SBP HBPM values were similar, but significant differences in DBP were found between the examined populations (HT and HT+PE) between 27 and 34 weeks of gestation. The mean daytime BP values of ABPM did not differ significantly between the HT and HT+PE groups, except for DBP between 31 and 34 weeks of gestation. For the mean night‑time BP on ABPM, the differences were significant from 23 weeks of gestation until delivery (P <0.05), and they were the greatest when HBPM and OBPM assessments were compared. The differences in HBPM and OBPM between the HT and HT+PE groups ranged from 4.5/4 to 7/7.3 mm Hg for SBP/DBP, whereas the differences in the night‑time SBP/DBP ABPM readings ranged from 9/9 to 16.5/9 mm Hg. These findings are presented in Table 4. Postpartum, from over a month postdelivery till 1 year of follow‑up, there were no significant differences between BP readings of PE and uncomplicated hypertensive patients, regardless of the method of BP assessment.
Visit | OBPM ΔSBP/ΔDBP, mm Hg | HBPM ΔSBP/ΔDBP, mm Hg | Daytime ABPM ΔSBP/ΔDBP, mm Hg | Night‑time ABPM ΔSBP/ΔDBP, mm Hg |
Differences were calculated by subtracting the median values of uncomplicated patients with hypertension from the values of complicated patients (hypertension + preeclampsia).
a Significant difference (P <0.05)
| ||||
<15 wg | 2.25/10.33 | –0.93/1.39 | 8/7 | 20.5/12.33 |
15–18 wg | –3/–1 | 4.61/2.63 | 3/–0.75 | 2/5.5 |
19–22 wg | 1/2.5 | 3.82/4.55 | 5/–0.5 | 13/7 |
23–26 wg | 4a/4.5a | 7.15a/4.43 | 3/1.5 | 16.5a/9a |
27–30 wg | 10a/5a | 7.03a/7.29a | 2/4 | 15a/7.5a |
31–34 wg | 7a/5a | 6.14a/3.64a | 5.75/4.75a | 12a/8.5a |
35–41 wg | 7.5a/6a | 4.23a/6.22 | 1/1 | 9a/9a |
6–8 weeks postpartum | –1/5 | –1/2.08 | 2/1 | –5/1 |
6 months postpartum | 1/–1 | –1.07/0.85 | 0/0 | 3/2 |
>12 months postpartum | 5/4.5 | –3.44/2.62 | –0.5/1 | –5/1.5 |
The BP profiles throughout pregnancy and postpartum in the HT, HT+PE, and control groups are presented in Figure 1 for OBPM, in Figure 2 for HBPM, and for daytime and night‑time ABPM in Figure 3. A comparison of different methods of BP assessment in a healthy pregnant population showed that office SBP was usually slightly higher than home SBP, and that the opposite was true for DBP. After pregnancy, higher SBP was more common on HBPM than OBPM. For DBP, the difference was even more significant, with higher HBPM than OBPM readings. This was probably related to the white coat effect, which is suspected to be stronger during pregnancy. In the control and uncomplicated hypertension groups, the daytime ABPM values, both for SBP and DBP, were usually the highest throughout pregnancy and postpartum, as compared with other methods of BP assessment, while the night‑time ABPM values were the lowest. In the PE+HT group; however, the night‑time SBP and DBP values were higher, and much closer to those of HBPM and daytime ABPM, from 19 weeks of gestation until delivery.
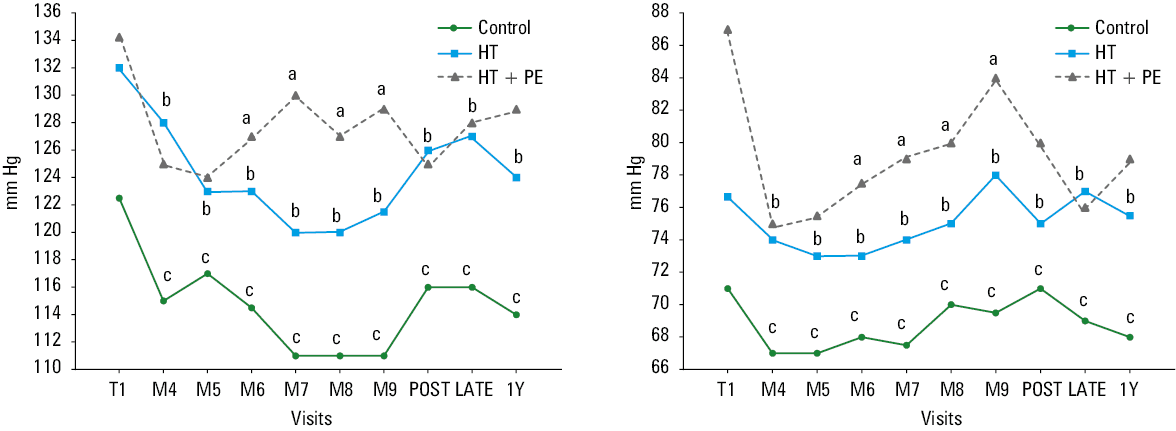
a Significant difference (P <0.05) between the hypertensive uncomplicated group (HT group) and the preeclamptic group (HT+PE group)
b Significant difference (P <0.05) between the control group and the hypertensive uncomplicated group (HT group)
c Significant difference (P <0.05) between the control group and the preeclamptic group (HT+PE group)
Abbreviations: M, month; POST, 6 weeks postpartum; LATE, 6 months postpartum; T1, first trimester; Y, year
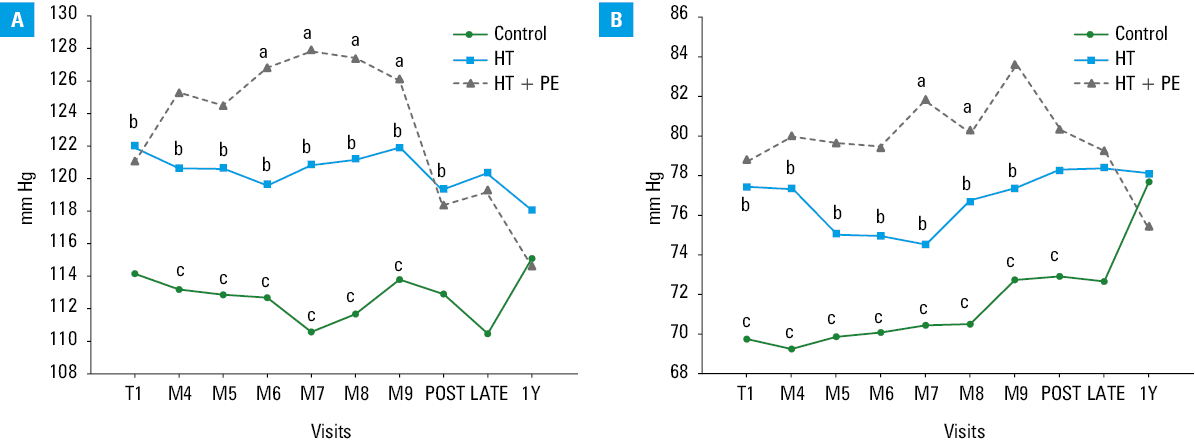
a Significant difference (P <0.05) between the hypertensive uncomplicated group (HT group) and the preeclamptic group (HT+PE group)
b Significant difference (P <0.05) between the control group and the hypertensive uncomplicated group (HT group)
c Significant difference (P <0.05) between the control group and the preeclamptic group (HT+PE group)
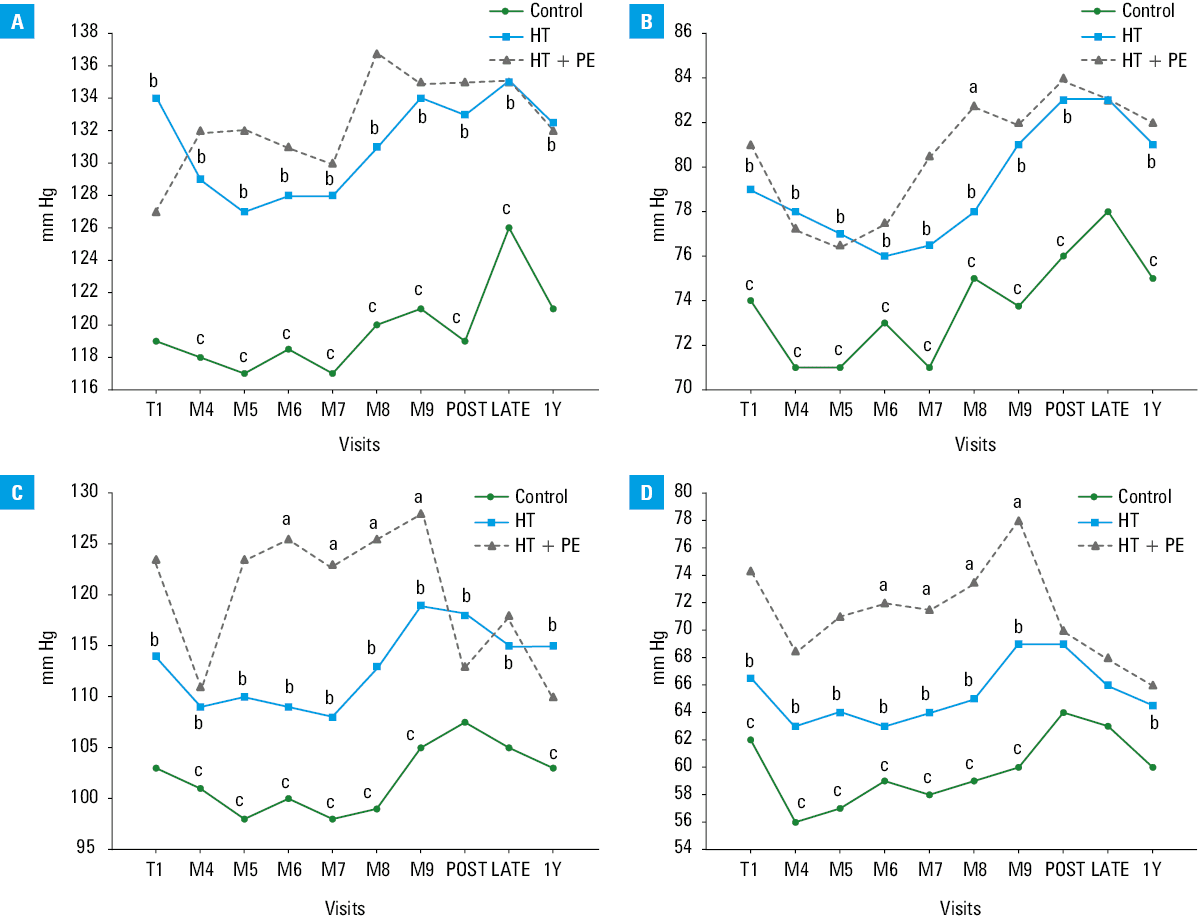
The ROC curves for prediction of PE with night‑time ABPM at 23–26, 27–30 and 31–34 weeks of gestation were created, and Bland–Altman plots were prepared to present the potential differences between the methods of BP assessment (Supplementary material).
Discussion
This study showed that BP values in healthy pregnancies were significantly lower than normal range for the general population. On average, the SBP and DBP values were by 15–20 mm Hg lower on OBPM, HBPM, and ABPM throughout the entire pregnancy. Our observations and data from previous studies support the opinion that BP requires separate reference values in the pregnant population. Attempts to propose normal values for pregnancy have already been made. For example, Lv et al14 proposed defining AH as occurring in at‑risk women if BP was higher than 130/80 mm Hg for daytime, 120/75 mm Hg for night‑time, and 130/75 mm Hg for 24‑hour measurements. Even though these specifications were only established for the third trimester, in which BP is the highest, their results still support the claim for separate pregnancy‑related BP values. Mikami et al15 reported that HBPM values equivalent to clinical BP of 140/90 mm Hg were 120.8/83.5 mm Hg, 126/85.2 mm Hg, and 136.3/89.3 mm Hg in the first, second, and third trimester, respectively. The authors concluded that HBPM values in normotensive pregnancies, which indicate a risk of AH, may be lower than 135/85 mm Hg before 28 weeks of gestation. A meta‑analysis of 39 studies published in 2019 assessed OBPM values in uncomplicated pregnancies.16 The results were clear: SBP was the lowest at 10 weeks of gestation (110.6 mm Hg), increasing to 116 mm Hg at 40 weeks. Similarly, mean DBP was the lowest at 21 weeks of gestation (65.9 mm Hg), increasing to 72.8 mm Hg at 40 weeks. These findings also demonstrated the results far below 140/90 mm Hg for OBPM as the population norm. Furthermore, Ayala et al17 and Hermida et al18 reported patterns of ABPM during pregnancy, where the highest values of BP in normotensive women were not higher than 130/80 mm Hg, even at the end of pregnancy. The latest 2024 ESH position statement on pregnancy hypertension mentions that women in healthy pregnancy seem to have lower SBP and DBP values than previously assumed, that is, below 130/80 mm Hg during the entire gestation. It is disappointing that the latest ESH document on the subject has not updated the cutoff points.5 Further studies are needed to determine if elevated BP should be treated or just observed as a risk factor, with more aggressive prevention strategies implemented. It is not known whether earlier antihypertensive treatment would have a beneficial influence on fetal development. Therefore, further research is warranted.
In our study, observations of BP with all available noninvasive methods, including OBPM, HBPM, and ABPM, showed significant differences not only between normotensive pregnant controls and hypertensive pregnancies throughout the entire pregnancy (even though hypertensive patients were treated, with good BP control), but also between women in whom PE would develop and those with uncomplicated hypertension, where significant differences were noted from 23 weeks of gestation until delivery. These differences between PE and uncomplicated hypertension were visible much earlier than PE was recognized, even 2 months before. The PE patients exhibited a distinct lack of decrease in BP during the first half of pregnancy, a typical pattern observed in normotensive pregnancies. The elevation of SBP in comparison with that from a previous visit was already visible at the first assessment (<15 weeks of gestation) on daytime ABPM and HBPM, and from 19 weeks of gestation on night‑time ABPM, while on OBPM it was visible from 23 weeks of gestation. Similar conclusions on the predictive value of the elevation of BP at midpregnancy were drawn from the Nulliparous Pregnancy Outcomes Study,8 which divided women into 3 groups based on their BP trajectories. The first group had rising BP between the first and second trimester (≥5 mm Hg), the second group had stable BP, and the third had falling BP (≤–5 mm Hg). The authors found a clear correlation between these BP trajectories and the risk of hypertensive complications. Also, retrospective studies by Gunderson et al19,20 investigating OBPM values up to 20 weeks of gestation, revealed a correlation between BP trajectories and PE. In a meta‑analysis of 128 studies,9 normotensive pregnancy was characterized by a decrease in SBP and DBP up to 4 mm Hg in the second trimester, with gradual elevation thereafter until delivery, and BP was not higher than 130/80 mm Hg. Conversely, hypertensive pregnancies did not exhibit this clinically moderate but significant midpregnancy drop. The analysis of OBPM assessed once per trimester from the Generation R Study21 demonstrated that BP changes from the second to third trimester (but not from the first to second trimester) were positively associated with the risk of gestational hypertension and PE. Other authors, based on serial office measurements only, denied the existence of a midtime BP drop in normal pregnancy.22
In our study, the gap between BP in PE and uncomplicated hypertension groups was the greatest at 23–26 weeks of gestation, and did not increase further for any assessment method, most probably due to appropriate antihypertensive treatment administered to AH patients. As BP rises in the second half of pregnancy after a physiological fall in the first trimester, the number of women requiring treatment increases after the 20th week of gestation. This means that the differences between the HT and HT+PE groups might have been reduced at subsequent visits, as compared with initial ones (before starting of individualized treatment). However, when the treatment aimed at the same BP levels, significant differences between the HT and HT+PE groups were still observed. It is crucial to understand the physiological profile of BP at different stages of pregnancy. Pregnancy is a time when women’s BP should be much lower than in the general population. This fact allows for identification of at‑risk women and their close monitoring in specialized centers. After a thorough examination, we could recommend a more aggressive form of prevention, such as using low‑molecular‑weight heparin in these patients. BP assessment in each trimester must be included in PE risk scales, as is fetal development on ultrasound.23
Moreover, the current study showed that there were differences in the results of the 3 methods of BP assessment during pregnancy. To the best of our knowledge, this is the first study to examine prospectively and monthly all 3 basic clinical methods of BP assessment, such as OBPM, HBPM, and ABPM in the same pregnant population, with a postpartum division into controls, PE pregnancies, and uncomplicated hypertensive pregnant patients, based on their clinical outcomes. The study found that the differences between PE and uncomplicated HT patients were the most pronounced for night‑time ABPM, with values higher in future PE patients by 16.5 mm Hg for SBP and 9 mm Hg for DBP at 23–26 weeks of gestation, whereas for OBPM or HBPM measurements, the maximum gaps were 10/5–6 mm Hg for SBP and 7.2/7.3 mm Hg for DBP, respectively. These differences demonstrate that mean night‑time BP on ABPM is the most effective method for early recognition of PE, outperforming the other assessed methods of BP measurement. Further examination of this thesis is essential for future studies on this subject. In contrast to night‑time ABPM, daytime ABPM shows the lowest differences between complicated and uncomplicated hypertension in pregnancy among all BP measurement methods evaluated. We assume this is because of the specificity of this form of BP evaluation. The mean daytime ABPM is an average value from measurements performed during regular daily activities, and is not restricted by the 5 minutes of rest before each measurement that is advised for HBPM and OBPM. Furthermore, it is clear that physical exertion has a significant impact on BP, particularly during pregnancy, with this effect increasing as the pregnancy progresses. Studies on sleep hypertension in women with PE on ABPM were published earlier,24,25 with its significance often overlooked. This was because it was assessed mostly in patients with already recognized proteinuria, where the risk was evident on conventional daytime BP measurements.6,26 Our prospective monthly observations show that the mean night‑time BP on ABPM might be superior to daytime BP on ABPM, HBPM, or OBPM in assessing PE risk. Saremi et al27 found that the mean night‑time BP drop in the second trimester was a strong predictor of the forthcoming pregnancy‑induced HT and PE. In our study, OBPM and HBPM yielded similar results in terms of differences between complicated and uncomplicated hypertension during pregnancy. According to data from 76 high‑risk pregnancies, OBPM and HBPM may overlook respectively 37.4% and 38.4% cases of hypertension visible on ABPM, while in the case of normal ABPM, uncontrolled values of OBPM and HBPM will be found only in 11% and 9.6% of measurements, respectively.28,29
Each method of BP assessment has its strengths and weaknesses. Unattended OBPM could be of additive value.30 In our opinion, in clinical practice, all 3 methods are important in the management of pregnancy‑related hypertension, and should be used jointly. Our results concerning the risk of PE clearly demonstrate that relevant clinical decisions in the context of pregnancy‑related hypertension must be made with ABPM. The presented data show that adding midpregnancy (23–26 weeks of gestation) ABPM night‑time values to algorithms for predicting PE, such as that of the Fetal Medicine Foundation, will significantly enhance sensitivity of the tools based only on office BP readings.31-34
Limitations
There are several limitations to our study, which need to be addressed. We included a relatively small number of patients, as compared with large clinical trials on AH in the general population, which limits the possibility of statistical analysis. However, for prospective assessment of the hypertensive pregnant population, a difficult‑to‑analyze subgroup of patients, it seems to be sufficient and of additive value in comparison with available research in the literature. Furthermore, as the study protocol was based on practical experience with pregnancy management and the research was performed in real clinical setting, the number of visits per patient was restricted. This was because the patients were recruited at different time points during pregnancy and, due to obstetrical contraindications or premature birth, did not attend all planned pregnancy visits at 4‑week intervals. In addition, for HBPM, the patients used their own electronic BP arm‑cuff devices, which were not standardized. All patients were instructed on appropriate measurement techniques at the first visit, and at every following visit they were given and subsequently returned unified charts with HBPM results.
Conclusions
Regardless of the method of BP assessment used, BP values in hypertensive pregnancies differed significantly from those of normotensive patients at all pregnancy stages and postdelivery, even though good BP control with antihypertensive drugs was achieved in the hypertensive population.
PE patients were characterized by significantly higher BP values on HBPM, OBPM, and night‑time ABPM than uncomplicated hypertensive patients, even at 2 months before the average time of PE diagnosis. Significant differences in BP values were found from 23 weeks of gestation until delivery.
The mean daytime BP on ABPM did not differ significantly between complicated and uncomplicated hypertensive patients during pregnancy. The mean night‑time BP on ABPM seems to be the most effective predictor and diagnostic tool for early recognition of PE. This is because the difference between the 2 groups was the largest for this parameter.
There were no significant differences between BP values of PE+HT patients and uncomplicated hypertensive patients between 1 month postdelivery and 1 year of follow‑up, regardless of the method of BP assessment.
- Roberts CL, Algert CS, Morris JM, et al. Hypertensive disorders in pregnancy: a population‑based study. Med J Aust. 2005; 182: 332‑335. | Crossref
- Backes CH, Markham K, Moorehead P, et al. Maternal preeclampsia and neonatal outcomes. J Pregnancy. 2011; 2011: 214365. | Crossref
- Morton A. Physiological changes and cardiovascular investigations in pregnancy. Heart Lung Circ. 2021; 30: e6‑e15. | Crossref
- Ngene NC, Moodley J. Physiology of blood pressure relevant to managing hypertension in pregnancy. J Matern Neonatal Med. 2019; 32: 1368‑1377. | Crossref
- Thomopoulos C, Hitij JB, De Backer T, et al. Management of hypertensive disorders in pregnancy: a position statement of the European Society of Hypertension Working Group ‘Hypertension in Women’. J Hypertens. 2024; 42: 1109‑1132. | Crossref
SUPPLEMENTARY MATERIAL
ARTICLE INFORMATION