Light pollution exposure and a risk of hospitalization for cardiovascular disease in Poland: a population-based study (EP-PARTICLES study)
Key words: cardiovascular diseases, environment, light pollution

 CC BY 4.0
Light pollution exposure and a risk of hospitalization for cardiovascular disease in Poland: a population-based study (EP-PARTICLES study)
Introduction: Cardiovascular diseases (CVDs) remain the leading cause of death worldwide. Recently, attention has expanded beyond traditional risk factors to include nonclassical ones, such as light pollution (LP).
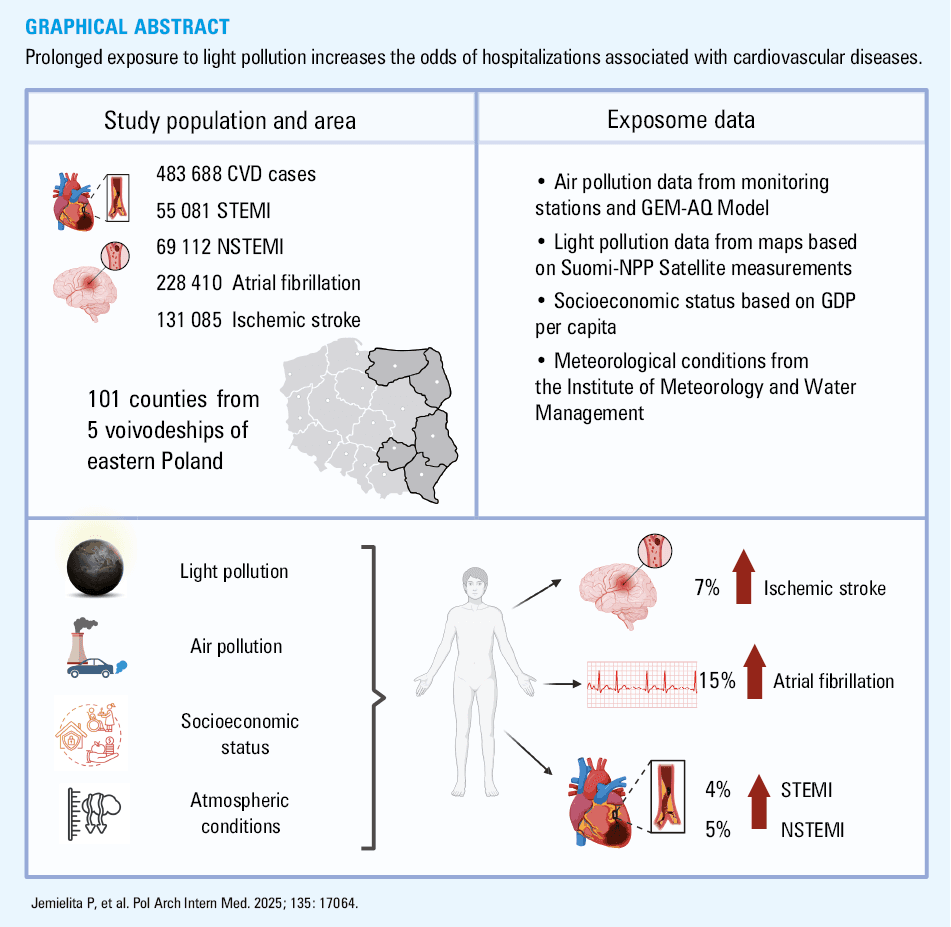
Objectives: This study aimed to assess the impact of LP exposure on hospitalizations due to CVDs.
Methods: Data from the years 2012–2020 on light and air pollution were obtained from the Suomi NPP satellite, Copernicus System, and local monitoring stations. Hospitalization data for new‑onset cases of ST‑segment elevation myocardial infarction (STEMI), non‑STEMI (NSTEMI), atrial fibrillation (AF), and ischemic stroke (IS; based on the International Classification of Diseases, Tenth Revision codes) were obtained from the Polish National Health Fund. The analysis covered 101 counties in 5 eastern Poland voivodeships, using sex- and age‑standardized incidence rates and panel Poisson regression models. Confounding variables included air pollution, socioeconomic status, and meteorological factors.
Results: The study included 55 081 hospitalizations for STEMI (64.6% men; mean [SD] age, 67.5 [12.5] y), 69 112 for NSTEMI (60.9% men; mean [SD] age, 70.2 [11.9] y), 228 410 for AF (47.3% men; mean [SD] age, 69.6 [11.2] y), and 131 085 for IS (48.4% men; mean [SD] age, 73.9 [12.2] y). LP intensity was calculated as an area‑weighted county‑level yearly average. An increase by one interquartile range (2479.42 nW/cm²/sr) in LP was linked to a 7% rise in odds of hospitalization for acute IS (odds ratio [OR], 1.07; 95% CI, 1.05–1.1) and a 15% rise for acute AF (OR, 1.15; 95% CI, 1.13–1.17) in models with the highest number of confounding variables included. Significance for STEMI and NSTEMI was found in some models.
Conclusions: Prolonged LP exposure may increase the odds of cardiovascular hospitalizations, especially for IS or AF.
What's new?
This is the first study in Poland to evaluate the association between light pollution (LP) and hospitalizations for cardiovascular diseases (CVDs) in the context of the external exposome. The study analyzed over 2 million hospitalizations within 9 years across 101 counties in eastern Poland, incorporating socioeconomic status and air pollution exposure. The effects of LP exposure vary depending on specific CVD, and are most pronounced in the case of ischemic stroke and atrial fibrillation. These findings underscore the harmful effects of nontraditional environmental risk factors on cardiovascular health, offering new insights into the broader implications of exposure to LP.
Introduction
Cardiovascular diseases (CVDs) remain a significant public health and socioeconomic challenge. Despite substantial progress in both the prevention and treatment methods, CVDs continue to be the leading cause of mortality globally.1 Furthermore, the economic burden associated with comprehensive care for patients with CVD is immense, with scientific studies estimating it at 282 billion EUR annually for the population of the European Union.2 For many years, efforts have been directed toward reducing the prevalence of well‑established, classic, and modifiable populational cardiovascular risk factors, such as smoking, hypertension, excessive body mass index (BMI), and lack of physical activity. However, in recent years, increasing attention has been given to the threats arising from the exposome, defined as the cumulative adverse impact of all environmental hazards to which an individual is exposed from birth to death.3
One component of the exposome is air pollution (AP), whose harmful effects on CVD occurrence are relatively well documented.4-7 AP is associated with a higher number of attributable deaths than risk factors such as elevated low‑density lipoprotein cholesterol levels, kidney dysfunction, or high BMI.8 In recent years, the influence of other nonclassical cardiovascular risk factors has been increasingly recognized—one of which is light pollution (LP). This environmental risk factor is defined as an alteration in night sky brightness caused by anthropogenic light emissions.9 The prevalence of this pollutant was demonstrated by Falchi et al,9 showing that 83% of the global population and 99% of the populations in Europe and the United States live under light‑polluted night sky.
The association between exposure to LP and the prevalence and mortality caused by CVDs is a relatively new area of research. However, findings from recent publications, including a study by Sun et al,10 demonstrate a growing importance of this issue, given that increased LP intensity was associated with a higher risk of both hospitalization and death due to coronary artery disease (CAD). These results underscore the need for further comprehensive investigations into the impact of this nonclassical risk factor on human health.
Equally important is understanding the mechanisms through which exposure to nontraditional cardiovascular risk factors, such as LP, contributes to increased CVD risk. One widely discussed mechanism linking LP to adverse cardiovascular outcomes is a disruption of the circadian rhythm. LP can alter sleep architecture by reducing melatonin secretion and modifying the duration of sleep stages.11 Sleep disturbances negatively impact the expression and function of circadian‑regulated genes, leading to endothelial dysfunction, impaired coagulation regulation, dysregulated blood pressure and heart rate—all of which are pathways to CVD development.12 Another significant consequence of the circadian rhythm disruption is its impact on mental health, which is increasingly recognized as an indirect but potent contributor to CVD risk,13,14 underscoring the multifaceted effects of circadian dysregulation. Despite growing evidence, further research is urgently needed to elucidate the precise mechanisms by which the exposome, including LP, affects human health. Such studies could pave the way for targeted interventions and improved preventive strategies.
Given the significant public health, economic, and social burden of CVDs, as well as the pressing need to identify and evaluate new, nonclassical harmful risk factors, our study assessed the relationship between LP intensity and the odds of hospitalizations for newly‑diagnosed ischemic stroke (IS), atrial fibrillation (AF), and myocardial infarction (MI), categorized as ST‑segment elevation MI (STEMI) and non‑STEMI (NSTEMI). The critical importance of these CVDs is underscored by the number of deaths they cause; for example, in 2021, they accounted for over 13.5 million deaths worldwide.1 Our analysis, which covered 101 counties in eastern Poland and accounted for socioeconomic status (SES) and other exposome components, such as AP, addresses a significant gap in the current understanding of harmful effects of LP. The findings emphasize the need for further research on this emerging environmental risk factor.
Patients and methods
Study design
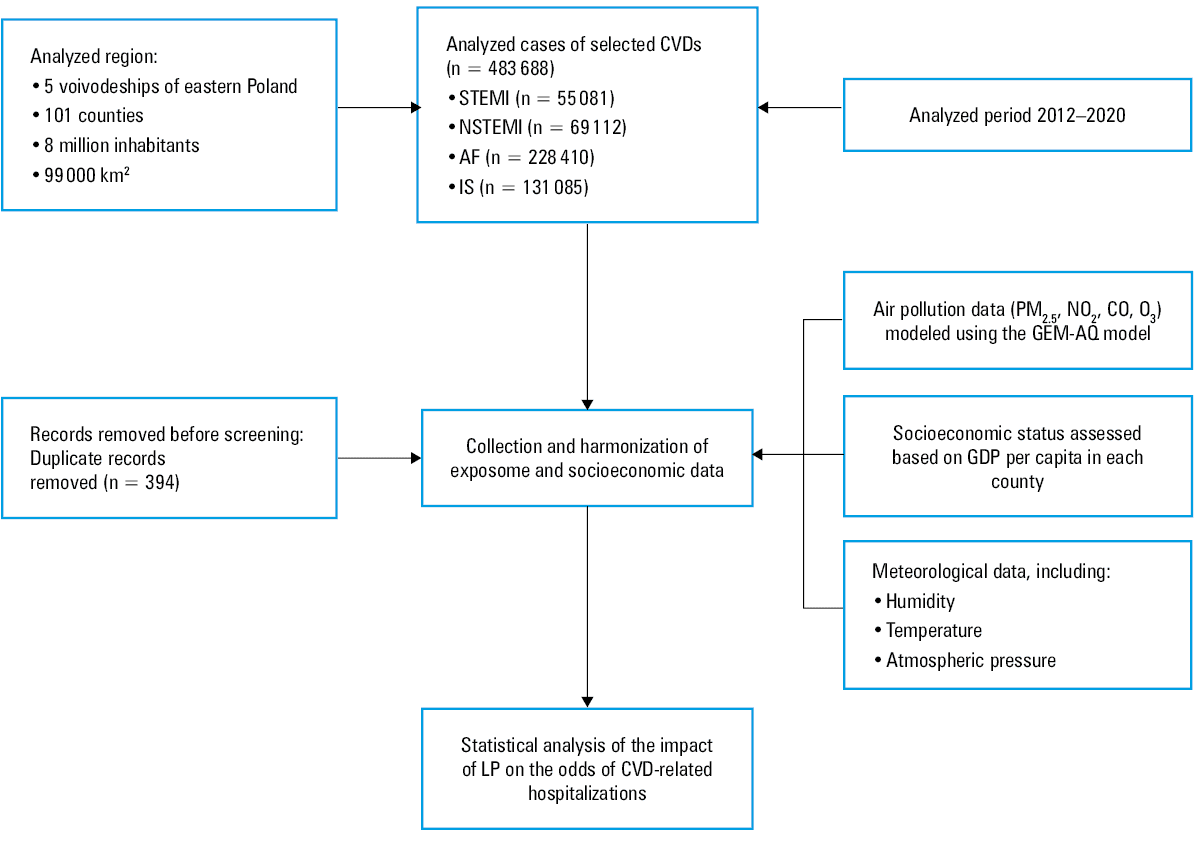
This study employed a longitudinal model covering the years 2012–2020 in eastern Poland to assess the impact of chronic exposure to LP on cardiovascular health outcomes. Exposure variables were derived from the National Aeronautics and Space Administration (NASA) and other organizations’ satellite system and were aggregated at the annual level for all counties included in the analysis. Based on available satellite data, including night‑time light intensity, a selection process was conducted to identify the indicator that best represents the actual burden of LP. Following a literature review, minimization of data gaps, and the need for standardization independent of latitude and altitude, the area‑weighted night‑light radiance (nW/cm²/sr) was chosen for the final analysis. This metric accounts for both the light intensity detected by satellites and the geographic area of a given region, allowing for a more precise assessment of actual LP levels. The use of this indicator enables a more realistic evaluation of exposure than conventional metrics based solely on raw radiance values. By weighting for surface area, the index does not favor highly urbanized regions, where naturally higher light emissions occur, thus eliminating potential biases resulting from data aggregation. This approach prevents artifacts where higher light levels would merely reflect a larger population size and more intensive urban infrastructure development. A key element of the analysis was the use of individual‑level patient data, which were subsequently aggregated at the county level. This method prevented errors related to the aggregation of disease cases in urban environments, which could lead to misleading conclusions suggesting an association driven solely by higher concentrations of health care facilities and urban populations. Dependent variables included hospitalization rates for CVDs, based on over 2 million individual cases, obtained from the Polish National Health Fund. Due to the nature of the data, differences in reporting across regions, and inconsistencies in diagnosis coding, the final analysis focused on acute hospital admissions for NSTEMI, STEMI, AF, and IS. To ensure comparability between regions, standardized hospitalization rates (SHRs) were calculated for each county, effectively eliminating variations due to demographic differences and urbanization levels. Standardization was conducted with reference to the population of 27 countries of the European Union. To account for potential confounding factors, the analysis incorporated data on AP, SES, and meteorological conditions. AP exposure was determined based on the concentrations of particulate matter with diameter below 2.5 µg (PM2.5), nitrogen dioxide (NO2), carbon oxide (CO), and ozone (O3), while SES was assessed using gross domestic product (GDP) per capita. Meteorological conditions, including temperature, humidity, and atmospheric pressure, were also considered. All variables were aggregated at the annual level for each county, facilitating the assessment of long‑term effects of LP exposure on the population health. The study design is presented in Figure 1.
Abbreviations: AF, atrial fibrillation; CVD, cardiovascular disease; CO, carbon monoxide; GDP, gross domestic product; IS, ischemic stroke; LP, light pollution; NSTEMI, non–ST‑segment elevation myocardial infarction; O3, ozone; PM2.5, particulate matter with diameter below 2.5 µm; STEMI, ST‑segment elevation myocardial infarction
Study area
The study encompassed 101 counties across 5 voivodeships in eastern Poland. These regions are characterized by a relatively high proportion of rural and green areas, and are commonly perceived as having residents with a low SES.15 The area of the study was selected due to its similar levels of urbanization and socioeconomic conditions, which are crucial factors when identifying populations particularly vulnerable to environmental pollutants. Additionally, these regions are often mischaracterized as free from environmental risks—a notion contradicted by emerging evidence.16
Hospitalization data
Individual hospitalization data were obtained from the Polish National Health Fund, and included all emergency admissions where the primary diagnosis was coded as IS, AF, NSTEMI, or STEMI, according to the International Classification of Diseases, Tenth Revision codes I63, I48, I21.4, and I21.X, respectively. Anonymized data on patient age, sex, and place of residence (based on the National Official Registry of Territorial Division of the Country registry) were also collected, along with unique patient identifiers to prevent duplicate analyses of hospitalizations for the same individual.
Light pollution data
LP intensity data were obtained from the LP map,17 developed by the German Research Centre for Geosciences as part of the Horizon 2020 Framework Programme: ERA‑Planet / GEOEssential.18 This application enables retrieval of radiance data for specific areas. Our study utilized data starting from 2012, when observations from the Suomi National Polar‑orbiting Partnership (SUOMI NPP) satellite became available. This satellite, developed and operated jointly by NASA, National Oceanic and Atmospheric Administration, and Department of Defense, is equipped with the Visible Infrared Imaging Radiometer Suite, an optical‑mechanical scanner that captures the Earth’s surface in 22 spectral bands. One of these bands, the day‑night band was specifically designed for night‑time observations.19 Measurements are conducted in real time, with data released in monthly intervals at a spatial resolution of 750 meters per pixel.20 The areas of the 101 counties in eastern Poland were overlaid on the LP map data using boundary information from the National Boundary Register. Yearly radiance sums for these regions were subsequently calculated as area‑weighted averages.
Confounding variables data collection
AP data were obtained from local monitoring stations and analyses developed in collaboration with the Institute of Environmental Protection – National Research Institute, utilizing the innovative Global Environmental Multiscale – Air Quality model,21,22 and used as confounding variables. This model supports air quality forecasting and assessment across Europe, and serves as a partner in the Copernicus Atmosphere Monitoring Service,23 part of the European Union’s Earth Observation Programme. Concentrations of pollutants, such as PM2.5, CO, NO2, and O3 were estimated using county resolution grids. Moreover, data on SES obtained as GDP per capita at the county level, sourced from the National Freedom Institute, were included.24 These data are particularly important, as SES is associated with the impact of the exposome on human health.25 Furthermore, as in our previous study,4 meteorological data, including temperature, relative humidity, and atmospheric pressure, were obtained from the Polish Institute of Meteorology and Water Management. These data were recorded in standardized meteorological enclosures with automated measurements at regular intervals. The recordings ensured precision, with temperature and pressure accurate to 0.1 °C or hPa, and humidity to within 1%.
Statistical analysis
The analysis employed a panel regression model with fixed effects for the years 2012–2020, considering panel units at the county level. As some months had missing observations for LP and other variables (with the overall data loss below 3%), the final dataset consisted of 909 panel units. The verification of overdispersion indicated its absence (P <0.001), justifying the use of the Poisson model. The fixed‑effects model was confirmed by the Hausman test (P <0.001), ensuring control over unobserved differences between counties and eliminating bias resulting from spatial heterogeneity. The statistical analysis included 10 regression models, gradually expanding the scope of controlled variables. Model 1 (crude model) assessed the sole impact of LP. Model 2 was extended to include SES. Model 3 further incorporated meteorological conditions, such as temperature, atmospheric pressure, and humidity. Consecutive models controlled for the impact of individual APs: model 4 included NO2, model 5 PM2.5, model 6 O3, model 7 CO, and model 8 analyzed the combined effect of NO2 and PM2.5. Model 9 included NO2, PM2.5, and CO, whereas model 10 included NO2, PM2.5, and O3. At each stage of the model construction, sensitivity analyses were conducted, including testing alternative data aggregation methods, such as logarithmic transformations and spline functions, as well as exploring different temporal exposure windows. Model fit was assessed based on the Akaike information criterion and likelihood ratio test, while variance explainability was analyzed using the pseudo R2 metric. The results were presented as odds ratio (OR) for an interquartile range (IQR) increase in LP exposure (2479.42 nW/cm²/sr), along with 95% CIs. The Kendall τ test was used to assess the presence, direction, and significance of temporal trends in SHRs over the study period. The Theil–Sen estimator was employed to quantify the annual rate of change in SHRs.
All analyses were performed using Stata statistical software, (version 18, 2023, StataCorp, College Station, Texas, United States), MS Excel (version 16.78.3, 2023, Microsoft, Redmond, Washington, United States). A P value below 0.05 was considered significant for all tests.
Ethics
The study protocol conformed to the ethical guidelines of the 1975 Declaration of Helsinki and was approved by the Bioethics Committee of the Medical University of Bialystok (APK.002.547.2023).
Results
During the study period, data on over 2 million individual hospitalizations were obtained, including 55 081 emergency admissions due to STEMI, 69 112 due to NSTEMI, 228 410 cases of AF, and 131 085 cases of IS. The majority of NSTEMI cases involved men (60.9%) at a mean (SD) age of 70.2 (11.9) years. Similarly, STEMI hospitalizations predominantly affected men (64.6%) at a mean (SD) age of 67.5 (12.5) years. Conversely, the majority of hospitalizations for AF (52.7%) and IS (51.6%) involved women. The mean (SD) age was 73.9 (12.2) years for the IS patients, and 69.6 (11.2) years for the individuals with AF.
Median (IQR) SHR per 100 000 population was calculated for each condition and amounted to 80.83 (66.2–99.12) for STEMI, 107.62 (79.85–131.81) for NSTEMI, 279.92 (183.51–468.5) for AF, and 207.18 (172.16–244.71) for IS. Detailed baseline characteristics of the analyzed population and SHR values and trends are presented in Table 1 and in Supplementary material, Figure S1.
Cause of hospitalization, y | Hospitalizations, n | Age, y | Men, % | Women, % | SHR |
Data are presented as mean (SD) unless indicated otherwise.
Abbreviations: SHR, standardized hospitalization ratio; others, see Figure 1 | |||||
AF | |||||
2012–2020 | 228 410 | 69.6 (11.2) | 47.3 | 52.7 | 345.76 (231.96) |
2012 | 26 287 | 68.97 (11.24) | 46.78 | 53.22 | 344.04 (213.24) |
2013 | 26 961 | 69 (11.26) | 47.12 | 52.88 | 360.31 (219.05) |
2014 | 26 640 | 69.41 (11.18) | 46.31 | 53.69 | 356.47 (231.65) |
2015 | 26 300 | 69.4 (11.2) | 47.73 | 52.27 | 358.02 (224.5) |
2016 | 26 436 | 69.57 (11.05) | 47.87 | 52.13 | 362.29 (243.98) |
2017 | 26 795 | 69.84 (11.12) | 47.7 | 52.3 | 368.16 (250.54) |
2018 | 25 944 | 69.97 (11.16) | 47.54 | 52.46 | 357.63 (248.65) |
2019 | 25 889 | 70.2 (11.09) | 47.62 | 52.38 | 363.66 (252.26) |
2020 | 17 158 | 70 (11.19) | 46.46 | 53.54 | 241.24 (162.28) |
IS | |||||
2012–2020 | 131 085 | 73.9 (12.2) | 48.4 | 51.6 | 211.11 (58.68) |
2012 | 15 143 | 73.84 (12.01) | 46.88 | 53.12 | 221.55 (74.14) |
2013 | 15 330 | 73.95 (11.91) | 46.69 | 53.31 | 225.71 (63.04) |
2014 | 15 194 | 74.1 (12.12) | 47.37 | 52.63 | 221.22 (64.23) |
2015 | 14 861 | 74 (12.34) | 48.37 | 51.63 | 214.28 (57.11) |
2016 | 14 357 | 74.22 (12.11) | 47.88 | 52.12 | 209.18 (56.65) |
2017 | 14 419 | 73.97 (12.28) | 48.55 | 51.45 | 209.2 (54.18) |
2018 | 13 992 | 73.87 (12.25) | 49.49 | 50.51 | 202.45 (45.84) |
2019 | 14 105 | 73.65 (12.35) | 49.63 | 50.37 | 203.24 (50.97) |
2020 | 13 684 | 73.31 (12.48) | 51.38 | 48.62 | 193.15 (48.88) |
STEMI | |||||
2012–2020 | 55 081 | 67.5 (12.5) | 64.6 | 35.4 | 84.63 (30.07) |
2012 | 7363 | 67.5 (12.66) | 63.94 | 36.06 | 103.3 (35.3) |
2013 | 6868 | 67.59 (12.57) | 62.91 | 37.09 | 96.27 (38.09) |
2014 | 6448 | 67.6 (12.7) | 63.49 | 36.51 | 89.54 (32.18) |
2015 | 6305 | 67.57 (12.58) | 65 | 35 | 86.12 (27.57) |
2016 | 6106 | 67.32 (12.72) | 65.08 | 34.92 | 83.96 (27.72) |
2017 | 5891 | 67.57 (12.52) | 64.39 | 35.61 | 80.59 (24.36) |
2018 | 5480 | 67.7 (12.32) | 63.7 | 36.3 | 76.13 (25.49) |
2019 | 5547 | 67.31 (12.26) | 66.09 | 33.91 | 75.28 (19.8) |
2020 | 5073 | 67.24 (11.99) | 66.02 | 33.98 | 70.49 (18.85) |
NSTEMI | |||||
2012–2020 | 69 112 | 70.2 (11.9) | 60.9 | 39.9 | 110.05 (42.26) |
2012 | 7475 | 69.6 (12.12) | 61.24 | 38.76 | 108.32 (42.29) |
2013 | 7193 | 69.73 (11.98) | 60.18 | 39.82 | 104.37 (41.28) |
2014 | 7130 | 70.23 (12.02) | 60.06 | 39.94 | 103.88 (36.99) |
2015 | 7128 | 69.97 (11.83) | 60.04 | 39.96 | 102.15 (37.17) |
2016 | 7745 | 70.44 (12) | 61.03 | 38.97 | 110.72 (42.94) |
2017 | 8445 | 70.55 (11.95) | 60.38 | 39.62 | 120.75 (40.06) |
2018 | 8622 | 70.67 (11.77) | 61.06 | 38.94 | 122.24 (48.42) |
2019 | 8389 | 70.39 (11.91) | 61.56 | 38.44 | 118.04 (46.65) |
2020 | 6985 | 70.33 (11.53) | 62.25 | 37.75 | 100.02 (36.04) |
LP intensity was expressed in units of radiance (nW/cm²/sr). The median (IQR) value of area‑weighted radiance measurements was 2260.52 (1481.75–3961.17) nW/cm²/sr, the highest level of LP intensity reaching 23 548 nW/cm²/sr was observed in the Kielce county in 2012. Visualization of the average level of LP intensity for each county in the study period is provided in Supplementary material, Figure S2. The yearly averages of the assessed AP levels were higher than the World Health Organization threshold values.26 According to the meteorological data, mean (SD) yearly temperature was 8.97 (0.81) °C, humidity was 78.46% (2.11%), and mean (SD) atmospheric pressure was 991.78 (6.23) hPa. Detailed information about LP, atmospheric conditions, and AP data are presented in Table 2 and Supplementary material, Figure S3.
Variables | Mean | Minimum | Maximum | Median | IQR |
Abbreviations: IQR, interquartile range; others, see Figure 1 | |||||
Sum of area‑weighted light pollution, nW/cm²/sr | 3616.81 | 94.44 | 23 548.05 | 2260.53 | 1481.75–3961.17 |
PM2.5, μg/m3 | 19.93 | 9.74 | 53.39 | 19.01 | 15.62–3.45 |
NO2, μg/m3 | 7.65 | 3.19 | 19.78 | 7.35 | 5.83–9.05 |
CO, μg/m3 | 274.02 | 225.98 | 396.26 | 269.69 | 254.51–286.77 |
O3, μg/m3 | 48.17 | 37.93 | 68.91 | 47.72 | 44.83–50.9 |
GDP per capita, PLN | 32 507.69 | 16 256.82 | 76 401.57 | 30 843.79 | 25 922.2–36 908.48 |
Temperature, °C | 8.97 | 6.64 | 10.51 | 9 | 8.41–9.56 |
Humidity, % | 78.46 | 73.89 | 84.12 | 78.22 | 76.93–79.46 |
Atmospheric pressure, hPa | 991.78 | 976.48 | 1001.43 | 991.4 | 987.79–996.96 |
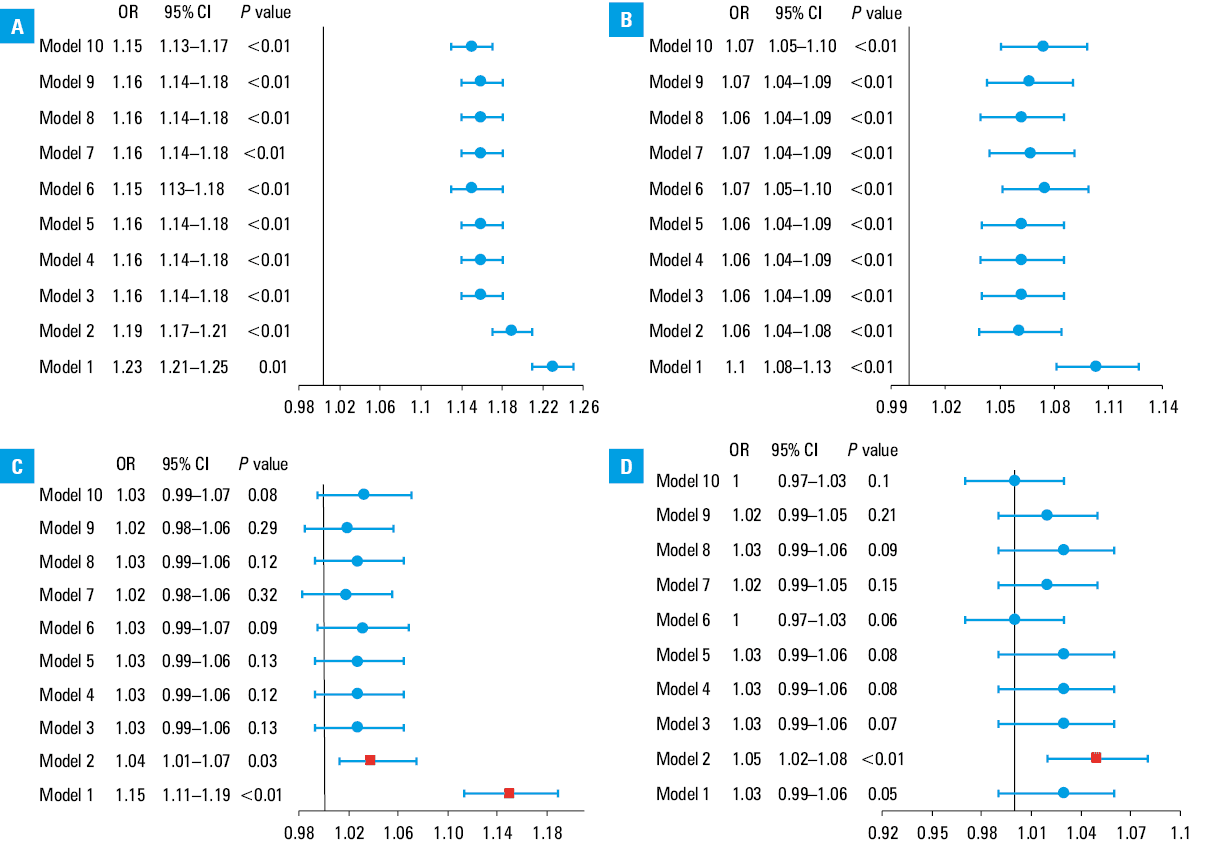
In the unadjusted model, an increase in yearly LP intensity by 1 IQR was associated with 23% higher odds of hospitalizations for AF (OR, 1.23; 95% CI, 1.21–1.25; P <0.001), a 10% increase for IS (OR, 1.1; 95% CI, 1.08–1.13; P <0.001), and a 15% increase for STEMI (OR, 1.15; 95% CI, 1.11–1.19; P <0.001). For NSTEMI, the 3% increase in odds (OR, 1.03; 95% CI, 0.99–1.06) was not significant.
Significant associations for AF and IS remained consistent across all adjusted models with confounding variables. In model 9, which included GDP, meteorological conditions, and concentrations of CO, NO2, and PM2.5 as confounding variables, and in model 10, which differed by including O3 concentrations instead of CO, the ORs for AF were 1.16 (95% CI, 1.14–1.18; P <0.001) and 1.15 (95% CI, 1.13–1.17; P <0.001), respectively. For IS, the increase was 6% (OR, 1.06; 95% CI, 1.04–1.09; P <0.001) and 7% (OR, 1.07; 95% CI, 1.05–1.1; P <0.001), respectively.
For STEMI and NSTEMI, the adjusted models indicated higher but insignificant odds of hospitalization. Detailed results for each model are presented in Figure 2 and Supplementary material, Table S1.
Abbreviations: OR, odds ratio; others, see Figure 1
Discussion
The principal finding of this study is that prolonged exposure to LP may be associated with higher odds of hospitalization associated with CVDs, especially IS and AF.
To our knowledge, it is the first research of this kind in Poland, and the first in the world to assess the relationship between this environmental risk factor and AF, the most common arrhythmia27 in the general population and a significant public health issue, strongly connected with exposome, especially with AP.28 The impact of LP on human health has been a subject of interest for several decades,29 but its effects on the cardiovascular system have only recently gained significant attention. This study contributes to filling the gap in current evidence emphasizing the need for precise regulatory standards and targeted strategies to mitigate exposure to environmental risk factors such as LP. Moreover, they highlight the importance of developing more advanced and accurate methodologies to assess CVD risk within the entire exposome, ultimately enhancing preventive strategies for cardiovascular health.
The occurrence of AF may be linked to the dysregulation of clock‑controlled genes,30 whose function is disrupted by LP, leading to circadian rhythm disturbances. In the case of IS, a CVD with the second highest death toll1 and projected increasing incidence in the coming years,31 our findings align with those published by Yonghao et al31 showing that a 1‑IQR increase in LP intensity was associated with a 14% higher risk of IS (hazards ratio [HR], 1.14; 95% CI, 1–1.3). The rising prevalence of IS may be partly explained by the increased risk of AF among individuals exposed to LP, as AF accounts for approximately 25% of IS cases.32
Another potential pathophysiological mechanism linking LP exposure to a higher IS risk is its association with carotid atherosclerosis. For example, Obayashi et al33 demonstrated that greater LP exposure correlated with increased intima‑media thickness, further supporting the role of this nonclassical risk factor in IS development. The findings of this study align with the holistic or integrated care management of AF recommended in global guidelines that emphasize going beyond anticoagulation alone.34-36 Similar integrated care approach has been proposed for stroke management.37,38
Managing exposure to LP is an integral part of risk factor and comorbidity management (as well as lifestyle factors), and may contribute to a reduction in stroke incidence among AF patients. Additionally, by lowering the number of acute AF episodes, it plays a role in symptom management. Routine assessment of LP exposure is also a key component of regular review and evaluation, reinforcing its relevance within the comprehensive integrated care framework for AF management.39
Regarding CAD risks, Sun et al10 demonstrated in 2021 that in an elderly population in Hong Kong, a 1‑IQR increase in the exposure to LP was associated with a HR increase for CAD‑related hospitalizations and deaths (HR, 1.11; 95% CI, 1.03–1.18 and HR, 1.1; 95% CI, 1–1.22, respectively) in fully adjusted models accounting for other exposome components, such as PM2.5 concentrations and noise intensity. Difference in the results of this research regarding STEMI and NSTEMI could be attributed to considerable harmful effects of specific APs included in these models. This observation aligns with the unique characteristics of AP in the analyzed regions. Unlike classical smog types, such as the London smog, prevalent in highly‑urbanized areas and marked by high concentrations of SO2, PM2.5, and CO, or photochemical smog, also known as Los Angeles type smog,40,41 the so‑called Polish smog, occurring in less‑urbanized areas of eastern Poland forms under specific atmospheric conditions, features relatively low concentrations of SO2 and CO but elevated levels of PM2.5. As demonstrated in our previous research, this distinct composition of APs is particularly detrimental in the context of acute coronary syndrome risk.4 These findings underline the necessity of considering regional pollution patterns and their interaction with LP in studies addressing cardiovascular risks.
An important issue in public health is the need to implement methods that enable a more individualized approach to CVD prevention. Currently, widely used tools for assessing the cardiovascular risk, such as the Systemic Coronary Risk Estimation 2 (SCORE2) and SCORE2‑Older Persons42 scales, do not account for nonclassical risk factors for CVD development. Incorporating exposure to AP into risk assessment models demonstrates strong predictive value for major cardiovascular events.43 Therefore, it is essential to expand the existing risk stratification models by integrating the entire exposome, including exposure to LP, to facilitate a more holistic approach. Although there are currently no widely available methods that allow clinicians to assess the impact of LP on human health, we consider that informing patients may contribute to raising public awareness on this important issue.
One of the more significant challenges ahead is the need to establish thresholds for harmful LP levels and revise urban development policies in areas where the issue is most pronounced. Some countries, such as the Czech Republic, France, and Germany, have implemented policies aimed at reducing LP.28,44 However, we believe it is essential to adopt universally accepted standards at a global level and initiate comprehensive efforts to achieve these goals. Such measures would improve health and well‑being of residents and ecosystems, as LP also negatively impacts numerous animal species.45
Limitations
As the first study of its kind, this research on LP and CVD risks has some limitations. One of them is a lack of comprehensive data on LP, along with potential population migration. However, as the data show, local migration in Poland does not exceed 5% annually.46 Second, the Suomi NPP satellite measures light intensity in the spectral range of 500–900 nm, whereas human vision is sensitive to wavelengths between 400 and 700 nm. Third, the study did not assess individualized exposure to LP, which can vary significantly depending on lifestyle and evening activities. Nevertheless, the extensive observation period and the large population residing in the study area help mitigate this bias. Lack of data on noise pollution constitutes another limitation of this study, as it represents a nonclassical CVD risk factor that contributes to disease development through a pathophysiological mechanism similar to that associated with LP.47 Finally, these data pertain to an essentially white European population from Poland, and further studies in different ethnic and geographic groups are needed, given the reported differences in AF‑related complications, such as IS and bleeding, between white Europeans and Asians.48,49
Conclusions
Prolonged LP exposure may increase the odds of cardiovascular hospitalizations, especially for IS or AF.
- Vaduganathan M, Mensah GA, Turco JV, et al. The global burden of cardiovascular diseases and risk. J Am Coll Cardiol. 2022; 80: 2361‑2371. | Crossref
- Luengo‑Fernandez R, Walli‑Attaei M, Gray A, et al. Economic burden of cardiovascular diseases in the European Union: a population‑based cost study. Eur Heart J. 2023; 44: 4752‑4767. | Crossref
- Münzel T, Sørensen M, Hahad O, et al. The contribution of the exposome to the burden of cardiovascular disease. Nat Rev Cardiol. 2023; 20: 651‑669. | Crossref
- Kuźma Ł, Dąbrowski EJ, Kurasz A, et al. Effect of air pollution exposure on risk of acute coronary syndromes in Poland: a nationwide population‑based study (EP‑PARTICLES study). Lancet Reg Health Eur. 2024; 41: 100910. | Crossref
- de Bont J, Jaganathan S, Dahlquist M, et al. Ambient air pollution and cardiovascular diseases: an umbrella review of systematic reviews and meta‐analyses. J Intern Med. 2022; 291: 779‑800. | Crossref
SUPPLEMENTARY MATERIAL
ARTICLE INFORMATION