Citrullinated histone H3 in multiple myeloma patients: associations with prothrombotic fibrin clot properties

 CC BY 4.0
Citrullinated histone H3 in multiple myeloma patients: associations with prothrombotic fibrin clot properties
Introduction
Multiple myeloma (MM) is the second most common hematologic malignancy, and the median survival time of MM patients has doubled from 3–4 years to 8–10 years in the era of novel therapeutics, including proteasome inhibitors, immunomodulatory drugs, and monoclonal antibodies.1 These advances have also altered the frequency and epidemiology of thrombotic events.2 Venous thromboembolism (VTE), occurring in up to 10% of MM patients, leads to lowered quality of life, treatment delay or discontinuation, and is associated with additional morbidity, increased costs, and potentially reduced overall survival.3 The risk of arterial thrombosis is also elevated in MM, and is linked to increased overall mortality.4 Risk factors for thrombosis in MM can be categorized as host‑related (eg, advanced age, prior history of VTE, obesity), disease‑related (eg, hyperfibrinogenemia, decreased activity of protein C and protein S, impaired fibrinolysis), and treatment‑related (eg, the use of immunomodulatory drugs or glucocorticoids).1 MM patients have been characterized by the so‑called prothrombotic fibrin clot phenotype, involving formation of denser fibrin fiber networks less susceptible to fibrinolysis than in controls.5,6
Neutrophil extracellular trap (NET)-related proteins are released by neutrophils and other granulocytes mostly in response to infections or inflammation.7 Excessive NET formation can contribute to blood clot development and thrombosis.8 Murine and human MM cells have been shown to stimulate citrullination of histone H3 and NET formation.9 Moreover, McNee et al10 reported enhanced citrullination of histone H3R26 in bone marrow mesenchymal stem cells associated with increased production of interleukin‑6, a critical cytokine in the MM pathophysiology, which suggests a multifaceted role of histone citrullination and NETs in MM, not only as markers of immune dysregulation but also as active participants in the disease progression and thrombogenesis. NET‑related proteins, including higher levels of circulating citrullinated histone H3 (H3cit), have also been linked with prothrombotic fibrin clot features in patients with type 2 diabetes, atherosclerotic vascular disease, acute pulmonary embolism, and atrial fibrillation.7,11-13 However, to our knowledge, there have been no reports on circulating H3cit in patients with MM.
In this secondary study, expanding the findings published in 2014,5 we evaluated which factors affect H3cit concentration in patients with MM, and whether this marker is associated with prothrombotic state markers in this disease.
Patients and methods
We studied 71 consecutive adult patients with newly‑diagnosed MM, who were recruited in 4 Polish hematology centers. The study group represented a subset of the population presented in detail previously.5 The International Staging System (ISS) for MM based on serum albumin and β2‑microglobulin levels was used to stratify the patients into 3 stages.14 The diagnosis of MM was established based on either bone marrow clonal plasma cell infiltration exceeding 10%, or histopathological evidence of bone or extramedullary plasmacytoma.14 The subtype of MM was determined through serum and urine immunofixation. Hemoglobin, creatinine, total calcium, and monoclonal protein levels were also measured to assess the disease severity. A thrombotic event within the last 6 months, liver cirrhosis, end‑stage kidney disease, current oral anticoagulant therapy, severe thrombocytopenia, and hypofibrinogenemia (<1 g/l) were the exclusion criteria. Patients on aspirin were eligible but those with monoclonal gammopathy of uncertain significance were excluded. The Jagiellonian University Ethical Committee approved the study (KBET/20/B/2012), and all patients provided their written informed consent to participate.
Laboratory investigations
Blood was drawn between 8 AM and 10 AM from the antecubital vein with minimal stasis after overnight fasting. Patients undergoing thromboprophylaxis with low‑molecular‑weight heparin had blood samples taken at least 12 hours after their last injection. Routine laboratory techniques were used to assess blood cell count, glucose, total cholesterol, triglycerides, activated partial thromboplastin time, prothrombin activity (%), and D‑dimer levels. Fibrinogen was determined using the Clauss assay.
An immunoenzymatic assay was used to determine serum H3cit level according to the manufacturer’s protocol (Cayman Chemical, Ann Arbor, Michigan, Illinois, United States). The reference range for H3cit in healthy controls established in our laboratory was 0.5–1.7 ng/ml.11
The plasma fibrin clot variables were determined in duplicate by technicians blinded to the origin of the samples (intra- and interassay coefficients of variation, 5%–8%, for all variables), as described previously.5 Briefly, plasma fibrin clot permeability (Ks) was assessed using a pressure‑driven system. Citrated plasma (60 μl) was mixed with an equal volume of activation mixture containing 1 U/ml of human thrombin (Calbiochem, San Diego, California, United States) and 20 mM CaCl2. Ks was calculated as follows: Ks = Q × L × η/t × A × ∆p, where Q is the flow rate in time (t; in seconds), L is the length of a fibrin gel, η is the liquid viscosity (in poise), A is the cross‑sectional area (in cm2) and ∆p is differential pressure (in dyne/cm2). Lower Ks values indicate reduced clot permeability and smaller pore size in the fibrin network. The reference value established in our laboratory for Ks in healthy individuals of a similar age was 7.78 (interquartile range [IQR], 6.99–8.11) × 10-9 cm2.12
Compaction of a plasma fibrin clot was performed using 0.7 IU/ml thrombin and 20 mM CaCl2 in tubes prepared as in the permeation experiments (see above), followed by centrifugation at 6000 g for 60 seconds.5 The compaction was expressed as the volume of the supernatant evacuated from the tubes divided by the initial plasma volume used to form the clot.5 Lower compaction expressed as a percentage indicated more compact and denser fibrin networks.
The efficiency of fibrinolysis was assessed with 2 different approaches.5 In the first assay, 100 μl of citrated plasma were mixed with 0.6 U/ml human thrombin (Sigma Aldrich, Marburg, Germany), 15 mM calcium chloride, and 1 μg/ml recombinant tissue‑type plasminogen activator (rtPA; Boehringer Ingelheim, Ingelheim, Germany). Clot turbidity was monitored at 405 nm for 30 minutes in duplicates. Clot lysis time was defined as the time in which absorbance decreased by 50% of the peak value (t1/2). The reference value established in our laboratory for healthy controls was 6.47 (IQR, 5.78–8.03) minutes.
In the second assay, plasma fibrin clots prepared as described for the permeation measurements were perfused with Tris buffer containing 0.2 μM rtPA (Boehringer Ingelheim). D‑dimer levels were measured in the effluent every 30 minutes. The experiment was stopped after 90–120 minutes, when the fibrin gel collapsed under the pressure. Maximum rate of increase in D‑dimer (D‑Drate), as a marker of efficiency of fibrin clot degradation, and maximum D‑dimer concentrations (D‑Dmax), as a marker of fibrin content in a clot, were assessed.
Statistical analysis
Categorical variables were presented as counts and percentages, while continuous variables were expressed as mean (SD) or median (IQR). The categorical variables were compared using the χ2 test or the Fisher exact test, as appropriate. Normality was checked using the Shapiro–Wilk test. Differences between the subgroups were analyzed using the t test or the Mann–Whitney test, as appropriate. Associations between the variables were calculated using the Pearson or Spearman correlation coefficients, as appropriate. Linear regression was used to identify predictors of elevated H3cit levels. A P value below 0.05 was considered significant. All statistical analyses were performed with Statistica software (version 13.3, Tibco Software, Palo Alto, California, United States).
Results
We studied 41 men and 30 women with MM at a median (IQR) age of 67 (58–72) years. The dominant subtype of MM was that of immunoglobulin (Ig) G (Supplementary material, Table S1). The prevalence of the ISS stages was as follows: stage III, 59.2% (n = 42); stage II, 21.1% (n = 15); and stage I, 19.7% (n = 14).
The median (IQR) H3cit level was 3.04 (2.42–4.14) ng/ml. In all MM patients, H3cit levels exceeded the upper limit of our reference range by on average 192% (SD, 58%; P <0.001). When the patients were stratified based on the median of H3cit concentration (3.04 ng/ml), no differences were observed in age, sex, comorbidities, or routine laboratory parameters between the groups (Supplementary material, Table S1). Although the subtype of MM did not significantly influence H3cit levels, the patients with H3cit concentration above the median had 6.5‑fold higher IgA level than the others, while IgG levels and plasma cell percentages were similar (Supplementary material, Table S1). Moreover, the patients with H3cit levels above the median were more commonly classified as stage III disease (Supplementary material, Table S1).
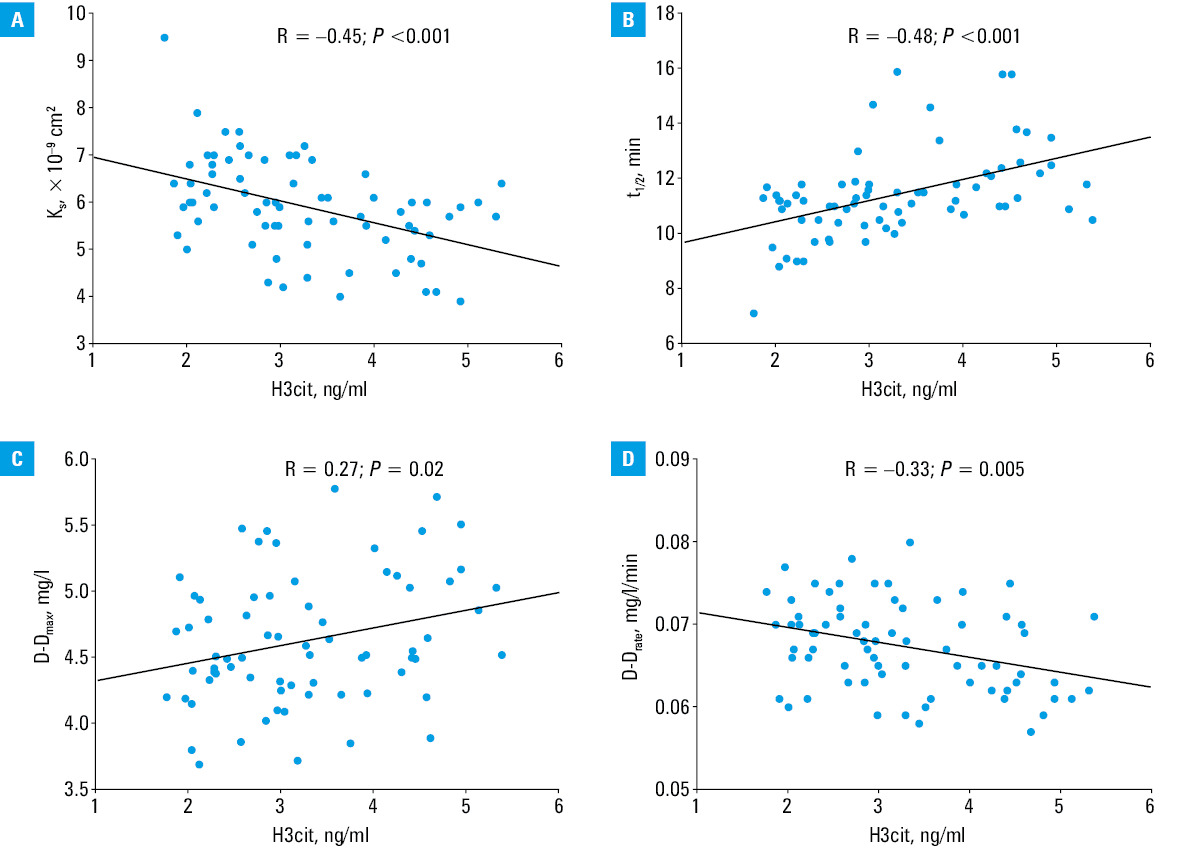
In the patients with elevated H3cit concentration (>3.04 ng/ml), we observed reduced clot porosity reflected by 12.7% lower Ks and impaired clot susceptibility to lysis expressed by 13% longer t1/2 and 4.3% lower D‑Drate, without significant differences in D‑Dmax and clot compaction (Supplementary material, Table S1). Serum H3cit level was inversely associated with Ks and D‑Drate, and positively with t1/2 and D‑Dmax, indicating associations between higher H3cit level and more prothrombotic clot structure and impaired lysis efficiency (Figure 1A–1D).
In the linear regression analysis adjusted for age, a 1‑minute prolongation in t1/2 was associated with an increase in H3cit level by 0.48 ng/ml (R2 = 0.48; β = 0.48; SE, 0.067; P <0.001). No such associations were noted for other fibrin clot variables tested.
Discussion
To our knowledge, this study is the first to demonstrate that elevated H3cit level is associated with the formation of denser plasma fibrin clots with reduced clot lysability in patients with MM. While the disease subtype was not significantly associated with H3cit concentration, its elevated levels were more common in the patients with advanced ISS stage III disease. Based on the distribution of H3cit concentrations, nearly 78% of the patients with H3cit level exceeding 3.04 ng/ml were classified as ISS stage III, and only 6% as ISS stage I, suggesting a potential link between NET activation and higher disease burden. Moreover, our findings suggest that excessive NET formation occurs in MM, which indicates that also in this malignant disease NETosis might contribute to an increased thrombotic risk and possibly the disease progression or a more aggressive disease phenotype and tumor microenvironment, which deserve further research.
Our report extends prior mechanistic studies regarding MM conducted in animal models and in vitro systems. Li et al15 demonstrated that NET formation is markedly increased in neutrophils isolated from myeloma‑bearing mice with a concomitant rise in histone H3 citrullination. This link was further corroborated by their follow‑up study showing that both murine and human myeloma cells directly stimulate histone H3 citrullination and NET formation, and that these processes can be effectively suppressed by targeting protein‑arginine deiminase type‑4 (PAD4).9 Pharmacological inhibition of PAD4 blocked NET formation and delayed the disease progression in mice, suggesting that NETs contribute not only to thromboinflammatory complications but potentially to disease pathogenesis itself,9,15 which is supported by the present observations. Advanced stages of MM are often characterized by enhanced systemic inflammation and immune dysregulation. Our study suggests that higher H3cit level could reflect a more aggressive tumor microenvironment associated with higher disease burden. On the other hand, our preliminary report suggests that higher levels of IgA in MM patients may be involved in enhanced NETosis, which is in line with experimental data showing that IgA binds to the IgA receptor (CD89) on the neutrophils and triggers NETosis.16
It is well evidenced that MM increases the risk of thromboembolic events,17 but the underlying mechanisms remain incompletely understood. Since NETs are known to incorporate DNA, histones, and neutrophil enzymes into the fibrin network, making the clots denser and more resistant to lysis,8,18 the observed relationship between H3cit and impaired fibrin clot degradation suggests that NET components, particularly citrullinated histones, could at least in part alter the clot architecture and stability in MM patients. One might suspect that therapeutic strategies aimed at reducing NET formation, such as PAD4 inhibition, may hold dual potential for mitigating both MM progression and the thrombotic risk.
Several limitations of our study should be acknowledged. One of the most important is a lack of an age- and sex‑matched healthy control group, which reduces the ability to attribute the observed abnormalities in H3cit levels and fibrin clot features specifically to MM. However, we have provided reference ranges for the key parameters to compare the present data with values for healthy controls. Second, the number of the study participants was relatively low given diverse types of MM. However, we enrolled representative MM patients typically encountered in clinical practice. Moreover, information on body mass index and smoking status was not collected for all patients; however, in our opinion, these data are unlikely to impact the study results. Third, since the data analyzed in this study were obtained from samples collected more than 10 years ago—prior to the widespread adoption of the revised staging system19—we used the ISS for the disease stage assessment.14 The ISS, based on serum β2-microglobulin and albumin levels, was the standard prognostic tool at that time. Consequently, we did not incorporate more recent prognostic markers, such as high‑risk cytogenetic abnormalities, serum lactate dehydrogenase levels, or the presence of gain / amplification of chromosome arm 1q, which are now considered in updated classifications.19 Moreover, we did not measure other specific NET markers, such as myeloperoxidase‑DNA complexes; however, the assay is not commercially available, not validated, or standardized for routine clinical measurement. The associations reported here do not necessarily suggest the cause‑effect relationship, and basic research is needed to get mechanistic insights into the role of H3cit in modulating the prothrombotic fibrin clot phenotype. Clinical follow‑up was beyond the scope of our study, therefore no data on future VTE or the impact of current therapies20 on H3cit level or the fibrin clot properties were available. These areas also deserve further investigation.
In conclusion, elevated H3cit levels were observed in the patients with advanced MM stages in association with unfavorably altered fibrin clot properties including impaired clot susceptibility to lysis, which expands our knowledge on the complex prothrombotic mechanisms in this disease. It might be speculated that elevated H3cit level may serve as a biomarker for thromboembolic risk in MM patients if long‑term large studies confirm its practical relevance, and the assay to determine H3cit level is standardized and validated for clinical use. Further studies are warranted to explore the therapeutic potential of targeting NETs in the clinical management of MM.
- Jarchowsky O, Avnery O, Ellis MH. Thrombosis in multiple myeloma: mechanisms, risk assessment and management. Leuk Lymphoma. 2023; 64: 1905‑1913. | Crossref
- De Stefano V, Larocca A, Carpenedo M, et al. Thrombosis in multiple myeloma: risk stratification, antithrombotic prophylaxis, and management of acute events. A consensus‑based position paper from an ad hoc expert panel. Haematologica. 2022; 107: 2536‑2547. | Crossref
- Fotiou D, Gavriatopoulou M, Terpos E. Multiple myeloma and thrombosis: prophylaxis and risk prediction tools. Cancers. 2020; 12: 191. | Crossref
- Schoen MW, Carson KR, Luo S, et al. Venous thromboembolism in multiple myeloma is associated with increased mortality. Res Pract Thromb Haemost. 2020; 4: 1203‑1210. | Crossref
- Undas A, Zubkiewicz‑Usnarska L, Helbig G, et al. Altered plasma fibrin clot properties and fibrinolysis in patients with multiple myeloma. Eur J Clin Invest. 2014; 44: 557‑566. | Crossref
SUPPLEMENTARY MATERIAL
ARTICLE INFORMATION