Clinically relevant pituitary adenomas: a single-center epidemiological study
Key words: epidemiology, incidence, macroadenoma, pituitary adenoma, pituitary tumor


 CC BY-NC-SA 4.0
Clinically relevant pituitary adenomas: a single-center epidemiological study
Introduction: Pituitary adenomas (PAs) are a heterogeneous group of central nervous system lesions that are mostly benign. They account for 13.5%–20% of all primary brain tumors, and their incidence is rising.
Objectives: We retrospectively analyzed patients with PA to determine their specific epidemiological characteristics, focusing specifically on a series of surgically resected PAs.
Patients and methods: We analyzed all patients diagnosed with PA (n = 1111) and hospitalized in the Department of Endocrinology, Poznań, Poland, between 2018 and 2023, with a special focus on clinically relevant PAs qualified for transsphenoidal surgery (n = 194). Medical history, demographic characteristics, tumor features, and diagnostic results were reviewed. The incidence of PAs was defined as a new diagnosis of PA.
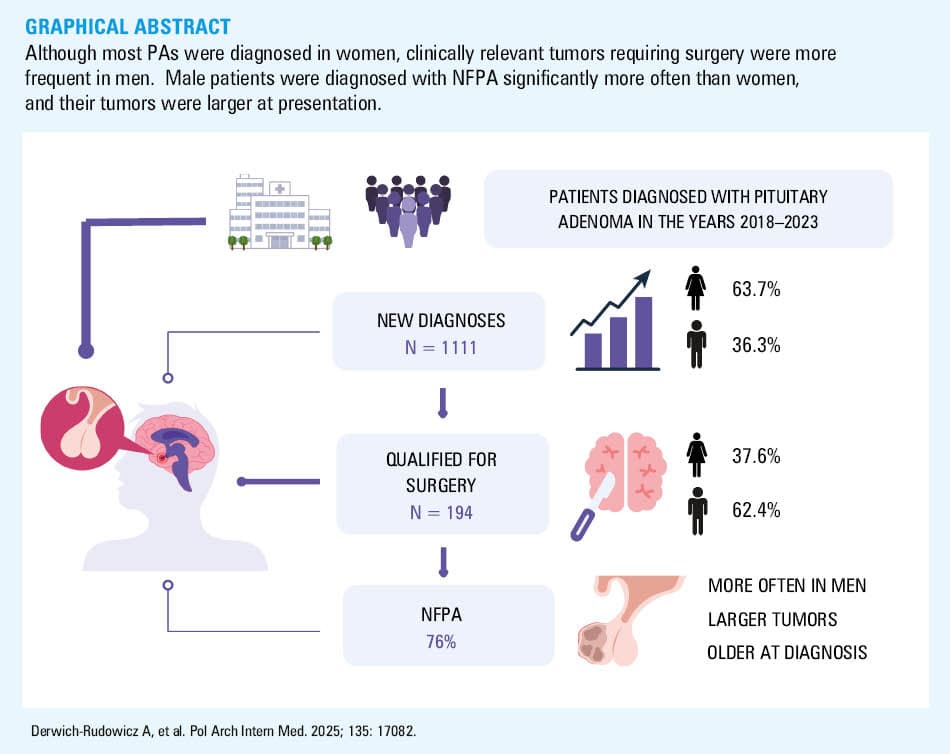
Results: We identified 1111 patients with newly diagnosed PA, including 403 men (36.3%), with an annual incidence rate of 4.11/100 000 population. Women were diagnosed at a younger age than men (P <0.001). In the group qualified for surgery (n = 194), the most common diagnosis was nonfunctioning PA (NFPA; 76%). Men were diagnosed with NFPA more often (P = 0.02) and presented with larger tumors (P = 0.005). The patients with NFPA were older at diagnosis (P <0.001). Larger tumors were associated with an increased risk of complications, such as visual field defects, headaches, and hypopituitarism. Although 90% of the patients were diagnosed with multimorbidity and over half with polypharmacy, we did not find any association between comorbidities and the tumor type.
Conclusions: Although most PAs were diagnosed in women, clinically relevant tumors were more frequent in men. Male patients were diagnosed with NFPA significantly more often than women, and their tumors were larger at presentation.
What's new?
This study provides updated, single‑center data on the epidemiology of pituitary adenomas (PAs) in a Polish population. Based on a 5‑year retrospective analysis, we report an annual incidence rate of 4.11 cases per 100 000 population; higher in women (5.07 per 100 000 population) than men (3.07 per 100 000 population). Although PAs are more often diagnosed in women, we found that clinically significant tumors qualifying for surgery, particularly nonfunctioning adenomas, are more frequent in men. Larger tumors are associated with an increased risk of complications, such as visual field defects, headaches, and hypopituitarism. To our knowledge, this study is the first to analyze the PA epidemiology in Poland. Our findings highlight the importance of early detection, especially in men, who often present with more advanced disease.
Introduction
Pituitary adenomas (PAs) are a heterogeneous group of central nervous system lesions that are mostly benign.1 They account for 13.5%–20% of all primary brain tumors, representing the third largest group after meningiomas and gliomas.2 Their prevalence ranges from 14% to 23% in various autopsy or radiologic studies.1,3,4 Detection of PAs has risen in recent years, primarily due to the increased availability and sensitivity of magnetic resonance imaging (MRI) and computed tomography (CT).5 Their incidence varies according to age and sex but is slightly higher in women between 40 and 60 years old.1 The incidence rate (IR) ranges from 3.9 to 7.4 cases per 100 000 individuals, and the prevalence rate of symptomatic tumors is approximately 1 per 1000 people in the general population.5 Both incidence and prevalence rates show an upward tendency.5
Based on a size criterion, PAs are classified as microadenomas (<10 mm in diameter) or macroadenomas (≥10 mm in diameter). Giant pituitary tumors are defined by a main diameter exceeding 40 mm.6 They comprise 6%–10% of all pituitary tumors.7 The lesions can be classified as hormone‑secreting (functioning) and nonfunctioning. The most common pituitary tumors are prolactinomas (PRLs; 40%–66%), followed by clinically nonfunctioning PAs (NFPAs; 15%–43%), somatotropinomas (causing acromegaly or gigantism; 8%–16%), corticotropinomas (causing Cushing disease; 2%–6%), and, rarely, thyrotropinomas or gonadotropinomas (<1% for both).8 Functioning pituitary tumors are usually diagnosed earlier than nonfunctioning ones.9
A vast majority of PAs occur sporadically; only 5% of cases are associated with familial pituitary tumor syndromes, the most frequent of which is multiple endocrine neoplasia type 1 syndrome, while others include familial acromegaly, McCune–Albright syndrome, or Carney complex.1,10
Surgical resection of the tumor mass is the first‑line treatment for all clinically relevant PAs except PRLs.11 However, the patients with PRL who do not respond to medical treatment should also undergo surgical resection. Almost 90% of PAs can be safely removed with transsphenoidal surgery. Radiotherapy is usually used for residues or recurrences in inoperable sites.12,13
Although the number of reports investigating PAs is increasing, there are few population‑based studies that characterize the disease incidence, prevalence, and other key epidemiological features. Our study aimed to retrospectively analyze patients with PAs, focusing specifically on a series of surgically resected PAs collected at a single center to determine their specific epidemiological characteristics.
Patients and methods
Patients
This was a retrospective study. Initially, we analyzed all patients diagnosed with PA in the Department of Endocrinology, Metabolism, and Internal Medicine of the Poznan University of Medical Sciences in Poland between January 2018 and December 2023. A total of 1111 patients were hospitalized in our department and registered in the hospital database with an International Classification of Diseases, Tenth Revision code D35.2 during this period. Subsequently, 194 patients with clinically relevant PA who underwent transsphenoidal surgical resection in the Department of Neurosurgery of the Poznan University of Medical Sciences in Poland were included in a detailed analysis.
Clinical history, demographic characteristics (age, sex), presented features (symptoms, lesion size, hormonal status), laboratory test results, imaging data, and body mass index (BMI) values were reviewed. The hormone‑secreting tumors were diagnosed and treated according to the current guidelines.14-16 Hypopituitarism was defined as an anterior pituitary hormonal deficit. Multihormonal pituitary insufficiency indicated a deficit in 2 or more axes. Multimorbidity was defined as a coexistence of 2 or more chronic diseases. Polypharmacy referred to regular use of 5 or more medications at the same time. BMI was classified according to the World Health Organization (WHO) criteria into normal weight (18.5–24.9 kg/m2), overweight (25–29.9 kg/m2), and obesity (≥30 kg/m2).
Ethics
The study was approved by the Bioethical Committee of the Poznan University of Medical Sciences, with informed consent waived due to its retrospective nature (633/22).17 All methods adhered to relevant guidelines and regulations.18
Hormone level assessment
Laboratory parameters included complete blood count, glucose, lipid profile, vitamin D, adrenocorticotropic hormone (ACTH), growth hormone (GH), insulin‑like growth factor 1 (IGF‑1), luteinizing hormone (LH), follicle‑stimulating hormone (FSH), thyroid‑stimulating hormone (TSH), free triiodothyronine (fT3), free thyroxine (fT4), cortisol, testosterone, estradiol, prolactin, and sex hormone–binding globulin (SHBG) levels. Blood samples were collected after an overnight fast to measure all parameters.
The assays were performed according to the manufacturers’ recommendations. The levels of ACTH, LH, FSH, SHBG, TSH, fT3, fT4, prolactin, and cortisol were measured with electrochemiluminescence (ECLIA) using the Cobas e801 analyzer (Roche Diagnostics, Indianapolis, Indiana, United States). GH levels were determined using ECLIA on the Cobas e402 analyzer (Roche Diagnostics). IGF‑1 levels were measured with the chemiluminescence (CMIA) method using a LIAISON analyzer (DiaSorin Ltd., Saluggia, Italy). Vitamin D levels were measured using the CMIA method on an Alinity I analyzer (Abbot, Chicago, Illinois, United States).
Magnetic resonance imaging
All patients underwent pituitary gland MRI scans to assess tumor characteristics, including size, intratumor hemorrhage, and invasion type. MRI was performed using a 3.0 Tesla Siemens Magnetom Skyra scanner (Siemens Healthineers, Erlangen, Germany). The imaging protocol included T2‑weighted sequences, with slice thickness of 2 mm, and a 0.2‑mm interslice gap. Tumor size was determined by measuring the greatest diameter, with microadenoma defined as a tumor with a diameter of less than 10 mm, macroadenoma, with a diameter of greater than or equal to 10 mm, and giant adenoma, with a diameter of 40 mm or greater. The invasion type was determined based on the invasion site of the tumor and recorded as cavernous sinus invasion. The diagnosis was confirmed by postoperative pathology, and immunohistochemical examination was used to determine the endocrine type based on the WHO classification of endocrine system tumors.
Statistical analysis
Continuous variables with non‑normal distribution are expressed as median and interquartile range (IQR), and normally distributed data, as mean and SD. Categorical data are presented as numbers and percentages. The normality of quantitative variable distribution was assessed using the Lilliefors test for normality. To compare the normally distributed variables, the t test was used; otherwise, the Mann–Whitney test was employed. The χ2 test was used to analyze contingency Tables of categorical variables. The Fisher exact test was used if sample sizes were small (ie, the Cochran condition was not fulfilled). The χ2 test for trend was additionally performed for ordinal variables (tumor size in particular). Multiple comparisons were performed using the Bonferroni correction. The Kruskall–Wallis test with the Conover–Iman correction for multiple comparisons was used to analyze the number of axes of hypopituitarism and the number of operations vs tumor size. Additionally, the Jonckheere–Terpstra test for trend was performed. A comparison of results between the groups was performed with the Kruskall–Wallis test. Post hoc analysis was performed using the Conover test. Thyreotropinoma was excluded from the comparative analysis due to an insufficient sample size (n = 1). A significance level of 0.05 was assumed.
The incidence of PA was defined as a new diagnosis of PA. The annual incidence was calculated by dividing the total incidence by the total population for Greater Poland and Lubusz voivodeships in July of the corresponding year. Average incidences were calculated by dividing the total number of cases by the overall population in the sex‑specific group and averaging the data from 2018 to 2023 (data based on the Statistical Yearbook of the Regions by the Central Statistical Office). IRs are presented as cases per 100 000 population per year, along with corresponding 95% CIs.
Analyses were performed using PQStat software v.1.8.6 (PQStat, Poznań, Poland) and MedCalc statistical software, version 19.1.5 (MedCalc Software bv, Ostend, Belgium).
Results
Incidence rate of pituitary adenomas
The number of patients diagnosed with PA (by tumor size and type) between 2018 and 2023 in our center is shown in Figure 1. During this period, we identified 1111 patients with such a diagnosis, 403 men (36.3%) and 708 women (63.7%), yielding an annual IR of 4.11 cases per 100 000 population. The mean annual IR was higher among women (5.07 per 100 000 population) than men (3.07 per 100 000 population). Detailed data are shown in Table 1.
Abbreviations: see Table 2
Parameter | 2018 | 2019 | 2020 | 2021 | 2022 | 2023 | |
Abbreviations: IR, incidence rate | |||||||
Patients, n (%) | Overall | 161 (100) | 179 (100) | 172 (100) | 187 (100) | 219 (100) | 193 (100) |
Men | 57 (35) | 61 (34) | 65 (38) | 69 (37) | 74 (34) | 77 (40) | |
Women | 104 (65) | 118 (66) | 107 (62) | 118 (63) | 145 (66) | 116 (60) | |
IR per 100 000/y (95% CI) | Overall | 3.59 (3.56–3.61) | 3.96 (3.94–3.99) | 3.81 (3.77–3.86) | 4.14 (4.12–4.17) | 4.87 (4.84–4.89) | 4.29 (4.27–4.32) |
Men | 2.6 (2.57–2.64) | 2.79 (2.75–2.82) | 2.97 (2.94–3.01) | 3.16 (3.12–3.19) | 3.39 (3.35–3.42) | 3.53 (3.5–3.56) | |
Women | 4.48 (4.44–4.53) | 5.08 (5.04–5.13) | 4.61 (4.56–4.66) | 5.08 (5.04–5.13) | 6.25 (6.2–6.29) | 5 (4.95–5.04) | |
Mean age at diagnosis, y (95% CI) | Overall | 47 (46.7–47.3) | 47 (46.5–47.5) | 49 (48.4–49.6) | 49 (48.5–49.5) | 44 (43.7–44.3) | 48 (47.6–48.4) |
Men | 50 (49.5–50.2) | 47 (46.7–47.3) | 47 (46.3–47.1) | 47 (46.9–47.5) | 43 (43.1–43.5) | 47 (46.6–47.4) | |
Women | 46 (45.8–46.2) | 47 (46.7–47.3) | 47 (46.8–47.2) | 47 (46.6–47.4) | 42 (41.6–42.4) | 47 (46.7–47.3) | |
Women were diagnosed at a younger age than men (P <0.001), with mean age at diagnosis of 46 (95% CI, 44.7–47.3) and 50 years (95% CI, 48.1–51.4), respectively. Supplementary material, Figure S1 shows the age- and sex‑specific data on annual diagnosis of PA.
Characteristics of histologically diagnosed pituitary tumors
Further analysis included 194 patients with histopathological diagnosis of PA who underwent transsphenoidal surgical resection (121 men aged 30–82 years; 73 women aged 22–83 years [25 premenopausal, 48 postmenopausal]). The most common diagnosis was NFPA (76%), followed by GH–secreting PA (GH‑PA; 14%), PRL (7%), and corticotroph pituitary adenoma (ACTH‑PA; 2.5%). A single patient was diagnosed with thyrotropinoma (0.5%). Overall, 90% of the patients presented with macroadenoma, and 8% were diagnosed with a giant tumor (>4 cm). Invasion of the cavernous sinus was present in 74% of the cases, with optic chiasm compression present in 69%. Symptoms of tumor mass effect were found in over 95% of the patients, with visual field defect (66%) and headaches (55%) being the most common. Hypopituitarism was diagnosed in almost half of the patients, and multihormonal pituitary insufficiency, defined as a deficit in 2 or more axes, was present in one‑third of the cohort. Detailed clinical characteristics are shown in Table 2.
Characteristics | Total (n = 194) | Men (n = 121) | Women (n = 73) | |
Data are presented as median (interquartile range) or number (percentage).
Abbreviations: ACTH‑PA, corticotroph pituitary adenoma; BMI, body mass index; GH‑PA, growth hormone–secreting pituitary adenoma; NFPA, nonfunctioning pituitary adenoma; PRL, prolactinoma; TSH‑PA, thyreotropinoma | ||||
Age, y | 56 (46–68) | 54 (46–65) | 58 (48–69) | |
BMI, kg/m2 | 28.84 (25.89–33.01) | 29.01 (26.22–33.47) | 28.69 (24.76–31.8) | |
Recurrence | 49 (25) | 39 (32) | 10 (14) | |
Radiotherapy | 12 (6) | 9 (7) | 3 (4) | |
Tumor type | ||||
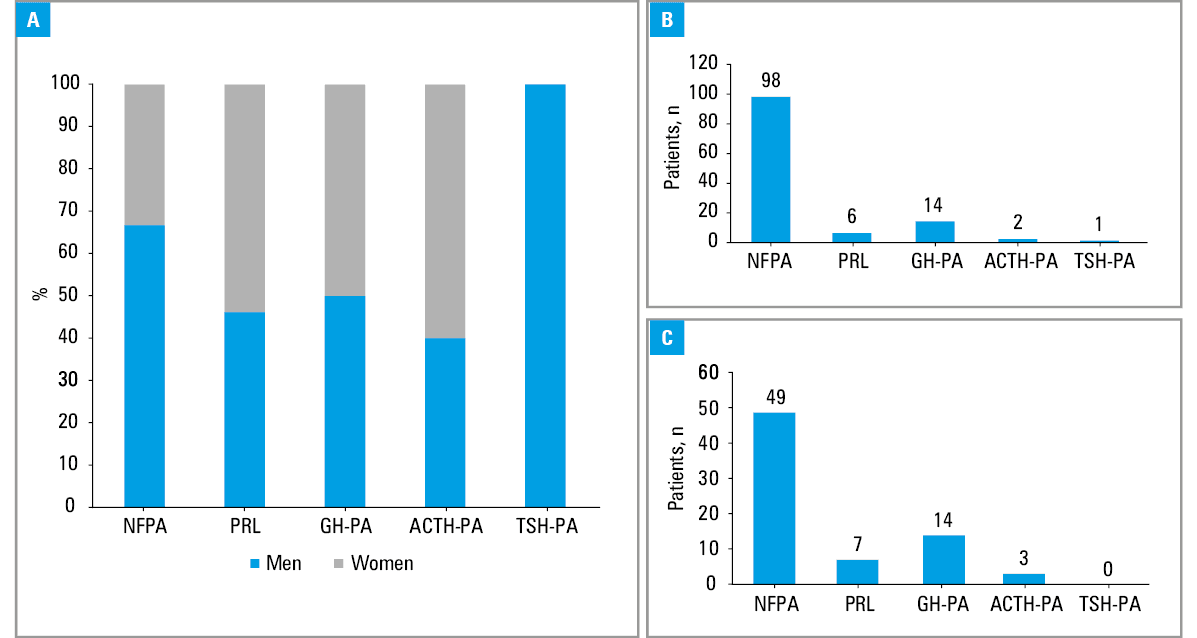
NFPA | 147 (76) | 98 (81) | 49 (67) | |
PRL | 13 (7) | 6 (5) | 7 (10) | |
GH‑PA | 28 (14) | 14 (11.6) | 14 (19) | |
ACTH‑PA | 5 (2.5) | 2 (1.6) | 3 (4) | |
TSH‑PA | 1 (0.5) | 1 (0.8) | 0 | |
Tumor characteristics | ||||
Microadenoma | 4 (2) | 2 (1.6) | 2 (3) | |
Macroadenoma | 174 (90) | 105 (87) | 69 (94) | |
Giant adenoma | 16 (8) | 14 (11.4) | 2 (3) | |
Invasive | 169 (87) | 113 (93) | 56 (77) | |
Cavernous sinus invasion | 143 (74) | 98 (81) | 45 (62) | |
Optic chiasm compression | 134 (69) | 90 (74) | 44 (60) | |
Tumor mass effect | ||||
Headache | 106 (55) | 66 (55) | 40 (55) | |
Visual field defect | 129 (66) | 83 (69) | 46 (63) | |
Hyperprolactinemia | 80 (41) | 42 (35) | 38 (52) | |
Hypopituitarism | 91 (47) | 60 (50) | 31 (42) | |
Multihormonal pituitary insufficiency (≥2 axes) | Overall | 64 (33) | 45 (37) | 19 (26) |
Gonadal axis | 66 (34) | 46 (38) | 20 (27) | |
Corticotropic axis | 59 (30) | 44 (36) | 15 (21) | |
Thyreotropic axis | 61 (31) | 41 (34) | 20 (27) | |
Somatotropic axis | 11 (6) | 7 (6) | 4 (5) | |
Comorbidities | ||||
Arterial hypertension | 107 (55) | 64 (53) | 43 (59) | |
Diabetes melitus | 33 (17) | 16 (33) | 17 (23) | |
Hypercholesterolemia and / or dyslipidemia | 120 (62) | 73 (60) | 47 (64) | |
Cigarette smoking | 24 (12) | 19 (16) | 5 (7) | |
Obesity | 72 (37) | 47 (39) | 25 (34) | |
Overweight | 64 (33) | 43 (36) | 21 (29) | |
Multimorbidity (≥2 comorbidities) | 174 (90) | 109 (90) | 65 (89) | |
Polypharmacy (≥5 drugs) | 105 (54) | 60 (50) | 45 (62) | |
Place of residence | ||||
Urban | 115 (59) | 71 (59) | 44 (60) | |
Rural | 79 (41) | 52 (43) | 27 (37) | |
Endocrine‑metabolic characteristics
We compared laboratory results of patients with different types of tumor. Thyrotropinoma was excluded from the comparative analysis due to an insufficient sample size (n = 1). Most of the patients were diagnosed with hypercholesterolemia and / or dyslipidemia. We observed differences in fT4 levels between the groups; however, all values were within laboratory ranges. We also observed lower gonadotropin levels in the postmenopausal women with NFPA and ACTH‑PA, as compared with those with GH‑PA (P = 0.004 for LH; P = 0.01 for FSH). Hypogonadism was present in 46% of the postmenopausal women with NFPA, and in 50% of those with ACTH‑PA. The differences in pituitary hormone levels were due to the tumor function. Table 3 presents laboratory results of all studied groups.
Parameter | NFPA (N = 147) | PRL (N = 13) | GH‑PA (N = 28) | ACTH‑PA (N = 5) | P value | ||
Data are presented as median (interquartile range). A P value <0.05 was considered significant.
Post‑hoc significance between groups: a significant difference vs GH‑PA; b significant difference vs ACTH‑PA;
c significant difference vs NFPA; d significant difference vs PRL
SI conversion factors: to convert ACTH to pmol/l, multiply by 0.2202; GH to μg/l, by 1; glucose to mmol/l, by 0.0555 to mmol/l; Hb to g/l, by 10; IGF‑1 to nmol/l, by 0.131; TC, LDL‑C, and HDL‑C to mmol/l, by 0.0259; TG to mmol/l, by 0.0113; vitamin D to nmol/l, by 2.496; HCT to l/l, divide by 100
Abbreviations: ACTH, adrenocorticotropic hormone; F, women; Fpre, premenopausal women; Fpost, postmenopausal women; fT4, free thyroxine; FSH, follicle‑stimulating hormone; Hb, hemoglobin; IGF‑1, insulin‑like growth factor 1; LDL‑C, low‑density lipoprotein cholesterol; LH, luteinizing hormone; M, men; N, total number of patients; n, number of patients in the analyzed group; N/A, not applicable; SHBG, sex hormone–binding globulin; TC, total cholesterol; TG, triglycerides; TSH, thyroid‑stimulating hormone | |||||||
TSH, µU/ml | 1.25 (0.7–2.1) | 1.17 (0.5–2.9) | 1.14 (0.7–1.5) | 0.6 (0.2–2.6) | 0.76 | ||
FT4, pmol/l | 12.4a,b (10–15.2) | 11.1a,b (9.3–14.6) | 15.3c,d (13.2–18.2) | 17.1c,d (13.8–18.4) | <0.001 | ||
FSH, mlU/ml | M | 4.8a,d (2.8–6.9) | 1.8b,c (0.7–2.2) | 7.8c,d (4.4–10.4) | 5.1 (4.5–5.7) | <0.001 | |
Fpre | 4.1 (3.5–5.4); n = 14 | 6.2 (5.5–6.6); n = 5 | 4.3 (3.1–6.5); n = 5 | 6.3 (N/A); n = 1 | 0.17 | ||
Fpost | 5.8a (2.7–20.8); n = 35 | 15.4 (6.8–18.1); n = 2 | 44.3b,c (39.2–74.7); n = 9 | 5.5a (1–10); n = 2 | 0.004 | ||
LH, mlU/ml | M | 3.2a,d (2–4.3) | 0.5a,c (0.4–1.1) | 5.4b,c,d (3.1–7.3) | 2.9 (2.4–3.3) | <0.001 | |
Fpre | 0.9 (0.5–4.4); n = 14 | 4.1 (3.2–7.9); n = 5 | 1.5 (0.6–5.9); n = 5 | 6.2 (N/A); n = 1 | 0.1 | ||
Fpost | 2.4a (0.6–7.9); n = 35 | 10.4 (8.2–12.4); n = 2 | 22.1a,c (16.0–28.5); n = 9 | 2.7a (0.3–5); n = 2 | 0.01 | ||
Prolactin, µIU/ml | 348d (220–611) | 1808a,c (780–7916) | 262d (184–629) | 491 (282–1558) | 0.04 | ||
Testosterone, nmol/l | M | 6.6 (2.1–11.6) | 0.1 (0.1–2.1) | 8.7 (5–10.3) | 8.3 (6.1–10.5) | 0.17 | |
F | 0.3 (0.1–0.7) | 1.2 (0.2–1.4) | 0.6 (0.3–1) | 0.7 (0.6–1.5) | 0.12 | ||
SHBG, nmol/l | M | 39.3 (26.1–64.4) | 29.8 (12.8–36.9) | 24.1 (21.4–29.5) | 38.3 (31.8–44.7) | 0.09 | |
F | 49.3 (33.2–65.7) | 83.1 (60.7–119.8) | 38.8 (25.8–69.1) | 23.2 (18.7–35.3) | 0.09 | ||
GH, ng/ml | 0.2a,b,d (0.1–0.4) | 1.3a,c (0.9–1.6) | 5.9b,c,d (2.2–15.5) | 0.7a,c (0.2–4.6) | <0.001 | ||
IGF‑1, ng/ml | M | 108a (73–143) | 125 (103–147) | 943c (315–1094) | 207 (N/A) | <0.001 | |
F | 99a (65–161) | 158a (75–223) | 688b,c,d (296–767) | 104a (66–390) | <0.001 | ||
ACTH, pg/ml | 26.8a,b (15.5–40.7) | 23.4b (6.4–48.8) | 43.7b,c (23.4–87.1) | 97.45a,c,d (88.3–153.3) | <0.001 | ||
Cortisol, nmol/l | 314a,b (153–440) | 386 (168–669) | 425 (259–524) | 663c (524–930) | <0.001 | ||
Hb, g/dl | 13.6 (12.4–14.5) | 13.3 (12.6–14.0) | 13.8 (12.8–14.3) | 13.5 (13–14.4) | 0.92 | ||
HCT, % | 40.3 (36.5–42.6) | 38.3 (37.5–41.4) | 39.8 (38.3–41.3) | 39.7 (37.1–44) | 0.77 | ||
Glucose, mg/dl | 97a (86–113) | 99 (88–133) | 109c (102–126) | 98 (94–104) | 0.02 | ||
TC, mg/dl | 209 (169–249) | 203 (176–256) | 179 (160–203) | 214 (179–228) | 0.56 | ||
LDL‑C, mg/dl | 130 (95–166) | 130 (100–177) | 104 (89–127) | 130 (103–151) | 0.54 | ||
HDL‑C, mg/dl | 50 (41–61) | 47 (36–61) | 57 (45–62) | 56 (45–65) | 0.42 | ||
TG, mg/dl | 135 (99–186) | 168 (134–230) | 130 (98–161) | 133 (112–146) | 0.27 | ||
Vitamin D, ng/ml | 23 (19–30) | 24 (11–29) | 17 (12–27) | 23 (19–30) | 0.91 | ||
Tumor size and compressive symptoms
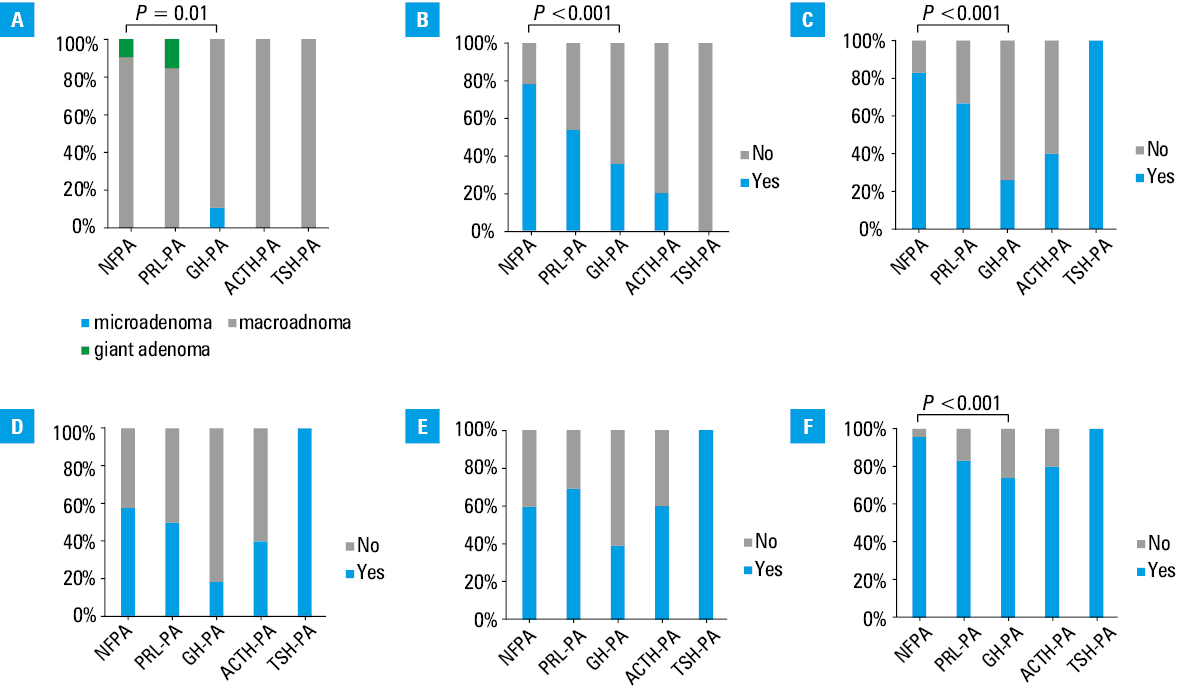
We compared the characteristics of different tumor types. A relationship was observed between tumor size and type—NFPAs were larger at the time of diagnosis than GH‑PAs (P = 0.01). We also found a difference in tumor size between the functioning tumor group and NFPAs (P = 0.01). The larger the tumor was by the time of diagnosis, the more often it was NFPA (P = 0.02). Nonfunctioning tumors were associated with higher rates of invasiveness (P <0.001), optic chiasm compression (P <0.001), and visual field defect (P <0.001). However, we did not observe such an association for headaches (P = 0.29) or concurrent hyperprolactinemia (P = 0.19). A quarter of the patients had recurrent disease, most of whom were men. There was no correlation between tumor type and recurrence (P = 0.13). Detailed data are presented in Figure 1.
Prevalence of comorbidities
Overall, 90% of the patients were diagnosed with multimorbidity, and over half with polypharmacy. The most common comorbidities were hypercholesterolemia and / or dyslipidemia (58%) and arterial hypertension (55%), followed by diabetes mellitus (17%). Over one‑third of the patients were obese, and one‑third were overweight. Active smokers constituted 12% of the group, of whom nearly 80% were men. We did not find any association between comorbidities and tumor type. Data are shown in Table 4.
Parameter | NFPA (n = 147) | PRL (n = 13) | GH‑PA (n = 28) | ACTH‑PA (n = 5) | P value |
Data are presented as number (percentage). A P value <0.05 was considered significant (Fisher exact test).
Abbreviations: see Table 2 | |||||
Arterial hypertension | 87 (59) | 3 (23) | 13 (46) | 4 (80) | 0.15 |
Diabetes mellitus | 22 (15) | 2 (15) | 7 (25) | 2 (40) | 0.44 |
Hypercholesterolemia and / or dyslipidemia | 81 (55) | 7 (54) | 26 (93) | 5 (100) | 0.07 |
Multimorbidity (≥2 comorbidities) | 131 (89) | 11 (85) | 26 (93) | 5 (100) | 0.58 |
Polypharmacy (≥5 drugs) | 75 (51) | 6 (46) | 19 (68) | 4 (80) | 0.34 |
Cigarette smoking | 19 (13) | 1 (8) | 3 (11) | 1 (20) | 0.91 |
Obesity | 53 (36) | 7 (54) | 10 (36) | 2 (40) | 0.82 |
Overweight | 50 (34) | 4 (31) | 8 (29) | 1 (20) | 0.6 |
Hypopituitarism was diagnosed in 47% of the patients, and multihormonal pituitary insufficiency in 33%. Almost one‑third of the patients had hypogonadism, secondary hypothyroidism, and / or secondary adrenal insufficiency. Hypopituitarism was more frequent with increasing tumor size, especially in more than 1 axis (P for trend <0.001). We found a difference in the prevalence of hypopituitarism between micro- / macroadenomas and giant PAs (P <0.001). Insufficiency in gonadal, corticotropic, and thyrotropic axes was diagnosed more often in the patients with giant PA than in those with macroadenomas (P = 0.005; P <0.001; P <0.001, respectively). There was no difference with respect to somatotropic axis insufficiency (P =0.79). Detailed data are shown in Table 5.
Parameter | Microadenoma (n = 4) | Macroadenoma (n = 174) | Giant adenoma n = 16 | P value | |
χ2 trend test | Fisher exact test | ||||
Data are presented as number (percentage). A P value <0.05 was considered significant. | |||||
Gonadal axis | 0 | 55 (32) | 11 (69) | <0.001 | 0.005 |
Corticotropic axis | 0 | 47 (27) | 12 (75) | <0.001 | <0.001 |
Thyreotropic axis | 0 | 48 (28) | 13 (81) | <0.001 | <0.001 |
Somatotropic axis | 0 | 10 (6) | 1 (6) | 0.79 | >0.99 |
The patients with giant adenomas required reoperation more often than the individuals with micro- or macroadenomas (P = 0.003; P for trend <0.001). There was no correlation between the need for reoperation and tumor type (P = 0.14).
Age and sex distribution
Among men, 81% were diagnosed with NFPA and 19% with other tumors. Regarding tumor size, 86% of men had macroadenomas, and 12% had giant PA. In the group of women, two‑thirds had NFPA, one‑third had a functioning tumor, 96% had macroadenoma, and 2% had giant PA. Detailed data are shown in Figure 2. Men were diagnosed with a nonfunctioning tumor significantly more often than women (P = 0.02). We observed larger tumors in men at diagnosis (P = 0.005; P for trend = 0.004).
Abbreviations: see Table 2
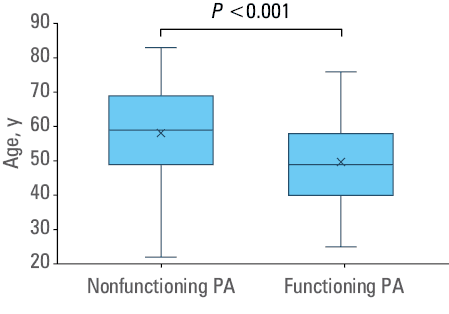
A comparison of patients with nonfunctioning and functioning tumors based on age is shown in Figure 3. The patients with NFPA were older at the time of diagnosis (P <0.001). The median (IQR) age in the NFPA group was 59 (49–69) years, and in the functioning tumor group, it was 49 (40–58) years.
We did not find an association between tumor type and place of residence (P = 0.3).
Discussion
In our analysis, we concentrated specifically on clinically relevant tumors that required surgical treatment. During the observation period, a total of 1111 patients with PA were hospitalized at the Department of Endocrinology, while 194 underwent transsphenoidal PA resection in our center. Although over 60% of PAs were diagnosed in women, clinically relevant tumors requiring surgery were more frequent in men. Over three‑fourths of the patients were diagnosed with NFPA. The larger the tumor was by the time of diagnosis, the more often it was NFPA. Due to a lack of symptoms associated with hormonal production, nonfunctioning tumors are diagnosed later and at more advanced stages. Larger tumor size correlated with higher rates of invasiveness, optic chiasm compression, and visual field defect. It was also associated with a higher likelihood of hypopituitarism. We observed hypogonadism, secondary hypothyroidism, and secondary adrenal insufficiency significantly more often in the patients with giant PAs than in those with macroadenomas. Twenty‑five percent of the analyzed cohort had recurrent disease, and the patients with giant adenomas required reoperation significantly more often than the ones with smaller tumors. However, we did not find an association between tumor type and the need for reoperation. Larger, nonfunctioning tumors were diagnosed more often in men than in women. The patients with NFPA were older at the time of diagnosis. Although more than half of the patients had several comorbidities, we did not observe any specific correlation with the tumor type. We also did not find an association between tumor type and place of residence.
A majority of PAs are found incidentally, and because of that, they are referred to as “pituitary incidentalomas.” They are asymptomatic, small in size, and rarely clinically relevant. Clinically relevant PA is defined as a pituitary tumor that causes clinical signs and symptoms due to hormone hypersecretion and / or mass effect, and that has been confirmed on radiological imaging and biochemical testing. Such tumors typically warrant medical and / or surgical intervention based on their functional activity or impact on surrounding structures.5 According to the most recent Central Brain Tumor Registry of the United States from the years 2016–2020, the estimated incidence of PAs was 4.53 per 100 000 population, with histologically confirmed PA incidence of 3.97 per 100 000 population; 3.51 per 100 000 population for men and 4.51 per 100 000 population for women.2 PAs were diagnosed most often in the age group of 40–64‑year‑olds (incidence 5.47 per 100 000 population), significantly more often in individuals of black ethnicity (6.38 per 100 000 population). In a 30‑year (1989–2019) population‑based analysis from the Mayo Clinic, including 435 patients, the standardized IR was 3.77 to 16.87 per 100 000 population and demonstrated linear expansion over time.19 In a large study involving 113 349 adults with PA identified from the United States National Cancer Database in the years 2004–2017, 53% of PAs occurred in women.20 Female patients were diagnosed at a younger age, with a median age of 48 years vs 57 years in men.20 We observed similar IRs, with mean annual incidence of 4.11 cases per 100 000 population. Likewise, the incidence in our single center was higher among women (5.07 per 100 000 population) than men (3.07 per 100 000 population). In our cohort of all patients with PA, the mean age was 46 years for women and 50 years for men. In the group of clinically relevant tumors, we observed a similar trend, as the male patients with NFPA were significantly older at the time of diagnosis than the female ones. Also, consistent with prior reports, we found larger tumors at the time of diagnosis in men. While women showed a higher overall prevalence of PAs, clinically relevant tumors requiring surgery were more frequent in men.
A review by Daly and Beckers5 established the prevalence of clinically relevant PAs based on studies conducted on a geographically diverse population of more than 2 million people from the United Kingdom and Sweden, along with collected databases from Argentina, Canada, Malta, and Iceland.21-25 Overall, PAs occurred at a mean incidence of approximately 5.1 per 100 000 population per year (range, 3.9–7.4 per 100 000 population per year).5 According to these studies, clinically relevant pituitary tumors had an average prevalence of 89.1 per 100 000 population. Over two‑thirds of the patients were women. Macroadenomas occurred in 47.8% of the cases.5 Clinically, PRLs were the most frequently diagnosed PAs (53%), while NFPAs were present in 30.5% of the cases.5 GH‑PAs were found in 11.8% of the patients, ACTH‑PAs in 4.4%, while TSH‑secreting PAs constituted less than 1.3% of the tumors.5 A population‑based study from South Korea evaluated 31 898 patients with PAs during the years 2005–2015, and reported an overall annual incidence of 5.8 per 100 000 population.26 The annual IRs (per 100 000 population) were 3.5 for NFPA, 1.6 for PRL, 0.5 for GH‑PA, and 0.2 for adrenocorticotropic or TSH‑secreting PA.26 The median age at the diagnosis was 47 years, and the highest incidence was observed in women aged 25–69 years.
Although PRLs are the most common type of PAs, they are frequently diagnosed and managed in outpatient settings, as they often respond well to dopamine agonist therapy and rarely require surgical intervention.27 However, surgery should be discussed alongside dopamine agonist treatment as the first‑line option, especially in the patients with rapidly progressive vision loss due to a sellar mass, as well as in younger patients, with a high chance of cure.14 Consequently, our analysis of clinically relevant tumors requiring surgery showed a relatively lower proportion of PRLs, as compared with other tumor types, especially NFPAs.
Sex is a crucial and nonmodifiable risk factor in the development of numerous cancers.28 There is a difference between sexes regarding the occurrence of functioning PAs and their clinical manifestations, particularly in the case of PRLs. The IR is clearly higher in women than in men up to the fifth decade of life, and the difference disappears after menopause.29 Interestingly, PRLs may exhibit a more aggressive course in men.29 Data on sex differences in NFPAs are conflicting.23,24,30-32 In our group of clinically relevant tumors, men were diagnosed with NFPA significantly more often than women (67% vs 33%, respectively). This is consistent with findings of a Swedish series of 592 patients diagnosed with NFPA, where 65.4% of nonfunctioning tumors were found in men.24 Similar findings were reported in a retrospective observational study from Iceland (51.2% of NFPAs were found in men),30 and a single‑center study from Iran,31 which confirmed that among the patients with NFPA undergoing surgical resection, 66% were men. On the other hand, a retrospective study from Nova Scotia, Canada, reported a higher prevalence of NFPAs in women.33
Risk factors of PAs are broadly studied. The HUNT study (The Nord‑Trøndelag Health Study) has shown that current smoking reduces the risk of PA by around 73%, as compared with never smoking, regardless of sex.34 Moreover, there is a strong association between the number of pack‑years of smoking and the risk of PA. In patients smoking more than 10 pack‑years, the risk is reduced by 76%, as compared with never‑smokers.34 In our cohort, most of the patients were nonsmokers. The same study tried to find a correlation between overweight and the risk of PA but no association was established,34 which is in line with our findings.
In our series, men presented with significantly larger tumors at the time of diagnosis. In association with that, we observed higher rates of compressive symptoms related to tumor mass effect, including headache, visual field defect, hypopituitarism, and concurrent hyperprolactinemia. Over two‑thirds of the patients who presented with hypogonadism, secondary hypothyroidism, and secondary adrenal insufficiency were men. This sex discrepancy in the size of the adenoma at diagnosis is likely due to the fact that functional symptoms are more clinically apparent in premenopausal women (eg, infertility, oligomenorrhea, or galactorrhea), leading to earlier diagnoses of smaller lesions in women. Functional adenomas in patients under 50 years old are more commonly seen in women than in men, but in older patients, the male‑to‑female ratio evens out.33
Although our study is, to our best knowledge, the first one to date that analyzed PA epidemiology in Polish patients, several limitations need to be mentioned. Our analysis is based on evidence from a single‑center population. Another limitation is the retrospective design, due to which some data elements were not consistently available. As GH is secreted by pulses and has a short half‑life, and its single measurement might be prone to error, in all cases of suspected GH deficiency or excess, diagnostic tests were performed in accordance with current guidelines16,36-39: in the cases of suspected excess GH, an oral glucose suppression test was performed, and in the patients with diabetes, GH concentrations were measured every 30 minutes, with the mean value calculated from 5 time points; for suspected GH deficiency, an insulin tolerance test and an L‑DOPA test were used. The somatotropic axis was always assessed together with IGF‑1 measurement. Our center is the only institution in the Greater Poland and Lubusz voivodeships that specializes in PA treatment. However, due to the organization of the health care system in Poland, patients are migrating between different centers. Finally, the analysis period included the COVID‑19 pandemic, which may have significantly influenced hospitalization rates. Changes in health care accessibility, patients’ fear of infection, and postponement of elective surgeries during the pandemic could have affected the number and timing of pituitary tumor surgeries. Therefore, the observed trends may not fully reflect typical patterns of care in a nonpandemic period.
Conclusions
We observed an increasing incidence of PAs, with a predominance of such diagnosis in women. On the other hand, tumors requiring surgery were more frequent in men. Male patients were more likely to present with NFPA, and their tumors were larger at the time of diagnosis, as compared with the ones diagnosed in women. The patients with giant PAs exhibited significantly higher rates of hypopituitarism and required more reoperation procedures. While more than half of the patients had several comorbidities, no specific correlation with tumor type was observed.
- Araujo‑Castro M, Berrocal VR, Pascual‑Corrales E. Pituitary tumors: epidemiology and clinical presentation spectrum. Hormones. 2020; 19: 145‑155. | Crossref
- Ostrom QT, Price M, Neff C, et al. CBTRUS statistical report: primary brain and other central nervous system tumors diagnosed in the United States in 2016‑2020. Neuro Oncol. 2023; 25: iv1‑iv99. | Crossref
- Lake MG, Krook LS, Cruz SV. Pituitary adenomas: an overview. Am Fam Physician. 2013; 88: 319‑327. | Crossref
- Melmed S, Kaiser UB, Lopes MB, et al. Clinical biology of the pituitary adenoma. Endocr Rev. 2022; 43: 1003‑1037. | Crossref
- Daly AF, Beckers A. The epidemiology of pituitary adenomas. Endocrinol Metab Clin North Am. 2020; 49: 347‑355. | Crossref
SUPPLEMENTARY MATERIAL
ARTICLE INFORMATION