Endothelial function in patients with rheumatoid arthritis without classic cardiovascular risk factors is determined by subclinical lipid disturbances and compensatory vascular adaptation
1 , 2, 2,3, 1*, 2,4*
Key words: endothelial function, flow-mediated dilation, rheumatoid arthritis, skin microcirculation, vascular adaptation
, 2, 2,3, 1*, 2,4*
Key words: endothelial function, flow-mediated dilation, rheumatoid arthritis, skin microcirculation, vascular adaptation

 CC BY 4.0
Endothelial function in patients with rheumatoid arthritis without classic cardiovascular risk factors is determined by subclinical lipid disturbances and compensatory vascular adaptation
Introduction: Endothelial dysfunction has been reported in rheumatoid arthritis (RA) patients without classic cardiovascular risk factors, but findings remain inconsistent.
Objectives: We aimed to assess whether endothelial function is impaired in RA with moderate inflammatory burden in the absence of established cardiovascular risk factors.
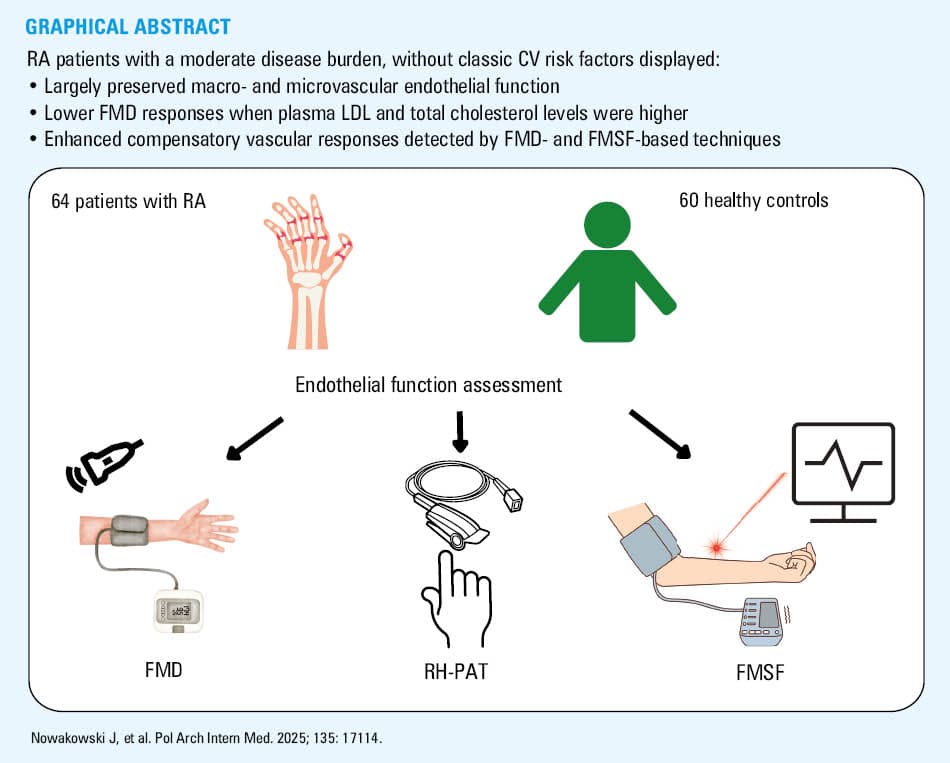
Patients and methods: This cross‑sectional study was conducted in 64 patients with RA without classic cardiovascular risk factors and 60 healthy age- and sex‑matched controls. Endothelial function was evaluated in the brachial artery by flow‑mediated dilation (FMD), in the peripheral and skin microcirculation by reactive hyperemia (RH) peripheral arterial tonometry, and flow‑mediated skin fluorescence (FMSF), respectively.
Results: There were no significant differences in the endothelial function parameters between the patients with RA and healthy controls. However, the patients with RA had increased median (interquartile range [IQR]) augmentation index of 3 (–9 to 10) vs –6.5 (–16 to 2; P = 0.003) in the controls. As many as 29 patients with RA that displayed lowered FMD (<7%) had higher mean (SD) level of total cholesterol (5.09 [0.85] vs 4.47 [0.77] mmol/l; P = 0.005) and higher mean (SD) level of low‑density lipoprotein cholesterol (LDL‑C; 2.92 [0.86] vs 2.42 [0.75] mmol/l; P = 0.02). Surprisingly, the subgroup with FMD above 7% had higher median (IQR) C‑reactive protein level than the patients with FMD below 7% (1.11 [1–8.46] vs 1 [1–1] mg/l; P = 0.03). Furthermore, microvascular responses measured by FMSF (RH response, %) were augmented in the patients with higher LDL‑C level, as compared with the group of RA individuals with lower LDL‑C level.
Conclusions: RA, even with a moderate inflammatory burden, may facilitate detrimental effects of lipoproteins on macrovascular endothelial function. Interestingly, compensatory vascular responses were detected that may precede overt vascular dysfunction. Their monitoring may be useful in endothelium‑targeted therapy.
What's new?
This study demonstrated that patients with rheumatoid arthritis (RA) without classic cardiovascular risk factors and with moderate disease burden generally have preserved endothelial function. However, those with elevated levels of total cholesterol and low‑density lipoprotein cholesterol (LDL‑C) displayed lowered flow‑mediated dilation (FMD), suggesting that RA in young and middle‑aged individuals may exacerbate harmful effects of lipoproteins on macrovascular endothelial function. In contrast, microvascular response in the skin was enhanced in RA patients with higher LDL‑C levels. In addition, RA patients with increased C‑reactive protein levels exhibited a better FMD response and higher maximal shear rate and shear stress. These findings highlight a heterogeneous endothelial response in the skin microcirculation and conduit vessels of RA patients with a relatively low disease burden. Furthermore, our study underscores the importance of strict lipid profile control in RA patients and suggests that compensatory vascular adaptations—detectable before overt vascular dysfunction—may serve as early diagnostic markers.
Introduction
Rheumatoid arthritis (RA) is the most prevalent autoimmune arthritis. It is not only responsible for pain, disability, and decreased quality of life, but also carries a substantial cardiovascular risk translated into increased cardiovascular morbidity and mortality shared by several other autoimmune diseases.1 In patients with RA,2 acceleration of atherosclerosis development and early signs of vascular remodeling are well‑established findings, even in younger individuals without overt cardiovascular disease. The clinical importance of the cardiovascular burden of RA is frequently compared to that of diabetes,3 but the approach to monitoring the cardiovascular risk in RA and diabetes is different. Recently, researchers have attempted to incorporate the presence of RA into the next generation of the Systematic Coronary Risk Evaluation models.4
Given the key role of endothelial dysfunction (ED) with its prothrombotic, proinflammatory, and pro‑oxidant phenotype5 in the development of atherosclerosis and cardiovascular diseases, there have been numerous studies characterizing endothelial function in patients with RA that aimed to find the link between RA‑induced ED and the increased prevalence of cardiovascular diseases in this population. ED was repeatedly detected in patients with RA; however, it is still uncertain which factors are responsible for its occurrence.6,7 Classic cardiovascular risk factors and systemic inflammation were proposed to be causally involved. In fact, numerous reports demonstrated that classic cardiovascular risk factors were prevalent in patients with arthritis. RA was more common in smokers,8,9 arterial hypertension affected 40% of patients with RA, and hypercholesterolemia was found in 31% of this population.10 Importantly, up to 30% of patients with RA had their modifiable cardiovascular risk factors poorly managed in the outpatient setting.11
On the other hand, multiple proinflammatory cytokines that play a pathogenic role in RA were reported to be involved in ED and atherosclerosis progression,12 suggesting that systemic inflammation can contribute significantly to the development of ED even in the absence of classic cardiovascular risk factors. Indeed, upregulation of various proinflammatory cytokines, such as interleukin 6 (IL‑6), tumor necrosis factor (TNF), members of the IL‑1 family (IL‑1, IL‑18, and IL‑33), and IL‑17, was demonstrated in patients with RA.13 In several studies, the presence of ED correlated with elevated levels of inflammatory biomarkers, proinflammatory cytokines, and moderate‑to‑high disease activity.14 These findings supported the idea that maintaining remission should provide an improvement in ED and vascular inflammation and, subsequently, a reduction in cardiovascular risk. In fact, a number of studies reported that some anti‑inflammatory therapies reduced cardiovascular risk in RA patients.15 However, even after successful biological treatment (in terms of decreased disease activity), the residual cardiovascular risk appeared to persist, as evidenced in a large Scandinavian cohort of patients with RA.16 Furthermore, ED was present even in young, otherwise healthy patients with low‑activity RA,17 suggesting that low disease activity in young patients with RA may still be associated with the impaired endothelial function.
Taken together, the evidence overwhelmingly suggests that RA can lead to ED, but the mechanisms involved remain unclear. It is still unexplained to what extent ED is due to the specific inflammatory burden linked to RA or whether it is rather related to comorbidities. These uncertainties stem from the design of most previous studies that detected ED in patients with RA. These studies involved heterogeneous groups, observed over a long‑term disease trajectory, and utilized a variety of methods to assess the endothelium, and only in a few reports were macro- and microvascular endothelial functions evaluated simultaneously.
To address the knowledge gap concerning ED in RA, this study aimed to determine whether young and middle‑aged patients with RA, who were unaffected by classic cardiovascular risk factors, would exhibit ED. Furthermore, to comprehensively analyze the endothelial function, we used 3 noninvasive in vivo methods to assess the endothelial function in the conduit artery and in the microcirculation, that is, flow‑mediated dilation (FMD) in the brachial artery, reactive hyperemia peripheral arterial tonometry (RH‑PAT) in the peripheral microcirculation, and flow‑mediated skin fluorescence (FMSF) in the skin microcirculation, with multiple parameters to quantify functional endothelial responses in FMD-, RH‑PAT-, and FMSF‑based techniques.
Patients and methods
In this cross‑sectional study, patients were recruited at the University Hospital in Kraków, Poland. The study was approved by the Ethics Committee of the Jagiellonian University (1072.6120.162.2020) and conducted in accordance with the Declaration of Helsinki. The patients were men and women of Polish ethnicity, aged between 18 and 50 years, diagnosed with RA classified according to the 2010 American College of Rheumatology / European Alliance of Associations for Rheumatology criteria. Healthy controls were volunteers recruited among the University Hospital staff matched for age and sex with the RA patients.
Exclusion criteria
We excluded the patients with inflammatory diseases other than RA, acute or chronic infections, chronic kidney disease, cancer in the last 5 years prior to enrollment, history of any cardiovascular or thrombotic event, diagnosed dyslipidemia, statin use, diabetes, gout, current endocrine dysfunction, positive familial history of early atherosclerosis in first‑degree relatives, obesity (body mass index ≥30 kg/m2), active or past smoking, and active or past use of illegal drugs.
Clinical and laboratory data
Sociodemographic and anthropometric details were collected. Laboratory data from venous blood samples collected after 12 hours of fasting comprised complete blood count, neutrophil / lymphocyte ratio, platelet / lymphocyte ratio, monocyte / lymphocyte ratio, erythrocyte sedimentation rate (ESR), the levels of C‑reactive protein (CRP), glucose, creatinine, total cholesterol (TC), low‑density lipoprotein cholesterol (LDL‑C), high‑density lipoprotein cholesterol, triglycerides, thyroid stimulating hormone, rheumatoid factor, and anti‑citrullinated peptide antibodies, and liver function tests. In our laboratory, the lowest CRP values are presented as below 1 mg/l, and in this study they were rounded up to 1 mg/l. Disease activity was evaluated using the Disease Activity Score 28 based on ESR (DAS28‑ESR) and CRP (DAS28‑CRP), the Clinical Disease Activity Index, and the Simple Disease Activity Index. Therapeutic data, including the type of disease‑modifying antirheumatic drugs (DMARDs) were obtained, along with the use of glucocorticoids (GCs), cumulative time of exposure to GCs, GC‑free time, treatment duration with nonsteroidal anti‑inflammatory drugs (NSAIDs), NSAID‑free time, and the mode of NSAID therapy (continuous or as needed). If clinically justified and safe, GCs were withheld for 2 weeks before enrollment, and systemic use of NSAIDs was discontinued up to 72 hours before enrollment.
Assessment of endothelial function
The details of the FMD, RH‑PAT, and FMSF test protocols and their respective parameters measured were described previously.18 Briefly, in FMD functional test, a classic noninvasive method to assess endothelial function in the conduit artery, a percentage increase in lumen diameter during FMD, expressed as FMD%, was measured. Then, FMD% was normalized for shear rate (SR) or shear stress (SS) and the following parameters were calculated: SR max (maximal SR at the peak of HR), SR in 30 seconds and in 60 seconds (maximal SR after 30 s and 60 s, respectively), FMD/SR area to max (FMD normalized for the area under the curve [AUC] of SR max), FMD/SS area to max (FMD normalized for the AUC of SS). Finger plethysmography (RH‑PAT) was measured simultaneously with FMD upon release of the cuff during RH to obtain the RH index and augmentation index (AI), a measure of arterial stiffness. FMSF was used to study endothelial function in the skin microcirculation with a number of parameters measured reflecting baseline oscillations, RH response (RHR), and reperfusion phase as previously described.19,20
Statistical analysis
Statistical analysis was performed using R software, version 4.1.1 (IDE: R Studio 1.4.1717, Vienna, Austria) and Statistica package (TIBCO, version 13.3, Palo Alto, California, United States). Graphical presentation of the data was performed using OriginLab software (OriginPro 2025b, build 10.2.5.212, OriginLab Corporation, Northampton, Massachusetts, United States). The sample size for each group was calculated using a power analysis with the following assumptions: the study sample consists of 2 groups (k = 2) of similar size, and the effect size between the groups was assumed to be moderate. A moderate effect size corresponded to the conventional value of f = 0.25.21 The probability of rejecting the null hypothesis with an alternative at a significance level of α = 5% was set at 1–β = 80%. According to the calculations, the minimum size of each group based on the established values of the parameters k, f, α, and 1–β was estimated as n = 62.7 observations. Pairwise deletion was used to handle missing data. Quantitative data were expressed as mean and SD or as median and interquartile range (IQR), depending on the normality of the distribution. Categorical variables were summarized as percentages. The significance level was set at a P value below 0.05. For between‑group comparisons of continuous variables, the t test was used for normally distributed data. Nonparametric comparisons were made using the Mann–Whitney test. To compare 3 groups, we used 1‑way Welch analysis of variance (ANOVA) for the parametric tests, and 1‑way Kruskal–Wallis ANOVA for the nonparametric tests. Categorical data were compared with the χ2 and Fisher tests, and the strength of the association was determined with the Cramer V and φ tests. The correlation was calculated with the Spearman rank correlation due to non‑normal distribution of the variables and the absence of a linear relationship between them. A subgroup analysis was performed to compare the subsets of patients with impaired endothelial function and those with normal endothelial parameters.
Results
A total of 124 patients (64 with RA and 60 matched controls) were examined. Basic and laboratory data of the patients with RA and healthy controls are shown in Table 1. Clinical characteristics of the patients with RA are presented in Table 2. As many as 49 patients with RA (76.6%) were seropositive, 23 patients (36%) had early RA, and 41 (64%) had established RA. The average disease activity was moderate. A total of 65.6% of the patients were on methotrexate, 40.6% were treated with biologic DMARDs (TNF or IL‑6 inhibitors). The endothelial function parameters in the patients with RA and healthy controls are shown in Table 3. Clinical characteristics of the RA patients with and without macrovascular endothelial dysfunction are presented in Table 4. There were no significant differences in the endothelial function parameters between the patients with RA and healthy controls. However, the individuals with RA had increased AI of 3 (–9 to 10) vs –6.5 (–16 to 2; P = 0.003). The patients with RA categorized by disease activity did not show differences in the endothelial function parameters. Interestingly, the subset of patients with FMD below 7% showed higher mean (SD) TC level (5.09 [0.85] vs 4.47 [0.77] mmol/l; P = 0.005), and LDL‑C level (2.92 [0.86] vs 2.42 [0.75] mmol/l; P = 0.02; Figure 1). On the other hand, the subgroup with FMD above 7% (n = 29) had higher median (IQR) CRP level (1.11 [1–8.46] vs 1 [1–1] mg/l; P = 0.03). The patients with plasma CRP level of 2 mg/l or above had higher FMD/SR max [au] than the patients with normal CRP levels (0.0103 [0.0033–0.0123] vs 0.0059 [0.0027–0.0078]; P = 0.02; Figure 1). Notably, there was a significant weak correlation between CRP and FMD%, and a weak‑to‑moderate correlation for CRP vs FMD parameters normalized for SR max and SS max (Table 5). RH‑PAT or FMSF did not discriminate the patients in terms of their lipid profile or inflammatory status. However, the analysis of the microcirculation oscillation contribution showed a higher median (IQR) percentage of neural oscillations in the RA group than the controls (17.38% [10.88%–28.38%] vs 13.44% [8.44%–21.52%]; P = 0.02; Supplementary material, Table S1). Interestingly, in the analysis of FMSF parameters, high RHR% was more frequent in the patients with RA and LDL‑C level equal to or above 2.5 mmol/l than in the patients with RA and LDL‑C level below 2.5 mmol/l (Figure 2). The patients with RA exhibited higher median (IQR) value of the neurogenic component of the microcirculation oscillations than the control group (17.38% [10.88%–28.38%] vs 13.44% [8.44%–21.52%]; P = 0.02; Supplementary material, Table S1).
Variable | RA (n = 64) | Controls (n = 60) | P value |
Data are presented as mean (SD) or median (interquartile range) unless provided otherwise.
a χ2 test; b Mann–Whitney test; c t test
SI conversion factors: to convert hemoglobin to g/l, multiply by 10
Abbreviations: ACPA, anticitrullinated peptide antibody; ALT, alanine transaminase; AST, aspartate transaminase; BMI, body mass index; CRP, C‑reactive protein; DBP, diastolic blood pressure; ESR, erythrocyte sedimentation rate; Hb, hemoglobin; HDL‑C, high‑density lipoprotein cholesterol; Ht, hematocrit; LDL‑C, low‑density lipoprotein cholesterol; Mono/Lymph R, monocytes to lymphocytes ratio; Neu/Lymph R, neutrophil to lymphocyte ratio; PLT/Lymph R, platelet‑to‑lymphocyte ratio; RA, rheumatoid arthritis; RF, rheumatoid factor; SBP, systolic blood pressure; TC, total cholesterol; TG, triglycerides; TSH, thyroid‑stimulating hormone | |||
Womena, n (%) | 54 (84.4) | 40 (66.6) | <0.001 |
Ageb, y | 39.5 (31.75–43.25) | 36 (27.75–41.25) | 0.16 |
BMIb, kg/m2 | 23 (20.3–25.52) | 22.25 (20.15–24.5) | 0.27 |
SBPc, mm Hg | 121 (12) | 121 (11) | 0.9 |
DBPc, mm Hg | 74 (6.6) | 73 (7.5) | 0.83 |
ESRb, mm/h | 9 (6–17.25) | 6 (4–9.5) | <0.001 |
CRPb, mg/l | 1 (1–2.79) | 1 (1–1) | 0.01 |
Neu/Lymph Rb | 2.27 (1.49–2.82) | 1.69 (1.34–1.89) | 0.002 |
PLT/Lymph Rb | 167.2 (140.24–225.84) | 150.71 (134.01–191.84) | 0.06 |
Mono/Lymph Rb | 0.3 (0.24–0.4) | 0.25 (0.22–0.33) | 0.03 |
Htc, % | 38.14 (3.88) | 40.54 (3.4) | <0.001 |
Hbb, g/dl | 12.7 (12–13.72) | 13.75 (12.97–14.62) | <0.001 |
Glucosec, mmol/l | 4.71 (0.47) | 4.91 (0.47) | 0.02 |
Creatinineb, µmol/l | 62.95 (57–70.55) | 66 (60.53–78.65) | 0.07 |
TCb, mmol/l | 4.5 (4.28–5.3) | 4.65 (4.2–5.33) | 0.86 |
LDL‑Cb, mmol/l | 2.5 (2.18–3.02) | 2.6 (2.1–3.06) | 0.95 |
HDL‑Cc, mmol/l | 1.65 (0.45) | 1.76 (0.46) | 0.17 |
Non–HDL‑Cb, mmol/l | 2.89 (2.48–3.59) | 2.87 (2.3–3.51) | 0.49 |
TGb, mmol/l | 0.85 (0.72–1.4) | 0.8 (0.65–1.42) | 0.37 |
ALTb, IU/l | 19.5 (15.75–28.25) | 19 (13.75–27) | 0.52 |
ASTb, IU/l | 22.5 (18.75–26.25) | 22 (19–28) | 0.87 |
TSHb, µIU/ml | 1.97 (1.43–2.56) | 1.77 (1.44–2.27) | 0.34 |
RF, IU/ml | 27.15 (11.3–129.75) | – | N/A |
ACPA, IU/ml | 90.05 (8–500) | – | N/A |
Variable | Number (%) | Median (IQR) |
Abbreviations: bDMARDs, biological disease‑modifying antirheumatic drugs; DAS28 (CRP), disease activity score 28 (based on C‑reactive protein); DAS28 (ESR), disease activity score 28 (based on erythrocyte sedimentation rate); GC, glucocorticoid; IL‑6i, interleukin‑6 inhibitor; NSAID, nonsteroidal anti‑inflammatory drug; TNFi, tumor necrosis factor inhibitor; others, see Table 1 | ||
Seropositivity | 49 (76.6) | – |
Early RA | 23 (36) | – |
Established RA | 41 (64) | – |
Swollen joint count | 64 (100) | 4 (0–7.25) |
Tender joint count | 64 (100) | 2 (0–20) |
Visual analog scale | 64 (100) | 30 (15–50) |
DAS28 (ESR) | 64 (100) | 3.32 (0–7.22) |
DAS28 (CRP) | 64 (100) | 3.2 (2.23–4.82) |
Clinical Disease Activity Index | 64 (100) | 12.5 (0–49) |
Simple Disease Activity Index | 64 (100) | 12.1 (0–49) |
Disease duration, y | 64 (100) | 5 (2–11) |
Disease activity: low / remission | 26 (40.6) | – |
Disease activity: moderate | 26 (40.6) | – |
Disease activity: high | 12 (18.8) | – |
Methotrexate | 42 (65.6) | – |
Methotrexate dose, mg/wk | – | 12.5 (0–21.25) |
Methotrexate duration, y | – | 3 (0.1–4) |
bDMARD | 26 (40.6) | – |
bDMARD duration, y | – | 0 (0.1–4) |
bDMARD: TNFi | 19 (73.1) | – |
bDMARD: IL‑6i | 7 (26.9) | – |
GC‑free time, mo | – | 6 (0–42) |
GC exposure, y | – | 1 (0–10) |
NSAID‑free time, wk | – | 9 (2–23.25) |
NSAID exposure, mo | – | 3 (0.25–8) |
Variable | RA (n = 64) | Controls (n = 60) | P value |
Data are presented as mean (SD) or median (interquartile range).
a Mann–Whitney test; b t test
Abbreviations: AI, augmentation index; AI 75, augmentation index for 75 beats per minute; FMD, flow‑mediated dilation; FMD/SR area to max, FMD normalized for shear rate area under the curve; FMD/SR max, FMD normalized for maximal shear rate; FMD/SS area to max, FMD normalized for shear stress area under the curve; FMD/SS max, FMD normalized for maximal shear stress; HR, hyperemic response; RHI, reactive hyperemia index; SR base, baseline shear rate before occlusion; SR 30 s, shear rate after 30 seconds of hyperemic response; SR 60 s, shear rate after 60 seconds of hyperemic response; SR max, maximal shear rate at the peak hyperemic response; SS base, baseline shear stress; SS max, maximal shear stress; others, see Table 1 | |||
FMDa, % | 6.98 (4.71–11.25) | 6.46 (4.1–8.26) | 0.18 |
RHIa | 1.96 (1.78–2.31) | 1.96 (1.67–2.34) | 0.91 |
AIa, % | 3 (–9 to 10) | –6.5 (–16 to 2) | 0.003 |
AI 75a, % | –4 (–12 to 7) | –9.5 (–20.75 to –1.25) | 0.003 |
HR indexb, % | 13.54 (2.62) | 13.86 (3.11) | 0.13 |
SR basea, s–1 | 308.4 (221.5–436) | 305.1 (234.95–481.1) | 0.98 |
SR maxa, s–1 | 1185.9 (990.9–1621.4) | 1140.2 (978.5–1463) | 0.47 |
SR area to maxa, s–1 | 21 185.7 (15 241.7–38 875.3) | 24 923.8 (16 118.35–48 288.15) | 0.26 |
SR 30 sa, s–1 | 561.7 (405.07–992.12) | 628.4 (497.75–789.7) | 0.75 |
SR 60 sa, s–1 | 378.55 (313.82–650.77) | 432.5 (343.9–567) | 0.67 |
SS basea, au | 0.94 (0.71–1.35) | 1.02 (0.79–1.6) | 0.51 |
SS maxb, au | 4.11 (1.4) | 4.02 (1.02) | 0.71 |
SS area to maxa, au | 66.74 (47.44–130.09) | 84.28 (59.37–155.77) | 0.22 |
FMD/SR area to maxa, au | 3.12 (1.31–4.86) × 10–4 | 2.26 (0.99–4.61) × 10–4 | 0.21 |
FMD/SS area to maxa, au | 0.1 (0.04–0.16) | 0.07 (0.03–0.12) | 0.21 |
FMD/SR maxa, au | 0.01 (0–0.01) | 0.01 (0–0.01) | 0.1 |
FMD/SS maxa, au | 1.96 (0.91–3.05) | 1.68 (1.14–2.57) | 0.99 |
Variable | FMD <7% (n = 29) | FMD ≥7% (n = 29) | P value |
Data are presented as mean (SD) or median (interquartile range).
a Mann–Whitney test; b t test
| |||
ESRa, mm/h | 9 (6–15) | 8 (6–18) | 0.56 |
CRPa, mg/l | 1 (1–1) | 1.11 (1–8.46) | 0.03 |
Htb, % | 39.4 (4) | 36.9 (3.6) | 0.02 |
Hba, g/dl | 12.9 (12.1–14.5) | 12.4 (11.8–13.5) | 0.13 |
RBCa, G/l | 4.48 (4.2–4.7) | 4.33 (4.19–4.54) | 0.42 |
WBCb, G/l | 6.04 (1.93) | 5.77 (1.99) | 0.6 |
Neub, G/l | 0.39 (0.16) | 0.33 (0.17) | 0.18 |
Lympha, G/l | 1.67 (1.41–2) | 1.41 (1.08–1.81) | 0.04 |
Monoa, G/l | 0.45 (0.36–0.6) | 0.47 (0.4–0.63) | 0.77 |
PLTb, G/l | 257.52 (61.72) | 299.14 (90.16) | 0.045 |
Neu/Lymph Ra | 2.05 (1.49–2.6) | 2.59 (1.60–3.11) | 0.12 |
PLT/Lymph Ra | 154.62 (124.54–182.98) | 219.79 (165.57–257.95) | 0.002 |
Mono/Lymph Ra | 0.28 (0.22–0.36) | 0.33 (0.28–0.44) | 0.07 |
Glucoseb, mmol/l | 4.7 (0.45) | 4.77 (0.51) | 0.55 |
Creatininea, µmol/l | 67 (60.1–73) | 60 (56.5–66) | 0.02 |
TCb, mmol/l | 5.09 (0.85) | 4.47 (0.77) | 0.005 |
LDL‑Cb, mmol/l | 2.92 (0.86) | 2.42 (0.75) | 0.02 |
HDL‑Cb, mmol/l | 1.65 (0.44) | 1.66 (0.5) | 0.94 |
Non–HDL‑Cb, mmol/l | 3.26 (1.04) | 2.96 (0.73) | 0.21 |
TGa, mmol/l | 0.83 (0.65–0.99) | 0.96 (0.8–1.44) | 0.07 |
ALTa, U/I | 22 (17–30) | 18 (14–21) | 0.04 |
ASTa, U/I | 24 (19–29) | 19 (17–24) | 0.03 |
TSHa, µIU/ml | 1.9 (1.4–2.2) | 1.83 (1.43–3.16) | 0.28 |
RFa, IU/ml | 11.3 (11.3–128) | 30.5 (15–112) | 0.5 |


Discussion
Despite multiple reports demonstrating ED in RA patients it is still unclear whether ED in RA is due to the specific inflammatory burden linked to RA or is more related to comorbidities present in a majority of RA patients.22 In this study, we demonstrated that young and middle‑aged patients with RA, presenting with a moderate inflammatory burden in the absence of classic cardiovascular risk factors, exhibit largely preserved endothelial function, in both the conduit artery and microcirculation. Interestingly, the subgroup of patients with higher plasma LDL‑C level, but within the range where pharmacotherapy is not typically indicated based on current recommendations, showed impaired endothelial function measured by FMD. These results suggest that RA may exacerbate the harmful effects of lipoproteins on macrovascular endothelial function. In contrast, microvascular responses in the skin were enhanced in the RA patients with higher plasma LDL‑C level. Furthermore, the RA patients with increased CRP levels exhibited a better FMD response and higher SR max and SS max.
Taken together, these findings emphasize a heterogenous endothelial response observed in the skin, peripheral circulation, and the conduit vessels in RA of moderate disease burden. Furthermore, our study underscores the importance of strict lipid profile control in RA patients. Finally, we uncovered compensatory vascular adaptations in the FMD and FMSF tests that were detectable before overt vascular dysfunction, and may possibly serve as early diagnostic markers.
Although several reports on endothelial function in patients with RA have been published,2,7,8 our study is distinguished by its homogeneous cohort of young and middle‑aged patients (≤50 years old) who were rigorously screened to exclude classic cardiovascular risk factors and had limited exposure to GCs and NSAIDs. Most previous studies included patients with various classic cardiovascular risk factors.14,23 While methods such as FMD and RH‑PAT have been widely used,14,17 the novelty of our approach lies in expanding traditional FMD% diameter response by incorporating additional parameters that provide insights into changes in SR and SS. These parameters, which are modified by the inflammatory state—likely due to altered blood viscosity24—were also found to be altered in our work. To the best of our knowledge, these aspects of the FMD response have not been evaluated previously in patients with RA. Notably, altered SS and blood velocity during RH of FMD response had a stronger independent relationship with cardiovascular risk factors including age, blood pressure, and LDL‑C concentration, as compared with FMD% alone, supporting the value of these measurements in the patients with RA.25
From a methodological standpoint, it is worth adding that this study is the first to employ the FMSF method for assessing the functional status of skin microcirculation in RA. Previously, this technique has been applied in patients with diabetes,26 coronary artery disease,19 and other conditions.27 Remarkably, our findings suggest that young and middle‑aged patients with RA exhibit compensatory microcirculatory changes. A similar pattern has been reported in young patients with type 1 diabetes.28
Importantly, our study showed that none of the vascular tests were associated with RA disease activity, aligning with the current view that there is no direct relationship between micro- or macrovascular ED and disease activity in RA.29 This observation implies that, despite a favorable clinical response to RA treatment, patients remain at a risk for accelerated atherosclerosis. In fact, a recent study reported a residually increased incidence of myocardial infarction among RA patients successfully treated with biologics,16 and other evidence indicates that cardiac damage may persist even after achieving rheumatologic therapeutic goals.30 The increased arterial stiffness observed in our relatively healthy group of patients with RA suggests ongoing subclinical vascular pathology, indicating that effective anti‑inflammatory treatment may not fully protect against macrovascular ED. This is further supported by other reports detecting ED in young patients with RA despite standard treatment.17,31
An important finding of our work is that the subgroup of RA patients with higher LDL‑C level showed impaired endothelial function measured by FMD. This result advocates for closer lipid profile monitoring and suggests that the threshold levels of TC and LDL‑C currently deemed safe in RA, for example, the level of LDL‑C below 2.6 mmol/l (100 mg/dl) in patients with RA under 50 years old, without other cardiovascular risk factors, and irrespective of the disease activity, may need to be revisited. This recommendation would mirror current strategies for young and middle‑aged patients with diabetes.32 Our findings are particularly relevant in light of the underdiagnosis of hypercholesterolemia in RA33 and the promising outcomes of trials demonstrating the benefits of strict control of traditional cardiovascular risk factors.34 Furthermore, our results seem to challenge the “lipid paradox,” that is, a concept of an inverse relationship between systemic inflammation and lipid levels in patients with RA.35,36
Several studies have found correlations between macrovascular ED measured by FMD37 and microvascular dysfunction assessed with laser Doppler flowmetry38,39 with CRP and systemic inflammation in RA patients. However, these findings were not consistently confirmed by other reports.40 This inconsistency may be influenced by the heterogeneity of inflammatory biomarkers assessed in RA.41 Interestingly, Holmes et al42 reported that RA patients with elevated CRP level showed higher FMD% values, which aligns with our findings. These results suggest that, in patients without cardiovascular risk confounders, a compensatory vascular response leads to a higher FMD%, representing an early endothelial reaction to detectable systemic inflammation. CRP directly decreases the expression and bioactivity of endothelial nitric oxide synthase (eNOS),43 which may be due to increased blood viscosity related to systemic inflammation. In fact, the increased peak SR and increased SS observed in RA patients may stimulate nitric oxide–dependent vasodilation.44 In this context, detecting the initial inflammatory macrovascular endothelial response in RA should involve not only FMD% measurements, but also normalization for SR max. Noteworthy, hyperemic shear stress is a major correlate of brachial artery flow‑mediated dilation and the major stimulus for the FMD response correlating with risk factors in the Framingham Heart Study.45 On the other hand, increased FMD in RA patients with elevated CRP level may represent compensatory endothelial response described in other settings.3,5,46 Interestingly, in a rat model of adjuvant‑induced arthritis, increased eNOS activity was reported in early arthritis.47
It is plausible that this compensatory vascular response precedes the overt endothelial dysfunction, which eventually becomes more prevalent in patients with inflammatory arthropathies as cardiovascular risk factors accumulate.48,49 It is therefore speculated that the gradual loss of the compensatory endothelial response may drive the transition from an adaptive to a maladaptive endothelial phenotype as the inflammatory disease progresses, and, if monitored, may have a diagnostic value.
Measurement of skin microcirculation by FMSF in the RA patients provided interesting observations. First, higher neuronal oscillations during the recovery phase were observed in the RA group, possibly reflecting autonomic system dysregulation associated with RA that warrants further investigation.50 Second, the RA patients with LDL‑C levels exceeding 2.5 mmol/l displayed a paradoxically augmented RHR. These results may indicate a compensatory response in the skin microcirculation of the young and middle‑aged RA patients, similarly to a compensatory increase in FMD response.
Regarding microvascular ED in the patients with RA measured in the peripheral vasculature (RH‑PAT), our conclusions remain elusive. Although no impaired RH‑PAT response was detected, the RA patients exhibited higher AI parameters. This finding corroborates the results of Pieringer et al,51 who also reported increased AI in patients with RA without classic cardiovascular risk factors. Consequently, the elevated AI—indicative of increased arterial stiffness despite preserved endothelial function and absence of additional cardiovascular burden—may represent an intrinsic characteristics of RA.
Limitations
It is important to acknowledge several limitations of our study. In general, its cross‑sectional design precluded inferring causal relationships between the assessed parameters. Furthermore, single, time‑point measurements did not allow us to observe temporal progression in endothelial function or to study the impact of therapy on endothelial function. Additionally, the predominance of women in the RA group, although reflective of the disease’s natural epidemiology, may limit the generalizability of our findings, particularly in male RA patients, given known sex differences in the endothelial function and cardiovascular risk. Another limitation of our study is that we did not assess more refined or mechanistically‑oriented biomarkers, such as circulating ILs, endothelial adhesion molecules, or markers of oxidative stress, which could have provided deeper insights into the pathophysiological profile of the endothelial phenotype in the RA patients in our study that did not reveal a clear‑cut impairment of the endothelial function.
Moreover, the interpretation of the endothelial function and the determination of ED should be approached with caution, given the absence of standardized and widely accepted norms for the values of FMD, RH‑PAT, and FSMF parameters in the healthy population.
Conclusions
Our study found that the patients with RA with a moderate disease burden and without classic cardiovascular risk factors generally exhibit preserved macro- and microvascular endothelial function, as compared with healthy controls. However, the subset of these patients with higher plasma LDL‑C levels, despite moderate disease burden, displayed lower FMD response, suggesting their increased susceptibility to the deleterious effects of elevated plasma LDL‑C concentrations. These findings underscore the need to re‑evaluate lipid profile norms in RA patients at an increased cardiovascular risk, paralleling approaches used in the diabetic population. Additionally, the association between systemic inflammation and increased endothelial responses in the conduit artery, and between high LDL‑C level and a compensatory microvascular response in the skin microcirculation, point out to the presence of compensatory vascular responses detected by FMD- and FMSF‑based techniques, respectively. Future studies with larger patient cohorts are needed to develop an optimal, endothelium‑targeted therapeutic strategy to mitigate the cardiovascular risk in patients with RA and other autoimmune diseases.1 We are tempted to speculate that compensatory vascular responses may be used to monitor transition from adaptive to maladaptive phase of vascular responses in RA patients to monitor the evolving risk of cardiovascular disease development in this group of patients.
- Conrad N, Verbeke G, Molenberghs G, et al. Autoimmune diseases and cardiovascular risk: a population‑based study on 19 autoimmune diseases and 12 cardiovascular diseases in 22 million individuals in the UK. Lancet. 2022; 400: 733‑743. | Crossref
- Gonzalez‑Gay MA, Gonzalez‑Juanatey C, Vazquez‑Rodriguez TR, et al. Endothelial dysfunction, carotid intima‑media thickness, and accelerated atherosclerosis in rheumatoid arthritis. Semin Arthritis Rheum. 2008; 38: 67‑70. | Crossref
- Agca R, Hopman LHGA, Laan KJC, et al. Cardiovascular event risk in rheumatoid arthritis compared with type 2 diabetes: a 15‑year longitudinal study. J Rheumatol. 2020; 47: 316‑324. | Crossref
- Agca R, Heslinga SC, Rollefstad S, et al. EULAR recommendations for cardiovascular disease risk management in patients with rheumatoid arthritis and other forms of inflammatory joint disorders: 2015/2016 update. Ann Rheum Dis. 2017; 76: 17‑28. | Crossref
- Daiber A, Chlopicki S. Revisiting pharmacology of oxidative stress and endothelial dysfunction in cardiovascular disease: evidence for redox‑based therapies. Free Radic Biol Med. 2020; 157: 15‑37. | Crossref
SUPPLEMENTARY MATERIAL
ARTICLE INFORMATION