Predictors of 1-year progression of interstitial lung disease in patients with interstitial pneumonia with autoimmune features: a single-center, prospective study
Key words: bronchoalveolar lavage, INBUILD, interstitial pneumonia with autoimmune features, progression predictors, progressive pulmonary fibrosis

 CC BY 4.0
Predictors of 1-year progression of interstitial lung disease in patients with interstitial pneumonia with autoimmune features: a single-center, prospective study
Introduction: Interstitial pneumonia with autoimmune features (IPAF) describes a rare condition characterized by interstitial lung disease (ILD) with autoimmune manifestations in the absence of defined autoimmune rheumatic diseases (AIRDs). Although the classification was established in 2015, prospective data on the disease progression remain limited.
Objectives: Our aim was to identify predictors of ILD progression in IPAF patients using 3 criteria: 1) progressive pulmonary fibrosis (PPF); 2) INBUILD criteria; and 3) absolute forced vital capacity (FVC) decline by 10% or more. A secondary aim was to compare bronchoalveolar lavage fluid (BALF) cellular profiles in patients with IPAF and AIRD‑ILD and explore a prognostic value of these profiles.
Patients and methods: Between March 2021 and November 2022, a total of 69 patients were prospectively recruited: 31 with IPAF and 38 with AIRD‑ILD. Clinical, laboratory, radiological, pulmonary function, and BALF data were analyzed. Univariable and multivariable logistic regression were used to assess 1‑year progression predictors.
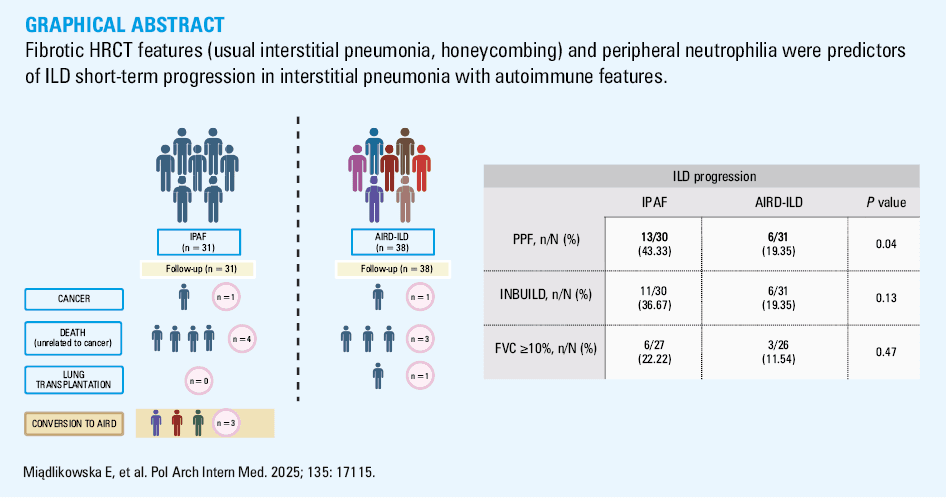
Results: Among the IPAF patients, 43.3% met the PPF criteria, 36.7% met the INBUILD criteria, and 22.2% showed FVC decline by 10% or more. PPF‑defined progression was more frequent in the IPAF than AIRD‑ILD individuals (43.3% vs 19.35%; P = 0.04). Progression predictors per the PPF criteria included elevated peripheral blood neutrophil count (odds ratio [OR], 1.89; 95% CI, 1.08–3.31; P = 0.03) and usual interstitial pneumonia pattern on high‑resolution computed tomography (HRCT; OR, 43.8; 95% CI, 1.52–126; P = 0.03). BALF lymphocyte count was not associated with progression (OR, 1.1; 95% CI, 0.99–1.22; P = 0.07). For the INBUILD criteria, the predictors were peripheral blood neutrophil count (OR, 2.06; 95% CI, 1.19–3.59; P = 0.01) and honeycombing (OR, 69.1; 95% CI, 2.16–2220; P = 0.02). Antinuclear antibody titer had no impact on IPAF progression.
Conclusions: Fibrotic features on HRCT (usual interstitial pneumonia, honeycombing) and peripheral neutrophilia were predictors of short‑term ILD progression in IPAF.
What's new?
Interstitial pneumonia with autoimmune features (IPAF) is a subtype of interstitial lung disease (ILD) with evidence of underlying autoimmunity that does not fulfill the criteria for defined rheumatic diseases. In this prospective study, we evaluated disease progression in IPAF using established progression criteria—including the INBUILD trial definition and the progressive pulmonary fibrosis criteria—demonstrating that 12‑month progression is common but varies depending on the definition applied. Key novel findings also include the identification of baseline peripheral blood neutrophilia and a radiological pattern as strong predictors of 12‑month disease progression. Additionally, we present the first comparative analysis of bronchoalveolar lavage fluid cellularity in IPAF and ILD with autoimmune manifestations in the absence of defined autoimmune rheumatic diseases. These insights contribute to a better understanding of IPAF and risk stratification, highlighting the need for closer monitoring in selected IPAF patients and providing a basis for future research.
Introduction
Although the term interstitial pneumonia with autoimmune features (IPAF) was introduced a decade ago to describe patients with interstitial lung disease (ILD) and signs of autoimmunity who do not meet the criteria for any of the defined autoimmune inflammatory rheumatic diseases (AIRDs),1 the knowledge about predictors of the disease progression remains limited.
The current literature is dominated by retrospective studies, mostly based on databases including data collected before the introduction of the IPAF criteria, and relying primarily on serological and morphological domains due to a lack of clinical data in historical medical records. These studies often focus on selected patient populations, such as those initially diagnosed with idiopathic pulmonary fibrosis (IPF). Prospective studies are frequently conducted by either pulmonology or rheumatology teams alone, introducing potential bias.2,3 Thus, many study cohorts fail to capture the full spectrum of the highly heterogeneous and rare IPAF disorder.4,5 Furthermore, due to the rarity of IPAF and the need for a close pulmonology–rheumatology specialist collaboration to ensure proper patient recruitment, available studies are mostly based on small cohorts.6,7
Moreover, as the IPAF classification criteria include only selected clinical features of AIRD and autoantibodies, many authors modify their study cohorts based on adjusted criteria. There is an ongoing debate about revising the criteria to improve the identification of patients at a risk of developing AIRD. The proposed additions include myalgia (with creatine kinase assessment), sicca syndrome (supported by the Schirmer test), and inflammatory markers (to objectify morning stiffness).7,8 Some authors propose including antineutrophil cytoplasmic antibodies or recurrent fever to capture a broader autoimmune spectrum.7,8 There is also a debate around the inclusion of patients with only autoantibodies and usual interstitial pneumonia (UIP) radiological pattern,9,10 and the potential exclusion of those with myositis‑specific antibodies.11 Although studies using the modified IPAF criteria provide valuable insights, they complicate cross‑cohort comparisons. An additional challenge is that the evolving AIRD criteria are expected to reshape the profile of IPAF patients over time.12
Current knowledge on the rate and risk factors of ILD progression in IPAF remains limited. The available evidence, primarily from retrospective studies assessing progression based on overall survival and a decline in forced vital capacity (FVC) by 5% or 10% and more over different time frames indicate that a prognosis in IPAF is better than in IPF but worse than in AIRD‑associated ILD.2,13-16 To date, there is a lack of studies validating current progression criteria, such as progressive pulmonary fibrosis (PPF) per the 2022 American Thoracic Society (ATS) / European Respiratory Society (ERS) / Japanese Respiratory Society (JRS) / Asociación Latinoamericana de Torax (ALAT) guidelines or progressive fibrosing ILD (PF‑ILD) as defined in the INBUILD trial (Efficacy and Safety of Nintedanib in Patients With Progressive Fibrosing Interstitial Lung Disease).17,18
In a number of articles, progression in IPAF is defined as the fulfilment of the AIRD criteria.4,10,19 However, considering the differences in clinical course between IPAF and AIRD‑ILD, this definition appears inadequate.2,16 In our study, we refer to such cases as “conversion” to AIRD.
To our knowledge, no studies have compared cellular profiles of bronchoalveolar lavage fluid (BALF) in IPAF and AIRD‑ILD patients. In addition, the potential prognostic value of BALF cytology in the context of ILD progression in IPAF remains unexplored.
These limitations highlight the need for prospective studies enrolling IPAF patients representing a broad clinical spectrum, recruited based on the original IPAF criteria, in centers with good pulmonology–rheumatology specialist collaboration, including understudied parameters such as BALF cytology.
The primary aim of this study was to evaluate the rate of the disease progression in patients with IPAF according to various definitions, and to identify predictors of short‑term progression. The secondary aim was to compare the BALF cellular profiles in the IPAF and AIRD‑ILD patients and to explore the potential prognostic significance of such profiles.
Patients and methods
Study design
Patients meeting the IPAF criteria, as defined by the ERS/ATS research statement,1 were recruited in this prospective, observational, single‑center study carried out in the Department of Pneumology, Medical University of Lodz, between March 2021 and November 2022. The control group recruited at the same time comprised patients with AIRD‑ILD. AIRD diagnosis was established according to the European Alliance of Associations for Rheumatology / American College of Rheumatology classification criteria.20-24 Exclusion criteria comprised age under 18 years, lack of informed consent, a history of malignancy at baseline, current respiratory tract infection or infection within the past 4 weeks, COVID‑19 during follow‑up, and incomplete relevant medical data.
Each patient was assessed by both a pulmonologist and a rheumatologist at baseline and after 12 months. At both time points, medical history and demographics were taken, and each patient underwent physical examination, spirometry, a 6‑minute walk test (6MWT), high‑resolution computed tomography (HRCT), and their transfer factor for carbon monoxide (TLCO) and laboratory test results were evaluated. In the IPAF group, the autoantibody panel was performed (antineutrophil antibody 2 [ANA2], ANA3 profile in all patients, myositis and scleroderma profiles if needed, based on a multidisciplinary team decision) at both time points to assess seroconversion. For the AIRD patients, baseline or historical autoantibody titers were considered. BALF analysis was based on current or historical results, provided they were obtained within the last 2 years. The duration from symptom onset was measured in years. Presenting symptoms included both respiratory and systemic manifestations, except for the Raynaud phenomenon. Dyspnea was assessed using the modified Medical Research Council scale. Gender‑age‑physiology (GAP) index and staging system were calculated.25
Data were collected on immunosuppressive therapy administered during follow‑up. For glucocorticosteroids, clinically relevant use was defined as oral prednisone at a dose of at least 5 mg daily for a minimum duration of 3 months or administration of intravenous pulse therapy.
This study was a part of a larger research project approved by the Ethics Committee of the Medical University of Lodz (RNN/43/21/KE). Written informed consent was obtained from all the enrolled patients.
Procedures
Spirometry and TLCO assessments were performed in accordance with the ERS and ATS recommendations using the Lungtest 1000 system (MES, Kraków, Poland).26,27 Pulmonary function test (PFT) results were reported as a percentage of predicted values (%pred), based on the Global Lung Function Initiative reference equations. The TLCO results were presented with a correction to hemoglobin concentration. The 6MWT was performed at both time points by the same person, following established guidelines.28,29 Bronchoscopy with BALF analysis was performed for diagnostic purposes according to the Polish Respiratory Society (PRS) recommendations.30 The site of lavage was selected based on HRCT analysis, targeting lung segments with the most pronounced interstitial involvement. BALF was processed manually by a trained investigator under sterile conditions to ensure sample integrity and reduce interoperator variability. Cellular analysis of BALF included total and differential cell counts, and was conducted promptly following collection.
HRCT scans were independently assessed and scored by 2 experienced pulmonologists and ILD experts (WP and EM). The quantitative analysis (%ILD) was conducted following the recommendations of the PRS experts.31 Radiological patterns were classified following the ATS/ERS guidelines.17,32
Assessment of interstitial lung disease progression
Progression was determined using 3 distinct criteria: PPF following the 2022 ATS/ERS/JRS/ALAT guidelines, PF‑ILD based on the INBUILD criteria, and absolute FVC decline by at least 10%.17,18 Each criterion was assessed separately. Death due to respiratory failure or lung transplantation was considered as disease progression. The patients who developed malignancy during follow‑up were excluded from the analysis. To ensure consistency of the follow‑up observations, a uniform 12‑month period was applied to each definition.
Statistical analysis
Continuous variables with a normal distribution, as verified by the Shapiro–Wilk test, were presented as means with SD. Variables not normally distributed were reported as medians with interquartile ranges. Continuous variables were compared between 2 independent groups using the t test or the Mann–Whitney test, depending on the distribution. Categorical variables were compared using the χ2 test or Fisher exact test, based on the distribution of expected frequencies. ANA titers were treated as a categorical variable and classified into 3 groups: 1) titers below 1:100, 2) titers between 1:100 and 1:320, and 3) titers above 1:320.
A univariable analysis was performed initially, and the results were reported as odds ratios (ORs) with corresponding 95% CIs. A multivariable logistic regression analysis utilizing backward‑forward stepwise selection was subsequently conducted to determine independent predictors, with results also reported as OR with 95% CI. The predictive ability and model accuracy were assessed by constructing a receiver operating characteristic (ROC) curve and calculating the area under the ROC curve (AUC).
A 2‑tailed P value below 0.05 was considered significant. All analyses were performed using Statistica 13.3 package (Polish version; StatSoft Polska, Kraków, Poland).
Results
Patient characteristics
A total of 69 white patients were recruited, including 31 with IPAF and 38 with AIRD‑ILD. The AIRD‑ILD group comprised patients with systemic sclerosis (SSc; n = 18), rheumatoid arthritis (RA; n = 5), idiopathic inflammatory myopathies (IIMs; n = 5), systemic lupus erythematosus (n = 2), Sjögren syndrome (SS; n = 1), and overlapping AIRDs (n = 7): RA‑SS (n = 2), SSc‑IIM (n = 2), SSc‑RA (n = 1), SS‑mixed connective tissue disease (n = 1), and RA‑IIM (n = 1).
The demographic and clinical characteristics of the participants are presented in detail in Table 1. The results of the qualitative HRCT analysis are provided in Supplementary material, Table S1.
Variable | IPAF (n = 31) | AIRD‑ILD (n =38) | P value |
Data are presented as median (interquartile range) or mean (SD) for continuous variables and number (percentage) for categorical variables.
a Cumulative exposure ≥5 pack‑years
Abbreviations: 6MWT, 6‑minute walk test; AIRD‑ILD, autoimmune inflammatory rheumatic disease–associated interstitial lung disease; BMI, body mass index; FEV1, forced expiratory volume in 1 second; FVC, forced vital capacity; GAP, gender, age, physiology; ILD, interstitial lung disease; IPAF, interstitial pneumonia with autoimmune features; NSIP, nonspecific interstitial pneumonia; TLCO, lung transfer factor for carbon monoxide adjusted for hemoglobin; UIP, usual interstitial pneumonia | |||
Women | 23 (74.19) | 29 (78.38) | 0.69 |
Age, y | 61 (52–69) | 61 (51–66) | 0.67 |
BMI, kg/m2 | 27.57 (4.9) | 25.35 (4.58) | 0.06 |
Obesity | 9 (29.03) | 6 (15.79) | 0.18 |
Past smokersa | 12 (41.38) | 10 (30.3) | 0.36 |
Current smokers | 3 (9.7) | 2 (5.3) | 0.65 |
Time from symptom onset, y | 3.5 (0.5–5) | 7.5 (2–13) | <0.001 |
Arterial hypertension | 16 (53.33) | 12 (33.33) | 0.1 |
Diabetes mellitus | 5 (16.67) | 5 (13.89) | 0.75 |
Chronic kidney disease | 1 (3.2) | 2 (5.3) | >0.99 |
GAP stage | |||
I | 23 (74) | 26 (74) | 0.74 |
II | 6 (19) | 3 (9) | |
III | 2 (6) | 6 (17) | |
GAP index | 2 (1–4) | 2 (1–3.5) | 0.99 |
Pulmonary function tests | |||
FEV1, % | 73.07 (19.77) | 67.7 (21.62) | 0.3 |
FVC, % | 73.38 (23.27) | 66.89 (19.18) | 0.22 |
TLCO,% | 60 (52–77) | 68 (55–77) | 0.33 |
6MWT, m | 415.76 (123.68) | 399.74 (116.65) | 0.62 |
Peripheral blood parameters | |||
Neutrophil count, G/l | 5 (3.8–7.4) | 5 (3.9–6.8) | 0.98 |
Lymphocyte count, G/l | 1.9 (1.2–2.5) | 1.4 (1.1–1.9) | 0.07 |
Neutrophil / lymphocyte ratio | 2.75 (1.94–4.91) | 3.33 (2.78–5.5) | 0.15 |
Bronchoalveolar lavage fluid cellularity | |||
Number of samples | 30 | 20 | – |
Total cell count, G/l | 28.4 (11.3–41.8) | 30.3 (24.9–44.5) | 0.16 |
Neutrophils, % | 4 (2–6) | 3.7 (1.3–8.7) | 0.83 |
Macrophages, % | 80.3 (62–87.7) | 73.3 (54–83) | 0.35 |
Lymphocytes, % | 10.7 (8.7–30) | 13 (7.7–28.7) | 0.71 |
Eosinophils, % | 0.85 (0.7–3.35) | 2.3 (1.3–4.7) | 0.11 |
Monocytes, % | 0 (0–0.15) | 0 | 0.59 |
Basophils, % | 0 (0–0.5) | 0 | 0.79 |
High‑resolution computed tomography | |||
Pattern | NSIP 13/30 (43.3); UIP 7/30 (23.3) | NSIP 15/37 (40.54); UIP 13/37 (35.14) | 0.53 |
ILD% | 31.89 (19.33–50.83) | 26.78 (20.78–47.86) | 0.82 |
There were no significant differences in PFTs or peripheral blood neutrophil cell counts in the IPAF and AIRD‑ILD groups. In the BALF analysis, numerically higher total cell count and eosinophil count were observed in the patients with AIRD‑ILD than those with IPAF. However, these differences did not reach significance (Table 1).
Results of the annual follow‑up analysis
During 1‑year follow‑up, 4 patients from the IPAF group and 3 from the AIRD‑ILD group died from nonmalignant causes. In the IPAF group, all patients died due to respiratory failure. In the AIRD‑ILD group, 1 patient died from respiratory failure, 1 from gastrointestinal complications of SSc, and the cause of death of the other patient remains unknown.
One patient in each group developed malignancy (IPAF, pancreatic cancer; AIRD‑ILD, lung cancer), and they were excluded from further analysis. Three IPAF patients progressed to a defined AIRD: 1 developed SS, 1 SSc, and 1 IIM (Figure 1). All developed new clinical symptoms without seroconversion.
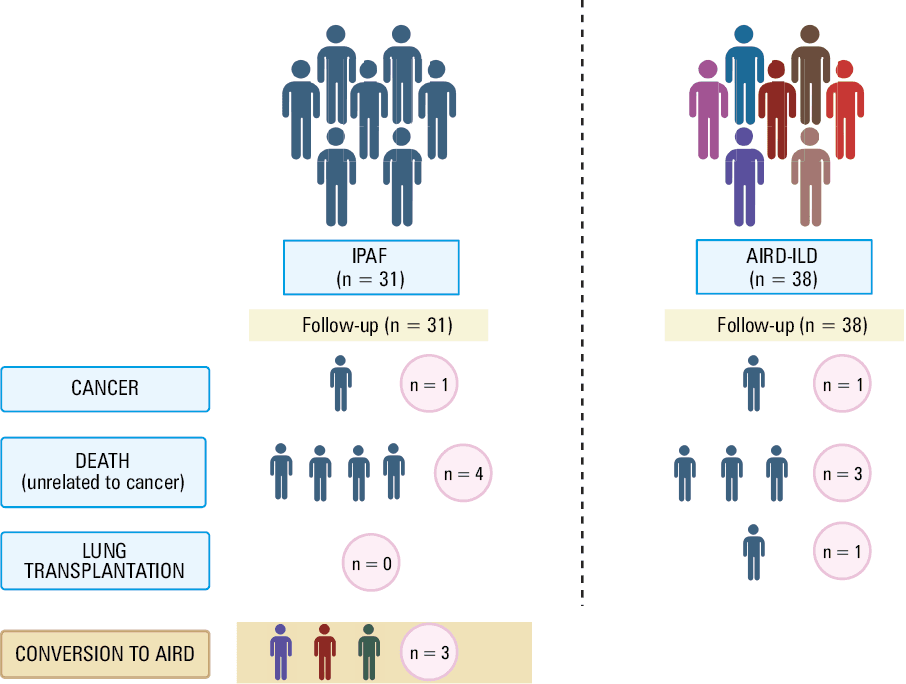
Eight IPAF patients did not receive immunosuppressive therapy during follow‑up, while 23 were treated with various combinations of immunosuppressive drugs (glucocorticosteroids, azathioprine, mycophenolate mofetil, tocilizumab). All patients with AIRD‑ILD were treated with immunosuppressants. Two IPAF patients received nintedanib.
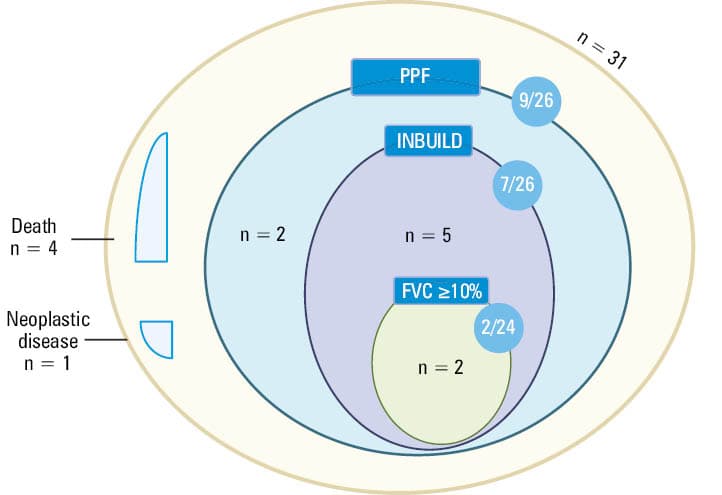
In the IPAF group, 13 out of 30 patients (43.3%) fulfilled at least 1 definition of ILD progression or died due to respiratory failure (excluding 1 patient who was removed from the analysis due to malignancy during follow‑up). Figure 2 presents the analysis of IPAF patients regarding disease progression based on different definitions (INBUILD, PPF, FVC decline ≥10% + deaths). A detailed characterization of individual patients with IPAF, including follow‑up outcomes, is provided in Supplementary material, Table S2, while Table S3 summarizes baseline pulmonary function parameters (FVC% and TLCO%) in the patients classified as progressors and nonprogressors.
Abbreviations: see Table 1
Regardless of the adopted definition, numerically more patients in the IPAF than AIRD‑ILD group developed disease progression. However, this difference was significant only according to the PPF criteria (Table 2).
Criterion | IPAF | AIRD‑ILD | P value |
Data are presented as number of participants meeting the criteria / number of all participants and percentage.
a As per the American Thoracic Society / European Respiratory Society / Japanese Respiratory Society (JRS) / Asociación Latinoamericana de Torax guidelines
| |||
PPFa | 13/30 (43.33) | 6/31 (19.35) | 0.04 |
INBUILD | 11/30 (36.67) | 6/31 (19.35) | 0.13 |
FVC ≥10% | 6/27 (22.22) | 3/26 (11.54) | 0.47 |
Determinants of interstitial lung disease progression in patients with interstitial pneumonia with autoimmune features
The only analyzed nonparametric clinical characteristic differentiating the IPAF patients who progressed from those who did not (according to the INBUILD and PPF criteria) was the presence of honeycombing on the baseline HRCT scan (Table 3).
Parameter | Progression definition | Progressors | Nonprogressors | P valuea |
Data are presented as number of participants meeting the criteria / number of all participants and percentage.
a The χ2 test was used for categorical variables; for variables with expected cell counts <5, the Fisher exact test was applied. For the Fisher exact test, only P values are reported.
b Immunosuppressive therapy use was defined as treatment during follow‑up with glucocorticosteroids, azathioprine, mycophenolate mofetil and / or tocilizumab. For glucocorticosteroids, clinically relevant use was defined as oral prednisone at a dose of at least 5 mg daily for a minimum of 3 months, or intravenous pulse therapy
Abbreviations: ANA, antinuclear antibody; mMRC, modified Medical Research Council scale; others, see Table 2 | ||||
Men | INBUILD | 2/11 (18) | 6/19 (32) | 0.67 |
PPF | 3/13 (23) | 5/17 (29) | >0.99 | |
FVC decline ≥10% | 0/6 (0) | 7/21 (33) | 0.1 | |
mMRC baseline | INBUILD | 0, 0/11 (0); 1, 1/11 (9); 2, 5/11 (45); 3, 3/11 (27); 4, 2/11 (18) | 0, 2/16 (13); 1, 7/16 (44); 2, 4/16 (2); 3, 1/16 (6); 4, 2/16 (13) | 0.14 |
PPF | 0, 0/13 (0); 1, 3/13 (23); 2, 5/13 (38); 3, 3/13 (23); 4, 2/13 (15) | 0, 2/14 (14); 1, 5/14 (36); 2, 4/14 (29); 3, 1/14 (7); 4, 2/14 (14) | 0.47 | |
FVC decline ≥10% | 0, 0/6 (0); 1, 0/6 (0); 2, 2/6 (33); 3, 2/6 (33); 4, 2/6 (33) | 0, 2/18 (11); 1, 8/18 (44); 2, 6/18 (33); 3, 1/18 (6); 4, 1/18 (6) | 0.06 | |
Immunosuppressive therapy useb | INBUILD | 10/11 (91) | 12/19 (63) | 0.2 |
PPF | 11/13 (85) | 11/17 (65) | 0.41 | |
FVC decline ≥10% | 6/6 (100) | 13/21 (62) | 0.14 | |
Antibodies | ||||
ANA | INBUILD | <1:100, 1/9 (11); 1:100–1:320, 7/9 (78); >1:320: 1/9 (11) | <1:100, 4/18 (22); 1:100–1:320, 12/18 (67); >1:320: 2/18 (11) | 0.78 |
PPF | <1:100, 1/11 (9); 1:100–1:320, 9/11 (82); >1:320, 1/11 (9) | <1:100, 4/16 (25); 1:100–1:320, 10/16 (63); >1:320, 2/16 (13) | 0.52 | |
FVC decline ≥10% | <1:100, 1/4 (25); 1:100–1:320, 2/4 (50); >1:320, 1/4 (25) | <1:100, 3/20 (15); 1:100–1:320, 16/20 (80); >1:320, 1/20 (5) | 0.33 | |
High‑resolution computed tomography | ||||
Usual interstitial pneumonia | INBUILD | 4/11 (36) | 3/18 (17) | 0.22 |
PPF | 5/13 (38) | 2/16 (13) | 0.19 | |
FVC decline ≥10% | 1/6 (17) | 6/20 (30) | >0.99 | |
Honeycombing | INBUILD | 5/11 (45) | 1/18 (6) | 0.02 |
PPF | 6/13 (46) | 0/13 (0) | 0.003 | |
FVC decline ≥10% | 2/6 (33) | 4/20 (20) | 0.6 | |
Ground glass opacities | INBUILD | 7/11 (64) | 12/18 (67) | >0.99 |
PPF | 7/13 (54) | 12/16 (75) | 0.27 | |
FVC decline ≥10% | 5/6 (83) | 12/20 (60) | 0.38 | |
Comorbidities | ||||
Arterial hypertension | INBUILD | 8/11 (73) | 7/18 (39) | 0.13 |
PPF | 9/13 (69) | 6/16 (38) | 0.13 | |
FVC decline ≥10% | 4/6 (67) | 8/20 (40) | 0.37 | |
Diabetes | INBUILD | 3/11 (27) | 2/18 (11) | 0.34 |
PPF | 3/13 (23) | 2/16 (13) | 0.63 | |
FVC decline ≥10% | 1/6 (17) | 3/20 (15) | >0.99 | |
History of smoking | INBUILD | 4/10 (40) | 8/18 (44) | >0.99 |
PPF | 6/12 (50) | 6/16 (38) | 0.51 | |
FVC decline ≥10% | 2/5 (40) | 9/21 (43) | >0.99 | |
The univariable logistic regression analyses were performed to assess the potential baseline predictors of disease progression according to 3 different definitions. A higher baseline FVC% was associated with a lower likelihood of progression defined by both the INBUILD criteria (OR, 0.95; 95% CI, 0.9–0.996; P = 0.04) and FVC decline by at least 10% (OR, 0.94; 95% CI, 0.89–0.998; P = 0.04). In addition, a higher neutrophil count in peripheral blood was associated with progression according to the INBUILD criteria (OR, 1.69; 95% CI, 1.13–2.51; P = 0.01) and FVC decline by at least 10% (OR, 4.21; 95% CI, 1.09–16.27; P = 0.04; Table 4).
Parameter | INBUILD | PPF | FVC decline ≥10% | |||
OR (95% CI) | P value | OR (95% CI) | P value | OR (95% CI) | P value | |
Baseline | ||||||
Age | 1.04 (0.98–1.11) | 0.23 | 1.07 (0.99–1.15) | 0.07 | 1.04 (0.96–1.13) | 0.32 |
FVC, % | 0.95 (0.9–0.996) | 0.04 | 0.98 (0.94–1.01) | 0.2 | 0.94 (0.89–0.998) | 0.04 |
TLCO, % | 0.95 (0.91–1.01) | 0.08 | 0.98 (0.95–1.02) | 0.28 | 0.95 (0.88–1.02) | 0.16 |
6MWT, m | 0.996 (0.99–1) | 0.28 | 0.99 (0.99–1) | 0.1 | 0.99 (0.97–1) | 0.06 |
Bronchoalveolar lavage fluid cellularity | ||||||
Total cell count | 0.99 (0.95–1.03) | 0.55 | 1.01 (0.97–1.06) | 0.49 | 0.98 (0.92–1.03) | 0.41 |
Lymphocytes, % | 1 (0.96–1.05) | 0.79 | 1.02 (0.97–1.07) | 0.38 | 1.01 (0.06–1.06) | 0.74 |
Eosinophils, % | 1.03 (0.92–1.16) | 0.58 | 1.02 (0.91–1.14) | 0.72 | 0.74 (0.34–1.61) | 0.45 |
Peripheral blood parameters | ||||||
Neutrophils, G/l | 1.69 (1.13–2.51) | 0.01 | 1.34 (0.98–1.83) | 0.06 | 4.21 (1.09–16.27) | 0.04 |
Lymphocytes, G/l | 1.86 (0.63–5.54) | 0.26 | 1.14 (0.42–3.11) | 0.79 | 0.91 (0.28–3) | 0.88 |
High‑resolution computed tomography | ||||||
Fibrosis baseline, % | 8.18 (0.2–341.95) | 0.27 | 5.47 (0.15–206.82) | 0.36 | 234.69 (0.82–66 966.08) | 0.06 |
In the multivariable logistic regression analysis, higher neutrophil count was identified as an important predictor of disease progression according to the INBUILD criteria (OR, 2.06; 95% CI, 1.19–3.59; P = 0.01), indicating that each additional unit increase in neutrophil count doubled the likelihood of progression. Furthermore, the presence of honeycombing on HRCT, a hallmark radiological feature, strongly predicted the progression of IPAF using the INBUILD criteria (OR, 69.1; 95% CI, 2.16–2220; P = 0.02). Despite the broad 95% CI suggesting variability due to limited events, the presence of honeycombing emerges as a particularly critical predictor. The logistic regression model demonstrated excellent discriminative capacity with an AUC of 0.91 (95% CI, 0.72–1), underscoring its robust predictive utility (Table 5).
For progression according to the PPF criteria, higher neutrophil count remained a solid predictor (OR, 1.89; 95% CI, 1.08–3.31; P = 0.03), indicating a substantial increase in the risk with rising neutrophil levels. Additionally, the UIP pattern on HRCT strongly predicted disease progression (OR, 43.8; 95% CI, 1.52–1260; P = 0.03). The number of lymphocytes in BALF did not reach significance (OR, 1.1; 95% CI, 0.99–1.22; P = 0.07). This logistic regression model also demonstrated a strong discriminative capability, with the AUC of 0.87 (95% CI, 0.732–1; Table 5).
Due to the limited number of patients meeting the criterion of FVC decline by at least 10%, the multivariable logistic regression analysis was not performed in this category.
Discussion
This study showed a substantial 1‑year disease progression rate in patients with IPAF, ranging from 22% to 43%, depending on the criteria applied (PPF, INBUILD, or ≥10% FVC decline). Independent predictors of progression included radiological features such as honeycombing and the UIP pattern, as well as elevated peripheral blood neutrophil counts.
The IPAF patient cohort mirrors the characteristics reported in previous studies, particularly regarding age, sex, and smoking history. Baseline PFT results are comparable to those observed in other IPAF populations,5,33-35 with the exception of mainly retrospective studies based on reclassification of patients initially diagnosed with IPF, which predominantly included older men with a history of smoking.2 Although IPAF patients showed a numerically higher progression rate than those with AIRD‑ILD, the difference reached significance only when assessed using the PPF criteria, likely due to a limited sample size. This finding is consistent with existing literature reporting a poorer prognosis in IPAF than AIRD‑ILD.2,16
Previous studies, especially retrospective analyses, assessed overall survival in IPAF or defined disease progression as a decline in FVC of at least 5% or 10%. Reported progression rates range from 19% to 54.5%,5,8,34-37 depending on the study design, follow‑up duration, and baseline patient characteristics (Table 6). Importantly, some evidence suggests that the progression occurs more frequently during the first years of the disease.5 In our cohort, an absolute FVC decline of at least 10% or death due to respiratory failure was observed in 22% of the patients, which is consistent with these findings.
Study | Definition of progression | Type of study and number of participants | Progression rate, % | Follow‑up |
Abbreviations: HRCT, high‑resolution computed tomography; IQR, interquartile range; others, see Table 1 | ||||
Joerns et al36 | Relative decline in FVC ≥10% | Retrospective; n = 191 | 54.5 | Mean (SD), 2.2 (2) y |
Sebastiani et al37 | Decline in FVC ≥10% | Prospective; n = 52 | 34.4; 87 | •The first 12 months
•At the end of follow‑up (mean, 44.5 months) |
Joerns et al34 | Relative decline in FVC ≥10%, death or lung transplantation | Retrospective; n = 63 | 19.05 | 12 months after immunosuppression initiation |
Nieto et al5 | Relative decline in FVC ≥5% every 6 months | Retrospective from 2007 to 2017, prospective since 2017; n = 79 | 50 | 16 months from a diagnosis |
Bozzao et al8 | Absolute decline in FVC ≥5% or in TLCO of 10% predicted | Retrospective; n = 35 | 26.5 | Median (IQR), 33 (16.5–69.5) months |
Nagy et al50 | FVC relative yearly decline ≥5% and either deterioration of clinical symptoms or progression of fibrosis on HRCT | Retrospective; n = 25 | 32 | 24 months |
Karampeli et al35 | Clinically significant deterioration (no precise definition) | Prospective; n = 39 | 20.5 | 1 year from baseline |
However, it is important to note that assessing progression based solely on PFTs, particularly a decline in FVC by at least 5%, may lead to biased results. In patients with higher baseline FVC, a decline is more easily reached, as the same absolute volume loss represents a smaller proportion of total lung capacity than in those with lower baseline values.17,38 Moreover, patients with the most clinically relevant deterioration—those unable to perform spirometry due to advanced disease—are often excluded from analysis due to missing data.
To the best of our knowledge, this is the first study to validate the lung fibrosis progression criteria introduced in 2020 and 2022 in patients with IPAF.17,18 Although both the PPF and INBUILD criteria have been criticized by some experts due to the arbitrarily defined assessment periods (1 or 2 years), the subjectivity of quantitative ILD evaluation on HRCT, and the influence of nonfibrotic factors on FVC variability, which may lead to overdiagnosis of ILD progression,39,40 their application appears justified in this context, based on the considerations outlined in the preceding paragraph.
To date, as far as we are aware, only a single study (multicenter, prospective) assessed ILD progression in IPAF patients using the PPF criteria. It reported that the IPAF patients were numerically less likely to meet the progression criteria than those with other forms of idiopathic interstitial pneumonia (8.3% vs 20.8%; p = 0.114). Although median follow‑up in the entire cohort was 36 months, the difference in group size (IPAF, n = 26 vs non‑IPAF, n = 196) makes it important to report the follow‑up duration specifically for the IPAF group; however, these data are not available.41
Identifying predictors of poor prognosis is crucial for stratifying the risk within this highly heterogeneous patient population and guiding closer monitoring by a multidisciplinary team. A meta‑analysis of 12 retrospective studies identified age as the only independent predictor of all‑cause mortality in IPAF.42 Other factors, such as male sex, smoking history, reduced FVC and TLCO, and the UIP radiological pattern, showed potential prognostic relevance but did not reach significance.
Data on predictors of disease progression in IPAF remain scarce. Many studies, likely due to small sample sizes and cohort heterogeneity, failed to identify progression markers.34,35 An Australian retrospective study33 assessed progression‑free survival, defined as the time to disease progression (decline in FVC ≥10% and / or TLCO ≥15%), death, or lung transplantation. In the patients with IPAF, longer disease duration and the presence of pulmonary hypertension were identified as significant predictors. Our findings regarding the impact of radiological patterns on the progression in IPAF align with those reported in a multicenter Spanish study, which found that patients with the UIP pattern had a poorer prognosis.5
To our knowledge, to date, only 1 study evaluated BALF cellular composition in relation to disease progression in IPAF. No studies addressed all blood count parameters in this context. Zhang et al43 reported that a higher lymphocyte percentage in BALF was associated with a lower likelihood of developing a progressive fibrosing phenotype. An increased proportion of BALF lymphocytes is considered a favorable prognostic marker in ILD, especially in predicting response to immunosuppressive therapy.44,45 Research in other ILDs, particularly AIRD‑ILD, suggests that elevated neutrophil counts in peripheral blood and a higher neutrophil‑to‑lymphocyte ratio are associated with worse outcomes.46,47
In our study, the patients with AIRD‑ILD had numerically higher total cell count and eosinophil count in BALF than those with IPAF (Table 1). Yet, this difference did not reach significance, likely due to the limited sample size. Another study in a larger cohort, presented by our group at the 2023 ERS Congress,48 demonstrated a significant difference in these parameters, suggesting a more pronounced inflammatory process in the airways of patients with AIRD‑ILD.
During 12‑month follow‑up, 3 patients converted to a defined AIRD (11.5% of those who completed 1 year of follow‑up and did not develop malignancy), which is consistent with data reported in the literature.7,19,37
It is highly important to note that the history of malignancy was an exclusion criterion in our cohort, based on the fact that cancer may induce autoantibodies or rheumatic symptoms unrelated to AIRD.49 In contrast, other studies included such patients (eg, the NEREA registry [Pneumology Rheumatology Autoimmune Disease] with 9.5% of IPAF cases)5, increasing the cohort heterogeneity. This may partially explain discrepancies in outcomes, as only 3.2% of the IPAF patients in our cohort developed malignancy during follow‑up (vs 18.9% according to Bozzao et al8).
Strengths and limitations
The strengths of this study include its prospective design and the setting—a center with recognized expertise in ILD care (a member of the ERN‑LUNG network for rare diseases). The study was designed and conducted by an interdisciplinary team of pulmonologists and rheumatologists, reducing the risk of misclassifying patients with subclinical AIRD as IPAF. The inclusion of consecutive patients meeting the IPAF criteria minimized the selection bias. This study has several limitations that should be acknowledged. First, although it is one of the few prospective studies investigating IPAF, the overall sample size remains limited due to the rarity of the disease. As a result, the statistical power, particularly in the subgroup analyses and multivariable models, may be insufficient to detect modest effect sizes or weaker associations. However, this limitation reflects the rarity of IPAF as an orphan condition. Comparable sample sizes were reported in other studies, including some multicenter and retrospective analyses conducted over longer periods.8,33,35,41 Second, BALF was not available for all participants, especially within the AIRD‑ILD group, which could introduce a selection bias and limit generalizability of the findings regarding BALF cytology. Third, the relatively short follow‑up period of 12 months may not capture longer‑term disease trajectories, particularly in patients with initially stable disease. Fourth, radiological assessments were conducted by 2 experienced pulmonologists but not formally adjudicated by thoracic radiologists, which may have affected the classification of HRCT patterns, such as UIP or nonspecific interstitial pneumonia. Quantitative HRCT scoring, although based on expert guidelines, remains a subjective method with potential inter‑reader variability. Fifth, specific treatment regimens were not analyzed due to the limited cohort size and heterogeneity of therapies. We consider such an analysis potentially biased. Future multicenter studies with longer follow‑up periods, larger cohorts, and standardized therapeutic approaches are needed to confirm and expand upon these findings.
Conclusions
This prospective study confirms that disease progression in patients with IPAF is common within the first year of follow‑up and varies depending on the applied definition. Baseline peripheral blood neutrophil count and fibrotic HRCT features (UIP, honeycombing) were identified as predictors of short‑term progression, highlighting their potential value in early risk stratification. In the comparison of BALF cellular profiles, no significant differences were observed between the IPAF and AIRD‑ILD patients. Together, these findings support the need for individualized monitoring strategies in IPAF, incorporating PFTs, blood biomarkers, and imaging features. Importantly, the variability in progression rates across current definitions highlights a key limitation in applying existing classification systems, originally developed for broader fibrosing ILDs, to IPAF.
- Fischer A, Antoniou KM, Brown KK, et al. An official European Respiratory Society / American Thoracic Society research statement: interstitial pneumonia with autoimmune features. Eur Respir J. 2015; 46: 976‑987. | Crossref
- Oldham JM, Adegunsoye A, Valenzi E, et al. Characterisation of patients with interstitial pneumonia with autoimmune features. Eur Respir J. 2016; 47: 1767‑1775. | Crossref
- Ito Y, Arita M, Kumagai S, et al. Serological and morphological prognostic factors in patients with interstitial pneumonia with autoimmune features. BMC Pulm Med. 2017; 17: 111. | Crossref
- Sambataro G, Sambataro D, Spicuzza L, et al. Progression and prognosis of interstitial pneumonia with autoimmune features: a longitudinal, prospective, multi‑centre study. Clin Exp Rheumatol. 2023; 41: 1140‑1148. | Crossref
- Nieto MA, Sanchez‑Pernaute O, Vadillo C, et al. Functional respiratory impairment and related factors in patients with interstitial pneumonia with autoimmune features (IPAF): multicenter study from NEREA registry. Respiratory Research. 2023; 24: 19. | Crossref
SUPPLEMENTARY MATERIAL
ARTICLE INFORMATION