Prevalence of metabolic syndrome in a Polish population-based study: a comparison of previous and updated diagnostic criteria
Key words: cardiovascular-kidney-metabolic syndrome, cardiovascular risk, metabolic syndrome

 CC BY 4.0
Prevalence of metabolic syndrome in a Polish population-based study: a comparison of previous and updated diagnostic criteria
Introduction: Metabolic syndrome (MetS) is a growing global health concern characterized by adiposity, elevated blood pressure, and lipid and glucose metabolism abnormalities, which synergistically increase cardiovascular risk. The newly introduced concept of cardiovascular‑kidney‑metabolic (CKM) syndrome aims to capture the continuum of metabolic dysfunction and its direct link with cardiovascular risk.
Objectives: Our aim was to assess the prevalence of MetS and CKM, compare traditional and updated MetS definitions, examine their diagnostic concordance, and explore their associations with cardiovascular risk.
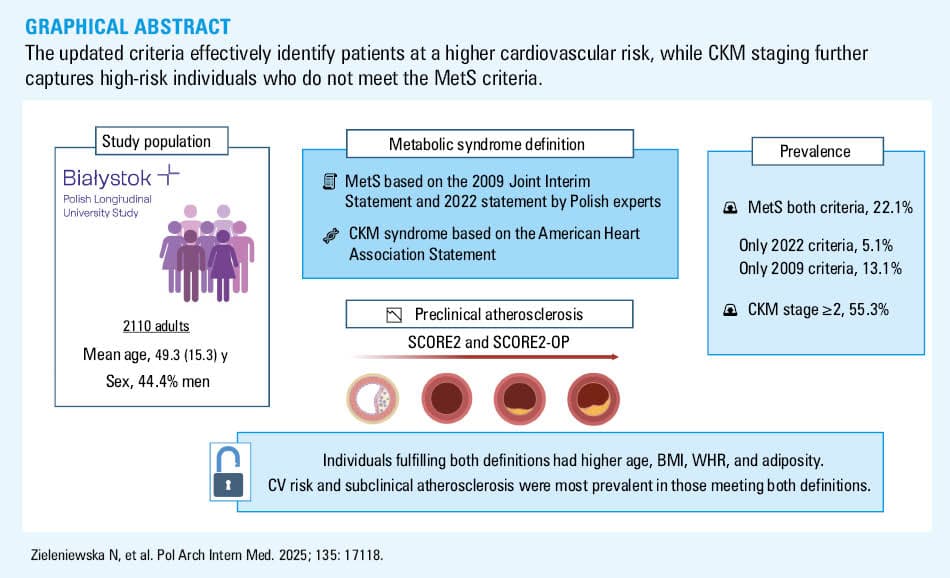
Patients and methods: We analyzed 2110 adults (mean [SD] age, 49.3 [15.3] y; 44.4% men) from the population‑based Białystok PLUS cohort. MetS was defined using the 2009 and the 2022 updated criteria. CKM staging was applied, and cardiovascular risk was estimated using the Systemic Coronary Risk Estimation 2 (SCORE2) and SCORE2‑Older Persons scales. Anthropometric, biochemical, and imaging data were assessed. Receiver operating characteristics analyses were performed to evaluate diagnostic utility of the applied criteria.
Results: MetS was diagnosed in 22.1% of the participants using both definitions; 5.1% met only the 2022 and 13.1% only the 2009 criteria. The individuals meeting both definitions were older, had higher body mass index (BMI), and greater adiposity. BMI (area under the curve [AUC] = 0.941; 95% CI, 0.931–0.951) and waist circumference (AUC = 0.912; 95% CI, 0.9–0.924) showed the highest diagnostic accuracy under the 2022 criteria. Cardiovascular risk and subclinical atherosclerosis were most prevalent in the patients meeting both definitions. CKM stage 2 or higher was found in 55.3% of the participants, with increasing prevalence of higher cardiovascular risk observed across stages.
Conclusions: MetS and CKM are highly prevalent, yet their diagnostic overlap is limited. CKM staging captures high‑risk individuals beyond the MetS criteria, underscoring its broader utility for integrated cardiometabolic risk assessment.
What's new?
This study provides novel insights into the prevalence of metabolic syndrome within the population of a medium‑sized city, based on data from 2110 participants enrolled in a cohort study. The analysis compares prevalence estimates derived from the 2009 international diagnostic criteria and the updated 2022 consensus of Polish experts. Importantly, this is the first study to incorporate the recently proposed definition of cardiovascular‑kidney‑metabolic syndrome, allowing for an estimation of the prevalence across its distinct stages. Furthermore, we examined the distribution of cardiovascular risk categories associated with each definition, offering a comprehensive perspective on the cardiometabolic burden in this population.
Introduction
Metabolic syndrome (MetS) is a cluster of risk factors for atherosclerotic cardiovascular disease (ASCVD) and type 2 diabetes associated with adiposity‑related metabolic changes.1 However, its definition evolved, and over the past decades, various organizations have proposed different diagnostic criteria. Obesity, a key component, has tripled in prevalence, contributing significantly to global morbidity and mortality.2-5 Even with adequate physical activity, obese individuals remain at an increased cardiovascular risk.6 Elevated body weight causes mechanical problems, thereby increasing the risk of osteoarthritis or sleep apnea, and decreases physical ability.7 The disease further affects quality of life and general well‑being, and thus increases the risk of depression.8
Cardiorenal syndrome describes the bidirectional dysfunction between the heart and kidneys,9 while cardiometabolic disease highlights the impact of excess adipose tissue on systemic inflammation, insulin resistance, and cardiovascular risk.10 Although these syndromes have been well characterized, there is a growing recognition that metabolic disturbances play a central pathophysiological role in the interplay between the cardiovascular and renal systems.11 The emerging concept of cardiovascular‑kidney‑metabolic syndrome (CKM) integrates obesity, diabetes, chronic kidney disease (CKD), and CVD into a unified framework.11,12 CKM staging systems aim to improve the disease management and prevention. Recently, researchers have proposed a CKM staging system12 to better understand the disease progression and support more effective prevention and treatment.
The aim of our study was to assess the prevalence of MetS according to both previous (2009) and new (2022) definitions,13,14 compare it with CKM prevalence, and evaluate which criteria better identify patients at the highest cardiovascular risk. MetS was assessed in accordance with the international 2009 Joint Interim Statement guidelines endorsed by the American Heart Association (AHA) and the International Diabetes Federation,13 and new guidelines proposed by Polish experts in 2022.14 The growing recognition of the pathophysiological link between metabolic risk factors, CKD, and ASCVD has led to the conceptualization of CKM syndrome, and we therefore decided to also include this definition in our analysis.15 Our critical focus was the examination of differences between the MetS definitions. Importantly, the 2009 definition does not include obesity as a mandatory criterion, whereas the 2022 definition explicitly includes obesity as an essential component. In contrary, the CKM definition expands the concept by permitting the diagnosis of MetS even in individuals who are not overweight. Considering these 3 distinct definitions adds robustness to our analysis.
Patients and methods
Study population
This study is a part of the Białystok PLUS longitudinal general population‑based study from Poland that has been ongoing since 2018. Details of the study were described previously by Chlabicz et al.16 Briefly, citizens aged 20–79 years were randomly selected from the population of a mid‑sized (approximately 300 000 inhabitants) central European city (Bialystok, Poland) in such proportions as to obtain a distribution reflecting the city’s population. There are no exclusion criteria; however, the visits were delayed when a participant had a recent (up to 6 weeks) infection or medical procedure, and some tests have not been performed in pregnant women or in certain subpopulations, for example, oral glucose tolerance test (OGTT) in patients with diabetes.16 Our analysis included 2110 participants enrolled in the Białystok PLUS cohort study in the years 2017–2023.
Data collection
The data were collected through an analysis of medical interviews as well as laboratory and screening tests. The details, including patient medical history and lifestyle, were acquired through extensive questionnaires. Physical measurements of height and waist and hip circumference were taken with a SECA 201 tape (SECA, Hamburg, Germany). Waist‑to‑hip ratio (WHR) was defined as the relation between hip and waist circumference. Weight measurement was performed with a bioimpedance device InBody 770 (InBody, Eschborn, Germany). The World Health Organization guidelines17 were used to classify the population into body mass index (BMI) categories (Supplementary material, Table S1). Blood pressure (BP) measurements were taken with the oscillometric method applied by Omron Healthcare Co., Ltd, MG Comfort (Omron Healthcare Co., Ltd., Kyoto, Japan) after 5 minutes of rest. Percentage body mass composition was assessed using InBody 770 and Dual‑energy X‑ray absorptiometry (DEXA; Lunar iDXA, GE Healthcare, Fairfield, Connecticut, United States). The presence of any atherosclerotic plaques was evaluated in the 1) right common carotid artery (CCA), 2) left CCA, 3) right external carotid artery (ECA), 4) left ECA, 5) right internal carotid artery (ICA), 6) left ICA, 7) right bifurcation (BIF), and 8) left BIF. We assessed atherosclerotic plaques as binomial quality variables, and marked them as present when 1 of the following criteria was fulfilled: 1) local increase of intima media thickness (IMT) toward the lumen of the vessel, exceeding the surrounding IMT by over 0.5 mm, 2) local increase of IMT toward the lumen of the vessel, surpassing the surrounding IMT by 50%, 3) IMT increase by over 1.5 mm.24
Moreover, peripheral venous blood samples were collected in the morning after at least 8 hours of fasting and declaration of appropriate sleep through the night. The samples were then prepared for further analysis by centrifugation and stored at −70 °C. A detailed description of the methods used to evaluate biochemical parameters in the blood samples is presented in our previous publication.18
Metabolic categorization
We assessed the occurrence of MetS in the general population of Bialystok residents, based on a recent statement by Polish experts.14 The 2022 definition states that obesity, represented by BMI of 30 kg/m2 or higher or waist circumference of 88 cm or greater in women and 102 cm or greater in men, is a prerequisite. Additionally, obesity must be accompanied by at least 2 of the following: 1) systolic BP (SBP) of at least 130 mm Hg and / or diastolic BP (DBP) of at least 85 mm Hg on office measurement and / or antihypertensive treatment; 2) fasting glucose of at least 100 mg/dl and / or at least 140 mg/dl after 2 hours in OGTT and / or glycated hemoglobin (HbA1c) level of at least 5.7% or glucose‑lowering treatment; 3) non–high‑density lipoprotein cholesterol (non–HDL‑C) level of at least 130 mg/dl or lipid‑lowering treatment.
Then, we assessed the occurrence of MetS based on the 2009 Joint Interim Statement.13 To diagnose MetS, the joint presence of a minimum 3 out of 5 of the following is necessary: 1) waist circumference of 80 cm or greater in women or 94 cm or greater in men; 2) SBP of at least 130 mm Hg and / or DBP of at least 85 mm Hg; 3) fasting glucose of at least 100 mg/dl or glucose‑lowering treatment; 4) HDL‑C below 50 mg/dl in women or below 40 mg/dl in men or lipid‑lowering treatment; 5) triglyceride (TG) level of at least 150 mg/dl or treatment with fibrates.
Additionally, we assessed the occurrence of CKM syndrome based on the AHA statement.15 A full description of the categorization is provided in Supplementary material.
Cardiovascular risk assessment
The Systematic Coronary Risk Estimation 2 (SCORE2) and Systematic Coronary Risk Estimation 2‑Older Persons (SCORE2‑OP) were used to calculate cardiovascular risk in primary prevention.21 The SCORE2 and SCORE2‑OP estimate an individual 10‑year risk of fatal and nonfatal CVD events (myocardial infarction, stroke) in apparently healthy people. The SCORE2 and SCORE2‑OP were calculated, excluding the participants who were prequalified into the high and very high cardiovascular risk classes based on the abovementioned guidelines, that is, the participants with CVD or diabetes (diagnosed previously or at the time of the study entry), moderate or severe CKD at the time of the study entry, and younger than 40 years old. The SCORE2 was calculated for the individuals aged 40–69 years, while the SCORE2‑OP was calculated for those aged 70–89 years. Poland belongs to high CVD risk countries, and an appropriate calculator was used.21 The study population was divided according to the latest recommendations listed in the 2021 European Society of Cardiology Guidelines on CVD prevention in clinical practice21 into low‑to‑moderate, high, and very high CVD risk categories. The participants younger than 40 years who were not prequalified were excluded from the cardiovascular risk assessment.
Statistical analysis
We utilized the complete available dataset. Some data were missing due to technical reasons. These included lipoprotein(a) (Lp[a]) for 279 idividuals and active smoking for 52 individuals, and no imputation was performed for these missing values. Data on 2‑hour glucose levels (n = 232) and body fat percentage assessed by DEXA (n = 256) were unavailable due to contraindications that precluded these measurements.
Continuous variables were described by mean (SD) and median (interquartile range [IQR]). Categorical variables of baseline characteristics were shown as frequency (percentage). The baseline characteristics of all participants based on BMI and MetS categories were compared. Statistical analysis for continuous and categorical variables was performed using the Kruskal–Wallis or the χ2 test, respectively. The comparisons between the groups were made using the post hoc Dwass–Steel–Critchlow–Fligner (DSCF) test for continuous variables. Comparisons of proportions between the groups provided as post hoc tests for χ2 tests were assessed using tests for 2 proportions with the Bonferroni adjustment for multiple comparisons. Classification value of selected parameters with both definitions was assessed with the area under the curve (AUC) of the receiver operating characteristic (ROC). The statistical analyses were performed with SPSS sotware, version 27.0 (IBM, Armonk, New York, United States). Calculation of the DSCF tests was done using R package, version 4.4.2 (R Foundation for Statistical Computing, Vienna, Austria) based on the methodology described in the literature.31 All P values were 2‑sided, and deemed significant when below 0.05.
Ethics
Ethical approval for the study was given by the local Ethics Committee (R‑I‑002/108/2016). Written informed consent was obtained from all participants. The study identifier in the Trial Registration and Ethical Issues ClinicalTrials.gov database is NCT03197363.
Results
Study population and the prevalence of metabolic syndrome in the general population
The cross‑sectional analysis included 2110 participants (mean [SD] age, 49.3 [15.3] y; 44.3% men), with mean (SD) BMI of 27.1 (5) kg/m2. Figure 1 illustrates the relationships between the diagnosis of MetS based on different criteria. Among the 2110 study participants, 466 (22.1%) met the diagnostic criteria for MetS according to both definitions. Additionally, 109 individuals (5.1%) were identified solely by the 2022 guidelines, while 276 (13.1%) met only the 2009 criteria. Notably, 1259 participants (59.7%) did not meet the MetS criteria under either definition. Specifically, the updated Polish criteria, which include obesity as a prerequisite, resulted in fewer overall MetS diagnoses, but also identified a subset of individuals at a metabolic risk (n = 109; 5.2%) not captured by the 2009 criteria. Conversely, 276 participants (13.1%) met only the older criteria, typically due to differences in waist circumference or lipid thresholds.

Table 1 and Supplementary material Table S2 present baseline characteristics of the study group, stratified by the presence of MetS. The individuals diagnosed with MetS based on either definition were significantly older than those without MetS. The highest mean (SD) age (58.6 [12.5] y) was observed in the participants fulfilling both criteria, followed by those meeting only the 2022 (57.5 [11.9] y) or 2009 (55 [13.4] y) criteria, in contrast to the non‑MetS group (43.9 [14.5] y). The distribution of sex also differed significantly across the groups: men were markedly overrepresented in the 2009‑only MetS group (67.8%), and underrepresented in the 2022‑only MetS group (27.5%). Anthropometric variables, including BMI, WHR, and body fat percentage, were higher in the participants with MetS, reaching the highest levels among those meeting both definitions. The 2022‑only MetS group demonstrated the highest mean BMI and body fat percentage among all subgroups.
Variable | Total (n = 2110) | No MetS (I; n = 1259) | MetS based exclusively on 2022 definition (II; n = 109) | MetS based exclusively on 2009 definition (III; n = 276) | Patients fulfilling both MetS criteria (IV; n = 466) | Pairs differing significantly | |
Data are presented as number (percentage) or median (interquartile range) unless indicated otherwise.
SI conversion factors: to convert total cholesterol, LDL‑C, and HDL‑C to mmol/l, multiply by 0.0259; TG to mmol/l, by 0.0114; insulin to pmol/l, by 6; and glucose to mmol/l, by 0.0555.
The χ2 test with a post hoc test for 2 proportions with the Bonferroni correction for multiple comparisons were used to compare proportions between the groups; the Dwass–Steele–Critchlo–Fligner post hoc tests for the Kruskal–Wallis test were used to compare continuous variables between the groups; significant differences between pairs at P <0.05 are listed.
Abbreviations: BMI, body mass index; CV, cardiovascular; HbA1c, glycated hemoglobin; HDL‑C, high‑density lipoprotein cholesterol; ICA, internal carotid artery; LDL‑C, low‑density lipoprotein cholesterol; non–HDL‑C, non–high‑density lipoprotein cholesterol; OGTT, oral glucose tolerance test; TC, total cholesterol; TG, triglyceride; WHR, waist‑hip ratio; others, see Figure 1 | |||||||
Age, y, mean (SD) | 49.3 (15.3) | 43.9 (14.5) | 57.5 (11.9) | 55 (13.4) | 58.6 (12.5) | I–II, I–III, I–IV | |
Men | 934 (44.3) | 478 (38) | 30 (27.5) | 187 (67.8) | 239 (44.3) | I–II, I–III, I–IV, II–III, II–IV, III–IV | |
BMI, kg/m2 | 26.6 (23.4–30) | 24.3 (22–26.5) | 30.9 (29.3–33.4) | 27.4 (25.8–28.9) | 32 (30.2–34.8) | I–II, I–III, I–IV, II–III, III–IV | |
WHR | 0.86 (0.79–0.94) | 0.82 (0.76–0.88) | 0.88 (0.84–0.94) | 0.93 (0.86–1.1) | 0.95 (0.88–1.01) | I–II, I–III, I–IV, II–IV | |
Average fat, % | 33.5 (28.4–39.1) | 32 (27–37.2) | 41 (36–44.1) | 31.4 (28–55.5) | 37.2 (32.1–42.7) | I–II, I–IV, II–III, III–IV | |
Total cholesterol, mg/dl | 190 (165–220) | 185 (164–212.5) | 212 (198–232) | 199 (164–230) | 193 (160–223) | I–II, II–III, II–IV | |
TG, mg/dl | 94 (69.–136) | 78 (59–103) | 102 (87–122) | 144 (99.8–181) | 140 (102.3–190) | I–II, I–III, I–IV, II–III, II–IV | |
Lipoprotein(a), mg/dl | 6.2 (2.5–17.35) | 6.8 (2.5–17.49) | 7.1 (2.5–29.7) | 7.1 (2.5–26.8) | 6.6 (2.5–19.6) | – | |
HDL‑C, mg/dl | 60 (49.4–71.4) | 64.8 (54.9–74.9) | 61.1 (53.3–68.7) | 50.1 (43.9–61.6) | 51 (43.3–61) | I–III, I–IV, II–III, II–IV | |
LDL‑C, mg/dl | 120 ( 95.7–146.3) | 116.1 (94.7–140.1) | 143.1 (128.6–161.7) | 125.6 (97–155.6) | 124.8 (93.63–152.9) | I–II, II–III, II–IV | |
TG/HDL‑C ratio | 1.59 (1.02–2.55) | 1.21 (0.83–1.76) | 1.69 (1.28–2.01) | 2.79 (1.74–4.04) | 2.65 (1.87–3.9) | I–II, I–III, I–IV, II–IV, III–IV | |
Fasting serum glucose, mg/dl | 99 (92–107) | 95 (89–100) | 98 (93–106) | 105.5 (101–113.3) | 110 (103–122) | I–II, I–III, I–IV, II–III, II–IV | |
Serum glucose 2 h post‑OGTT, μIU/ml | 117 (99–140) | 109 (95–128) | 128 (110.5–155) | 127 (112–149.3) | 140 (116.8–171.3) | I–II, I–III, I–IV | |
Fasting serum insulin, μIU/ml | 10.3 (7.2–15.2) | 8.5 (6.2–11.2) | 11.8 (9.1–15.3) | 12.8 (9.4–17.5) | 17.4 (12.2–23.6) | I–II, I–III, I–IV, II–IV, III–IV | |
Serum insulin 2 h post‑OGTT, μIU/ml | 49 (30–78.9) | 39.9 (25.8–59.9) | 65.3 (38.3–98.3) | 62.2 (42–97.3) | 87.1 (54.4–144.3) | I–II, I–III, I–IV, III–IV | |
HbA1c, % | 5.4 (5.1–5.7) | 5.3 (5.1–5.5) | 5.6 (5.4–5.9) | 5.6 (5.3–5.8) | 5.7 (5.5–6.2) | I–II, I–III, I–IV, II–IV, III–IV | |
Current smokers | 400 (19.4) | 234 (19.1) | 18 (16.7) | 55 (20.3) | 93 (20.4) | – | |
Treatment of hypertension | 566 (26.8) | 154 (12.2) | 38 (34.9) | 112 (40.6) | 262 (56.2) | I–II, I–III, I–IV, II–IV, III–IV | |
Antidiabetic drugs | 149 (7.1) | 16 (1.3) | 6 (5.5) | 34 (12.3) | 93 (20) | I–II, I–III, I–IV, II–IV, III–IV | |
Cholesterol‑lowering treatment | 284 (13.5) | 45 (3.6) | 8 (7.3) | 69 (25) | 162 (34.8) | I–III, I–IV, II–III, II–IV, III–IV | |
Presence of atherosclerotic plaque in the carotid artery | 945 (45) | 380 (30.3) | 66 (60.6) | 175 (60.6) | 324 (45) | I–II, I–III, I–IV | |
ICA thickening >50% | 22 (1.1) | 5 (0.4) | 4 (1.47) | 1 (0.93) | 12 (2.61) | I–IV | |
CV risk | Low‑to‑moderate | 1061 (59.8) | 845 (78.9) | 37 (44.1) | 79 (37.3) | 100 (14.1) | I–II, I–III, I–IV, II–IV, III–IV |
High | 525 (29.6) | 172 (16.1) | 98 (46.2) | 30 (35.7) | 225 (55.4) | I–II, I–III, I–IV, II–IV | |
Very high | 187 (10.6) | 54 (5) | 35 (16.5) | 17 (20.2) | 81 (20) | I–II, I–III, I–IV | |
Lipid profiles varied significantly across the groups. HDL‑C levels were consistently the lowest in all MetS groups, whereas total cholesterol, low‑density lipoprotein cholesterol (LDL‑C), and TG levels were the highest, particularly among the individuals meeting only the 2022 definition. In contrast, glycemic parameters followed a different pattern. The highest fasting glucose levels were observed in the participants who fulfilled both MetS definitions. A significant difference in the prevalence of impaired fasting glucose was noted between the former and updated criteria. We also observed that the TG/HDL‑C ratio was lower in the individuals meeting only the 2022 criteria than in those identified based on the 2009 definition. The ratio was significantly higher in the group meeting only the 2009 criteria than in the individuals fulfilling both definitions, and significantly lower in the group classified solely according to the 2022 criteria. Among current smokers, the majority were classified as not having MetS. A significant difference was also observed in medication use between the analyzed groups; the group meeting both MetS criteria had the highest proportion of individuals receiving both treatment for diabetes and lipid‑lowering therapy.
Association of metabolic syndrome and atherosclerosis
Subsequently, we evaluated the association of MetS with preclinical atherosclerosis and cardiovascular risk, as shown in Table 1. The prevalence of carotid atherosclerotic plaques was substantially higher among the individuals with MetS, regardless of the definition applied. Moreover, ICA thickening over 50% was most frequently observed in the participants who fulfilled both the 2009 and 2022 diagnostic criteria for MetS. Across all cardiovascular risk categories, the individuals without MetS differed significantly from those with MetS, independent of the definition used. Cardiovascular risk stratification showed that the majority of individuals in the non‑MetS group were at a low‑to‑moderate risk (78.9%), whereas this proportion declined markedly in the MetS groups. Conversely, the prevalence of very high cardiovascular risk was increasing among the participants who met both MetS definitions (20%), as compared with only 5% in the non‑MetS group. Significant differences between the MetS definitions were noted in the low‑to‑moderate and high cardiovascular risk categories, whereas no significant difference was observed in the very high risk category. Notably, the group fulfilling both criteria, as well as the group defined by the 2022 recommendations, contained the largest proportions of individuals in the higher cardiovascular risk categories. No significant differences were observed in Lp(a) concentrations across the MetS or cardiovascular risk definitions, as presented in Table 1 and Supplementary material, Table S3. Lp(a) concentrations varied significantly across CKM stages, with post hoc comparisons indicating that stage 4 levels were significantly higher than those observed at stages 1–3. Interestingly, a significant difference between the analyzed populations across the MetS definitions was found among the individuals with normal BMI; however, this difference was not observed in the participants with BMI values above the normal range (Supplementary material, Table S4).
Comparison of previous and new guidelines of metabolic syndrome definition
To evaluate the effectiveness of various indicators in diagnosing MetS according to both definitions, we performed the ROC curve analysis. Supplementary material, Tables S5 and S6, present the ROC curves generated using the presence of MetS as the categorical outcome variable, defined according to the former definition. Among the evaluated parameters, waist circumference (AUC = 0.8778; 95% CI, 0.863–0.892), BMI (AUC = 0.8488; 95% CI, 0.832–0.865), fasting glucose (AUC = 0.842; 95% CI, 0.825–0.859), and TG/HDL‑C ratio (AUC = 0.8261; 95% CI, 0.807–0.845) exhibited the highest diagnostic accuracy, as indicated by the largest AUC (Figure 2). In comparison, LDL‑C and average body fat percentage showed markedly lower discriminative power when considered as independent diagnostic markers. Nonetheless, no single indicator emerged as a definitive marker with superior diagnostic accuracy over the others. Figure 3 and Supplementary material, Table S6 demonstrate ROC curves for MetS defined according to the updated 2022 consensus criteria as the categorical variable. BMI (AUC = 0.941; 95% CI, 0.931–0.951) and waist circumference (AUC = 0.912; 95% CI, 0.9–0.924) exhibited the greatest diagnostic utility in the detection of MetS of all the indicators evaluated. Both LDL‑C and average fat percentage showed reduced diagnostic relevance in this context.

Abbreviations: Avg, average; others, see Table 1

Cardiovascular‑kidney‑metabolic syndrome: its prevalence and comparative assessment with metabolic syndrome
In Table 2, we present the clinical and biochemical characteristics of the study participants stratified by CKM syndrome, as defined by the AHA. These stages represent a continuum of cardiometabolic risk, ranging from metabolically healthy individuals (stage 0) to those with clinically manifested CVD (stage 4). A gradual increase in age was observed across the CKM stages (P <0.001). The proportion of men was the lowest at the stage 0 (23.9%), peaked at the stage 2 (61.5%), and followed a moderate decline at the stages 3 (43.3%) and 4 (52.2%). There was an increase in BMI, WHR, and waist circumference across CKM stages (P <0.001). A similar pattern was observed for arterial BP. Both SBP and DBP increased with advancing CKM stage, with DBP reaching its highest median value at the stage 2, and remaining elevated at the subsequent stages. Moreover, glycemic parameters also showed a consistent deterioration across CKM progression. Notably, 2‑hour postload insulin levels nearly doubled between the stages 0 and 3, indicating impaired glucose metabolism among the individuals with more advanced stages of CKM. Lipid abnormalities were most pronounced at the intermediate stages. TG concentrations increased markedly from the stage 1 (median [IQR], 81 [61–103] mg/dl) to stage 2 (147 [97–187] mg/dl) and remained elevated thereafter. Mean (IQR) LDL‑C level peaked at the stage 2 (136.2 [112.5–162.7] mg/dl) and declined slightly at the stage 4 (110.1 [79.2–136.3] mg/dl). Similarly, total cholesterol concentrations were the highest at the stage 2, and decreased at later stages, potentially reflecting the impact of lipid‑lowering therapies in the individuals with established CVD. The burden of subclinical atherosclerosis increased sharply across CKM stages. While only 11.6% of the participants at the stage 0 exhibited carotid atherosclerotic plaques, the prevalence rose to 81.6% at the stage 3 and 80.6% at the stage 4. ICA thickening over 50% was not observed at the stages 0 through 2, but was present in 2% of the individuals at the stage 3 and 5.4% at the stage 4. For low and high cardiovascular risk, the stage 0 was significantly different from all other CKM stages. At each successive stage, a significant increase was observed in the prevalence of individuals classified as the cardiovascular risk stages 2 and 3, alongside a noticeable decrease in the proportion of participants remaining at the stage 1. A significantly higher proportion of those with high and very high cardiovascular risk qualified for the stage 3 and 4, although there was an upward trend from the stage 2 onward. Figure 4 presents distribution of CKM stages across different age groups stratified by sex. Among men, we saw a clear age‑related increase in the prevalence of higher CKM stages. In the youngest group (20–34 y), the majority of men were at the stage 0 (29%) or stage 1 (33%), while only 10% were at the stage 3, and even fewer at the stage 4. In contrast, in the oldest male group (65–80 y), the majority were at the stages 2 (62%) and 3 (36%), with a notable proportion (22%) reaching the stage 4. For women, a similar age‑related pattern was observed, though with notable differences in the distribution. In the youngest women group, a substantial proportion were at the stage 0 (60%), with only small fractions at the stages 3 and 4. In the oldest women group, most individuals were at the stage 2 (66%), with decreasing proportions at the higher stages, as compared with their male counterparts. Figure 5 and Supplementary material, Table S7 compare CKM and MetS prevalence considering all definitions. Notably, CKM stages 3 and 4 were strongly associated with MetS diagnosed by either the 2009 or 2022 criteria. However, a substantial subset of high‑risk individuals (n = 193 at stage 3) did not fulfill the criteria for MetS, suggesting that CKM staging captures additional risk dimensions, particularly related to subclinical cardiovascular and renal dysfunction, not encompassed by traditional MetS definitions. To gain a more comprehensive understanding of the cardiometabolic profile of high‑risk individuals who do not meet the formal diagnostic thresholds for MetS, we examined the distribution of MetS components, according to both the 2009 and 2022 definitions, across CKM stages (Supplementary material, Tables S8 and S9). Among the patients classified as CKM stage 3 (n = 471), only 3.2% met none of the 2009 MetS criteria, while 13.2% met 1 criterion and 24.6% met 2 criteria. Consequently, 41% of the patients at the stage 3 did not fulfill the diagnostic threshold for MetS but exhibited 1 or 2 metabolic abnormalities. A similar pattern was observed using the 2022 definition, with 2.3%, 9%, and 23.7% of the patients meeting 0, 1, or 2 criteria, respectively. To further characterize this subgroup, we conducted a comparative analysis of the stage 3 patients with (n = 278) and without (n = 193) MetS, as defined by the 2009 criteria (Supplementary material, Table S10). Despite not meeting the formal diagnostic threshold, the individuals without MetS demonstrated clear metabolic abnormalities, including elevated mean (SD) fasting glucose (101.7 [15.1] mg/dl) and TG levels (94.9 [42.9] mg/dl), and BMI (26.9 [4.1] kg/m²). Differences between MetS‑positive and MetS‑negative individuals were observed for glucose metabolism parameters, lipid profile parameters, BP, and adiposity indices (P <0.05). Notably, while these differences were both consistent and clinically meaningful, the mean values in the MetS‑negative group nonetheless deviated from standard reference ranges, suggesting the presence of subclinical or emerging cardiometabolic risk.
Variable | Stage 0 (n = 371) | Stage 1 (n = 429) | Stage 2 (n = 491) | Stage 3 (n = 470) | Stage 4 (n = 206) | Pairs differing significantly | |
Data are presented as number (percentage) or median (interquartile range) unless indicated otherwise.
SI conversions factors: see Table 1
The χ2 test with a post hoc test for 2 proportions with the Bonferroni correction for multiple comparisons were used to compare proportions between the groups; the Dwass–Steele–Critchlo–Fligner post hoc tests for the Kruskal–Wallis test were used to compare continuous variables between the groups; significant differences between pairs at P <0.05 are listed.
Abbreviations: DBP, diastolic blood pressure; SBP, systolic blood pressure; others, see Table 1 | |||||||
Age, y, mean (SD) | 36.1 (9.9) | 42.8 (12) | 45 (11) | 64.2 (9.2) | 63.6 (11.9) | 0–1, 0–2, 0–3, 0–4, 1–3, 1–4, 1, 1–4, 1–4 | |
Men | 89 (23.92) | 194 (44.91) | 303 (61.46) | 204 (43.31) | 108 (52.17) | 0–1, 0–2, 0–3, 0–4, 1–2, 2–3 | |
BMI, kg/m2 | 22 (20.4–23.6) | 26.4 (24.8–28.1) | 28.2 (25.6–31.5) | 29 (25.8–32.4) | 29.3 (26.7–32) | 0–1, 0–2, 0–3, 0–4, 1–2, 1–3 | |
WHR | 0.78 (0.73–0.83) | 0.84 (0.78–0.91) | 0.9 (0.85–0.96) | 0.91 (0.83–0.98) | 0.93 (0.7–0.99) | 0–1, 0–2, 0–3, 0–4, 1–2, 1–3 | |
Waist circumference, cm | 73 (69–79) | 84.5 (79–92) | 93.5 (87–101) | 95 (85–104) | 98 (88.5–104) | 0–1, 0–2, 0–3, 0–4, 1–2, 1–3 | |
Average fat, % | 31.1 (27.1–35.2) | 34.3 (8.9–39.3) | 32.4 (27.9–39.3) | 35.8 (35.5–41.3) | 35 (30.1–39.6) | 0–1, 0–2, 0–3, 0–4, 1–3, 2–3 | |
SBP, mm Hg | 109.8 (101.5–117.6) | 118.5 (109.0–126.6) | 129.5 (119.5–139.5) | 133 (119–144) | 125.5 (115.5–140.5) | 0–1, 0–2, 0–3, 0–4, 1–2, 1–3 | |
DBP, mm Hg | 75 (70–80) | 78 (72.5–82.5) | 87.5 (80–93) | 82 (75–89.5) | 80 (73.5–86.3) | 0–1, 0–2, 0–3, 0–4, 1–2, 1–3 | |
Total cholesterol, mg/dl | 177 (157–204) | 188 (167–212) | 204 (179–234) | 196 (166–224) | 175 (147.5–208.5) | 0–1, 0–2, 1–2, 2–4, 3–4 | |
TG, mg/dl | 66 (53–85) | 81 (61–103) | 147 (97–187) | 112 (83.5–152) | 102 (80–141.5) | 0–1, 0–2, 0–3, 0–4, 1–2, 1–3 | |
Lipoprotein(a), mg/dl | 5.6 (2.5–17.2) | 6.6 (2.5–17.2) | 6.8 (2.5–23.8) | 6.1 (2.5–16.8) | 10.5 (3.1–49) | 0–4, 1–4, 2–4, 3–4 | |
HDL‑C, mg/dl | 69.7 (59.8–78.7) | 62 (53.3–72.7) | 52.4 (44.2–63.2) | 58.5 (47.6–69.9) | 54 (45–64.4) | 0–1, 0–2, 0–3, 0–4, 1–2, 1–3 | |
LDL‑C, mg/dl | 106 (88.5–126.9) | 120 (98.8–143.5) | 136.2 (112.5–162.7) | 121.2 (97.5–149.3) | 110.1 (79.2–136.3) | 0–1, 0–2, 0–3, 1–2, 2–3, 2–4 | |
TG/HDL‑C ratio | 0.96 (0.7–1.31) | 1.29 (0.94–1.76) | 2.75 (1.71–3.91) | 1.96 (1.24–2.89) | 1.95 (1.35–2.98) | 0–1, 0–2, 0–3, 0–4, 1–2, 1–3 | |
Fasting serum glucose, mg/dl | 90 (86–94) | 99 (93–103.3) | 101 (95–107) | 107 (100–119) | 106 (99–271) | 0–1, 0–2, 0–3, 0–4, 1–2, 1–3 | |
Serum glucose 2 h post‑OGTT, mg/dl | 101 (88–116) | 113 (95–128) | 121 (105.5–139) | 140 (115.3–174.8) | 132 (108.5–161) | 0–1, 0–2, 0–3, 0–4, 1–2, 1–3 | |
HbA1c, % | 5.2 (5–5.4) | 5.3 (5.1–5.6) | 5.4 (5.2–5.6) | 5.7 (5.4–6) | 5.7 (5.5–6.1) | 0–1, 0–2, 0–3, 0–4, 1–3, 1–4 | |
Fasting serum insulin, μIU/ml | 7 (5.3–9.2) | 9.6 (7.1–12.6) | 13 (9.5–18.5) | 12.3 (8.9–19) | 12.3 (8.7–17.9) | 0–1, 0–2, 0–3, 0–4, 1–2, 1–3 | |
Serum insulin 2 h post‑OGTT, μIU/ml | 33.3 (23.1–50.6) | 41.2 (25.1–60.6) | 58.8 (37.2–95.4) | 68.6 (43.2–114) | 62.4 (39.5–100.6) | 0–2, 0–3, 0–4, 1–2, 1–3, 1–4 | |
Current smokers | 64 (17.6) | 75 (18.1) | 98 (20.3) | 107 (23.2) | 31 (15.5) | – | |
Treatment of hypertension | 10 (2.7) | 47 (11) | 106 (21.6) | 255 (54.3) | 128 (62.1) | 0–1, 0–2, 0–3, 0–4, 1–2, 1–3 | |
Antidiabetic drugs | 4 (1.1) | 3 (0.7) | 20 (4.1) | 73 (15.5) | 42 (20.4) | 0–3, 0–4, 1–2, 1–3, 1–4, 2–3 | |
Cholesterol‑lowering treatment | 3 (0.8) | 20 (4.7) | 43 (8.8) | 119 (25.3) | 91 (44.2) | 0–1, 0–2, 0–3, 0–4, 1–3, 1–4 | |
Presence of atherosclerotic plaque in the carotid artery | 43 (11.56) | 115 (26.68) | 191 (38.9) | 381 (81.58) | 166 (80.58) | 0–1, 0–2, 0–3, 0–4, 1–2, 1–3 | |
ICA thickening >50% | 0 | 1 (0.2) | 1 (0.2) | 9 (2) | 11 (5.4) | 0–4, 1–4, 2–4 | |
CV risk | Low‑to‑moderate | 332 (95.1) | 314 (84.4) | 250 (60.8) | 65 (16.8) | 34 (21) | 0–1, 0–2, 0–3, 0–4, 1–2, 1–3 |
High | 17 (4.9) | 56 (15.1) | 147 (35.8) | 213 (55.2) | 73 (45.1) | 0–1, 0–2, 0–3, 0–4, 1–2, 1–3 | |
Very high | 0 | 2 (1) | 14 (3) | 108 (28) | 55 (34) | 0–2, 0–3, 0–4, 1–2, 1–3, 1–4 | |


Discussion
The main findings of our study indicate that the prevalence of MetS in an urban Central European population approaches 40%, irrespective of the diagnostic criteria applied. Furthermore, 46.8% of Polish adults fulfilled the criteria for CKM risk factors. A greater proportion of the individuals met the MetS criteria under the former guidelines. Comparative analysis demonstrated that the updated definition significantly differs from the former one regarding mean body fat, BMI, and LDL‑C values. The updated recommendations prove to be more specific in the female population and allow for a more accurate stratification to a higher cardiovascular risk category. However, the previous definition demonstrates higher specificity for detecting impaired fasting glucose. Notably, the individuals who met both diagnostic definitions exhibited markedly increased cardiovacular risk and more unfavorable anthropometric profiles. Moreover, we demonstrated a progressive increase in the prevalence of MetS with advancing CKM stage, underlining a strong association between metabolic dysregulation and the progression of cardiometabolic disease. Our findings indicate that a substantial proportion of the individuals at the advanced CKM stages who do not meet the combined MetS criteria may still display early‑stage or atypical metabolic disturbances. Our results highlight a sex‑specific and age‑dependent progression of CKM stage burden, with men showing an earlier and more pronounced shift toward higher‑risk stages. Our observations support the hypothesis that the CKM staging framework captures a broader spectrum of cardiometabolic dysfunction, extending beyond the individuals who formally satisfy the MetS diagnostic criteria. As such, CKM staging may serve as a more inclusive and clinically informative tool for identifying high‑risk individuals who may otherwise remain undetected using conventional MetS definitions.
This study demonstrates a very strong prevalence of MetS—nearly 40% of the study respondents fulfilled any diagnostic criteria for MetS. According to the recent 2022 definition, we found MetS in 35.2% of the participants, at a similar level as in the WOBASZ II study (35.8%).22 The NATPOL study estimated the prevalence of MetS at 22.6% in women and 18% in men, based on the 2001 Adult Treatment Panel III criteria.23 In both studies, atherogenic dyslipidemia was the most common component, as also confirmed in our analysis. Moreover, in the decade between the WOBASZ and WOBASZ II studies, there was a significant increase in the prevalence of MetS in Polish adults: by 3.3 percentage points in women (26.6% vs 29.9%) and by 8.8 percentage points in men (30.7% vs 39.4%).24 The PONS trial (Polish Norwegian Study), another 2011 survey of the Polish population, found that MetS occured in 39.5% of the participants (including 49.9% of men).25 We also confirmed the results of the latest comparison, where the frequency of MetS diagnosis based on the new criteria was lower than based on the 2009 consensus.26 These studies indicate the important role of health care in MetS.
A diagnosis of MetS is clinically important due to its well‑established association with the development and progression of atherosclerosis.27 Previous studies have not directly compared MetS diagnostic criteria in terms of their impact on cardiovascular risk. In our study, the presence of MetS fulfilling both definitions was associated with the highest risk of subclinical atherosclerosis, indicating the highest diagnostic sensitivity for identifying the individuals at an elevated cardiovascular risk. When comparing the updated guidelines with the former ones, a greater proportion of individuals with a high and very high cardiovascular risk was identified based on the 2022 criteria. While the overall prevalence of atherosclerotic plaques was comparable in the individuals diagnosed with MetS based on either definition, ICA thickening exceeding 50% was more frequently observed among those diagnosed according to the updated guidelines. These findings indicate that the updated criteria demonstrate a substantial potential for enhanced identification of patients at a heightened cardiovascular risk. We showed that the TG/HDL‑C ratio significantly differed between the selected populations. In a previous study, this ratio strongly correlated with insulin resistance and central obesity,28 which may also indicate the use of both definitions in clinical practice.
CKM syndrome stages clearly delineate a trajectory of worsening cardiometabolic health. Our analysis determined the prevalence of each stage of CKM syndrome in the Polish population, referring to the AHA statement.15 Although the prevalence of comorbidities that are integral to CKM syndrome and affect cardiovascular risk has been precisely described, the prevalence of CKM syndrome in Poland has not been well characterized. Almost 46.8% of Polish adults met the criteria for risk factors of CKM syndrome (stage 1–2), and 34.4% met criteria for advanced stages 3 and 4. Overall, CKM stage 0 was observed in 18.9% of the respondents. Recently, researchers reported the prevalence of CKM in the United States based on the new 2023 guidelines.29 Among the cohorts aged 20–44, 45–64, and 65 years or older, stage 0 was present in 17.35%, 5.45%, and 1.8% of the individuals, respectively.16 Risk factors and subclinical CKM (stages 1–3) were present in 80.94%, 85.95%, and 72.03%, respectively.30 In the cohort with more than half a million Asian adults, approximately 74.3% exhibited CKM syndrome, distributed as 67% at the stage 1–2 and 7.3% at the stage 3–4.30 In summary, the prevalence of CKM and its components varies, contributing to different risks of cardiovascular mortality. The difference in prevalence may be due to the restrictiveness of the criteria used. Lower adiposity, better lipid and glucose profiles, and minimal vascular changes characterize early stages (0–1). In contrast, later stages (3–4) reflect advanced metabolic dysfunction, marked insulin resistance, significant atherosclerotic burden, and increased cardiovascular risk. Our findings support the utility of CKM staging as a comprehensive risk stratification tool, integrating metabolic, renal, and vascular domains beyond traditional MetS definitions.
This study has several notable strengths, including a large and well‑characterized study population as well as the application of 3 different sets of recommendations for the assessment of MetS, which enhances the robustness and comparability of the findings. Nonetheless, as this is an observational study, the cohort inevitably includes individuals receiving cholesterol‑lowering medications and pharmacological treatment for diabetes. These factors, which could influence certain metabolic parameters, have been documented and accounted for in the analysis.
Conclusions
Our findings indicate a very high prevalence of MetS, regardless of the evaluation criteria used. The results show the distribution of the individuals meeting each stage of the CKM syndrome diagnostic criteria. The outcomes confirmed the high burden of ASCVD risk factors in the general population, including the participants who have not yet developed clinical CVD. The choice of MetS definition significantly impacts both prevalence estimates and cardiometabolic risk stratification. Notably, the updated criteria effectively identify patients at a higher cardiovascular risk, while CKM staging further captures high‑risk individuals who yet do not meet the MetS criteria, highlighting its broader applicability and added value as an integrative tool for comprehensive cardiometabolic risk assessment.
- Samson SL, Garber AJ. Metabolic syndrome. Endocrinol Metab Clin North Am. 2014; 43: 1‑23. | Crossref
- NCD Risk Factor Collaboration (NCD‑RisC). Worldwide trends in body‑mass index, underweight, overweight, and obesity from 1975 to 2016: a pooled analysis of 2416 population‑based measurement studies in 128.9 million children, adolescents, and adults. Lancet. 2017; 390: 2627‑2642. | Crossref
- Reilly J, Kelly J. Longterm impact of overweight and obesity in childhood and adolescence on morbidity and premature mortality in adulthood: systematic review. Int J Obes (Lond). 2011; 35: 891‑898. | Crossref
- Cawley J, Biener A, Meyerhoefer C, et al. Direct medical costs of obesity in the United States and the most populous states. J Manag Care Spec Pharm. 2021; 27: 354‑366. | Crossref
- Afshin A, Forouzanfar MH, Reitsma MB, et al. GBD 2015 Obesity Collaborators. Health effects of overweight and obesity in 195 countries over 25 years. N Engl J Med. 2017; 377: 13‑27. | Crossref
SUPPLEMENTARY MATERIAL
ARTICLE INFORMATION