Changes in the prevalence of heart failure phenotypes over time and their association with patient prognosis
Key words: comorbidity, heart failure, phenotypes, prognosis, secular trends


 CC BY-NC-SA 4.0
Changes in the prevalence of heart failure phenotypes over time and their association with patient prognosis
Introduction: The prevalence and phenotypic frequency of heart failure (HF) vary across populations; yet, little is known about how the rates of individual HF phenotypes shift over time and how such changes affect patient outcomes.
Objectives: We aimed to evaluate temporal trends in HF phenotype prevalence and their associations with patient characteristics and prognosis.
Patients and methods: We retrospectively analyzed data from 2597 patients hospitalized with HF between January 2014 and May 2019. The patients were categorized into tertiles according to time of their admission to a hospital, and stratified by HF phenotype into HF with reduced ejection fraction (HFrEF), HF with mildly reduced ejection fraction (HFmrEF), and HF with preserved ejection fraction (HFpEF). We assessed changes in phenotype prevalence, patient clinical characteristics, and survival. Data were obtained from hospital records and the National Health Fund. The end point was all‑cause death or censoring on May 25, 2023.
Results: Between the first and third tertiles, the prevalence of HFrEF decreased by 27% and the prevalence of HFmrEF and HFpEF increased by 53% and 92%, respectively. There was a progressive increase in the proportion of older patients, women, and the number of comorbidities, particularly hypertension, atrial fibrillation, diabetes, and cancer. The 5‑year survival rates improved across tertiles for all HF patients (from 48.4% to 60.2%; P <0.001), with the greatest gains observed in the HFrEF group (from 45.7% to 57%; P <0.001). After adjusting for confounders, hospitalization during the second and third tertiles remained an independent predictor of longer survival, as compared with admission during the first tertile.
Conclusions: During the study period, the proportion of patients with HFpEF and HFmrEF increased, and this shift was paralleled by a growing proportion of elderly and female patients and a rising burden of comorbidities. However, overall survival improved, particularly among the HFrEF patients.
What's new?
We showed that despite an aging patient population and an increasing burden of comorbidities, survival rates among individuals with heart failure (HF) have improved over time, independently of phenotype prevalence and baseline clinical characteristics. These findings underscore the evolving epidemiology of HF and highlight the necessity of phenotype‑specific management strategies. In particular, there is a need to focus on the complex comorbidity profiles of patients with HF to sustain and enhance clinical outcomes.

Introduction
According to recent estimations, heart failure (HF) affects approximately 64.3 million people worldwide.1 In Europe, the prevalence ranges from just over 1% in Belgium and Italy to 4% in Germany.2 Globally, HF prevalence is projected to rise from 8.52 to 9.81 cases per 1000 population between the years 2017 and 2030, largely due to population aging and improved HF survival rates.1-4 HF commonly coexists with comorbidities, which are also increasing in prevalence.
There is a disparity in the frequency of HF phenotypes, with HF with reduced ejection fraction (HFrEF) accounting for 46%–54% of all hospitalized cases, and HF with preserved ejection fraction (HFpEF), for 23%–46%.5 Data on the proportion of individual phenotypes in the Polish population are limited; it is estimated that HFrEF represents 62% and HFpEF 25% of all hospitalized patients with a HF diagnosis.5 However, there are scarce data on changes in the characteristics of patients with HF over time, including the prevalence of individual HF phenotypes and the rates of various comorbidities.
Therefore, we aimed to describe shifts in the distribution frequency of HF phenotypes over a long‑term follow‑up in patients admitted to a tertiary cardiac center, and to examine the association between these changes, patient characteristics, and prognosis.
Patients and methods
The data were derived from a single‑center retrospective study conducted at the National Institute of Cardiology in Warsaw in collaboration with the Agency for Health Technology Assessment and Tariff System.6 Patients aged 18 years and older were selected from the electronic database of individuals hospitalized between January 2014 and May 2019 with billing codes corresponding to hospitalizations for HF (both elective and emergency admissions), with verification of the HF diagnosis performed by physicians (site investigators). Patient medical data were retrieved from hospital databases and supplemented with information from the Polish National Health Fund. The latter included records of hospital admissions, International Classification of Diseases, Tenth Revision (ICD‑10) codes for diagnoses, and procedures performed, classified according to the ICD‑9 system. Data on survival status were obtained from the national registry, with the end of follow‑up set as May 25, 2023. A detailed description of the study protocol and inclusion / exclusion criteria has been published previously,6 and a brief summary relevant to the present analysis is provided below.
The HF phenotype was defined based on EF derived from echocardiographic examinations. The classification of HF was as follows: 1) HFrEF for EF below 40%; 2) HF with mildly reduced EF (HFmrEF) for EF between 40% and 49%; and 3) HFpEF for EF equal to or greater than 50%, in accordance with the recommendations that were in place at the time of data collection.7 Individuals with missing data on EF (n = 21) were excluded from the analysis. After confirming the diagnosis of HF, the patients who underwent heart transplant / left ventricular assist device implantation or were misdiagnosed (n = 44) and those with congenital heart disease (n = 20) were also excluded. The final sample comprised 2597 patients with a HF diagnosis. The study flowchart is presented in Supplementary material, Figure S1. Patient characteristics included information on chronic HF (diagnosed >6 months prior to the current hospitalization), emergency admission, HF etiology, sex, and age. Information on comorbidities diagnosed before or during hospitalization was also collected, including data on aortic stenosis, hypertension, ischemic heart disease, diabetes mellitus, atrial fibrillation, stroke, anemia, renal dysfunction, liver failure, chronic obstructive pulmonary disease (COPD) / asthma, thyroid disease, and cancer diagnoses.
Ethics
The study protocol was approved by the Biomedical Ethics Committee of the National Institute of Cardiology (IK‑NPIA‑0021‑77/1799/2019).
Statistical analysis
To capture temporal changes in the prevalence of individual HF phenotypes while ensuring statistical comparability, the total patient population was divided into 3 equal (n = 865 or 866) subgroups (tertiles) according to the time of their admission to a hospital. The first tertile (T1) spanned from January 3, 2014 to February 6, 2017, the second tertile (T2), from February 7, 2017 to March 25, 2018, and the third tertile (T3), from March 26, 2018 to May 22, 2019. The rates of individual HF phenotypes and patient characteristics were compared between these subgroups in the total sample; differences in patient characteristics were also assessed across the HF phenotypes. Additionally, trends over the admission tertiles were assessed. Data distribution was verified using the Shapiro–Wilk test in all groups, and continuous variables are presented as mean with SD. Qualitative data are presented as numbers and percentages. The distribution of quantitative data between tertiles of admission was compared using the analysis of variance and the Kruskal–Wallis test. Categorical variables were compared between the groups using the χ2 test. Trend assessment between tertiles was performed using the Cochran–Armitage and Jonckheere–Terpstra tests. As the length of follow‑up was not equal in subsequent tertiles, for mortality comparison, we utilized a follow‑up of 5 years. Survival probability was estimated using the Kaplan–Meier survival curves, and the log‑rank test was used to assess differences between the curves. The Bonferroni correction was applied to account for multiple pairwise comparisons between the tertile groups, and an adjusted threshold of 0.0167 was used to interpret statistical significance. To compare the death risk across tertiles, the Cox proportional hazards regression was used, with T1 serving as the reference. The final Cox regression models included variables that differed between tertiles: HF phenotype, sex, age, HF etiology, number of comorbidities, and medications used at discharge. Analyses were performed using STATA software (StataCorp LLC, College Station, Texas, United States). The significance level was set at a P value below 0.05.
Results
Patient characteristics according to the temporal sequence of hospitalizations for the entire population are presented in Table 1, while stratification by HF phenotype is presented in Tables 2, 3, 4.
Characteristic | T1 (n = 866) | T2 (n = 865) | T3 (n = 866) | P value (T1 vs T2 vs T3) | P value for trend | |
Data are presented as number (percentage) or mean (SD) unless indicated otherwise.
Abbreviations: ACEI, angiotensin‑converting enzyme inhibitors; BB, β-blockers; COPD, chronic obstructive pulmonary disease; DOAC, direct oral anticoagulant; HF, heart failure; HFmrEF, heart failure with mildly reduced ejection fraction; HFpEF, heart failure with preserved ejection fraction; HFrEF; heart failure with reduced ejection fraction; IQR, interquartile range; MRA, mineralocorticoid receptor antagonist; T, tertile; VKA, vitamin K antagonist | ||||||
HF phenotype | HFrEF | 641 (74) | 496 (57.3) | 467 (53.9) | <0.001 | <0.001 |
HFmrEF | 84 (9.7) | 119 (13.8) | 128 (14.8) | |||
HEpEF | 141 (16.3) | 250 (28.9) | 271 (31.3) | |||
Men | 663 (76.6) | 569 (65.8) | 588 (67.9) | <0.001 | <0.001 | |
Age, y | 59.7 (12.74) | 64.5 (15.1) | 64.8 (14.82) | <0.001 | <0.001 | |
Age >65 y | 234 (27) | 436 (50.4) | 452 (52.2) | <0.001 | <0.001 | |
Emergency admission | 379 (43.8) | 414 (47.9) | 394 (45.5) | 0.23 | 0.47 | |
Chronic HF | 755 (87.3) | 736 (85.2) | 739 (85.4) | 0.39 | 0.27 | |
Ischemic etiology | 373 (43.1) | 335 (38.7) | 332 (38.3) | 0.08 | 0.04 | |
Comorbidities, n, median (IQR) | 4 (3–6) | 5 (3–6) | 5 (3–6) | <0.001 | <0.001 | |
Hypertension | 591 (68.2) | 686 (79.3) | 705 (81.4) | <0.001 | <0.001 | |
Coronary heart disease / myocardial infarction | 601 (69.4) | 624 (72.1) | 623 (71.9) | 0.37 | 0.24 | |
Atrial fibrillation | 467 (53.9) | 530 (61.3) | 517 (59.7) | 0.005 | 0.02 | |
Diabetes mellitus | 304 (35.1) | 321 (37.1) | 337 (38.9) | 0.26 | 0.1 | |
Renal dysfunction | 281 (32.5) | 310 (35.8) | 289 (33.4) | 0.31 | 0.69 | |
Thyroid disease | 243 (28.1) | 271 (31.3) | 248 (28.6) | 0.28 | 0.79 | |
COPD / asthma | 198 (22.9) | 217 (25.1) | 234 (27) | 0.14 | 0.046 | |
Cancer | 142 (16.4) | 209 (24.2) | 290 (33.5) | <0.001 | <0.001 | |
Anemia | 125 (14.4) | 186 (21.5) | 181 (20.9) | <0.001 | <0.001 | |
Stroke (any type) | 104 (12) | 112 (13) | 98 (11.3) | 0.58 | 0.66 | |
Aortic stenosis | 47 (5.5) | 84 (9.7) | 101 (11.7) | <0.001 | <0.001 | |
Liver failure | 53 (6.1) | 38 (4.4) | 34 (3.9) | 0.08 | 0.03 | |
ACEI | 754 (88.5) | 746 (87.3) | 708 (82.1) | <0.001 | <0.001 | |
BB | 819 (96.1) | 823 (96.3) | 826 (95.8) | 0.89 | 0.75 | |
MRA | 687 (80.6) | 634 (74.2) | 578 (67.1) | <0.001 | <0.001 | |
Diuretics | 762 (89.4) | 754 (88.1) | 725 (84.1) | 0.003 | 0.001 | |
VKA/DOAC | 491 (57.3) | 524 (61.1) | 505 (58.5) | 0.32 | 0.74 | |
Death during 5‑year follow‑up | 447 (51.6) | 414 (47.9) | 345 (39.8) | <0.001 | <0.001 | |
Characteristic | T1 (n = 641) | T2 (n = 496) | T3 (n = 467) | P value (T1 vs T2 vs T3) | P value for trend |
Data are presented as number (percentage) or mean (SD) unless indicated otherwise.
Abbreviations: see Table 1 | |||||
Men | 539 (84.1) | 394 (79.4) | 370 (79.2) | 0.06 | 0.03 |
Age, y | 58.8 (11.68) | 61.1 (14.28) | 62.2 (13.61) | <0.001 | <0.001 |
Age >65 y | 140 (21.8) | 184 (37.1) | 196 (42) | <0.001 | <0.001 |
Emergency admission | 267 (41.7) | 205 (41.3) | 183 (39.2) | 0.69 | 0.43 |
Chronic HF | 570 (88.9) | 429 (86.5) | 406 (86.9) | 0.41 | 0.29 |
Ischemic etiology | 320 (49.9) | 242 (48.8) | 236 (50.5) | 0.86 | 0.88 |
Comorbidities, n, median (IQR) | 4 (3–6) | 5 (3–6) | 5 (3–6) | 0.03 | 0.01 |
Hypertension | 434 (67.7) | 372 (75) | 366 (78.4) | <0.001 | <0.001 |
Coronary heart disease / myocardial infarction | 472 (73.6) | 373 (75.2) | 356 (76.2) | 0.6 | 0.32 |
Atrial fibrillation | 346 (54) | 279 (56.3) | 265 (56.8) | 0.6 | 0.34 |
Diabetes mellitus | 235 (36.7) | 193 (38.9) | 192 (41.1) | 0.32 | 0.13 |
Renal dysfunction | 216 (33.7) | 169 (34.1) | 154 (33) | 0.94 | 0.82 |
Thyroid disease | 178 (27.8) | 144 (29) | 118 (25.3) | 0.41 | 0.41 |
COPD / asthma | 147 (22.9) | 114 (23) | 133 (28.5) | 0.07 | 0.04 |
Cancer | 95 (14.8) | 89 (17.9) | 129 (27.6) | <0.001 | <0.001 |
Anemia | 82 (12.8) | 84 (16.9) | 89 (19.1) | 0.01 | 0.004 |
Stroke (any type) | 86 (13.4) | 63 (12.7) | 54 (11.6) | 0.66 | 0.36 |
Aortic stenosis | 30 (4.7) | 25 (5.1) | 29 (6.2) | 0.53 | 0.28 |
Liver failure | 46 (7.2) | 24 (4.8) | 20 (4.3) | 0.08 | 0.03 |
ACEI | 578 (91.1) | 458 (93.3) | 405 (87.3) | 0.003 | 0.02 |
BB | 610 (97) | 483 (98.4) | 457 (98.5) | 0.15 | 0.07 |
MRA | 547 (87.1) | 421 (85.7) | 370 (79.7) | 0.003 | 0.002 |
Diuretics | 586 (93.2) | 450 (91.7) | 416 (89.7) | 0.12 | 0.05 |
VKA/DOAC | 375 (59.6) | 291 (59) | 267 (57.3) | 0.73 | 0.45 |
Death during 5‑year follow‑up | 348 (54.3) | 249 (50.2) | 201 (43) | <0.001 | <0.001 |
Characteristic | T1 (n = 84) | T2 (n = 119) | T3 (n = 128) | P value (T1 vs T2 vs T3) | P value for trend |
Data are presented as number (percentage) or mean (SD) unless indicated otherwise.
Abbreviations: see Table 1 | |||||
Men | 54 (64.3) | 77 (64.7) | 95 (74.2) | 0.18 | 0.1 |
Age, y | 60.8 (14.96) | 65.5 (15.27) | 65.2 (14.82) | 0.05 | 0.04 |
Age >65 y | 33 (39.3) | 65 (54.6) | 74 (57.8) | 0.02 | 0.01 |
Emergency admission | 35 (41.7) | 55 (46.2) | 60 (46.9) | 0.74 | 0.48 |
Chronic HF | 68 (81) | 97 (81.5) | 107 (83.6) | 0.86 | 0.61 |
Ischemic etiology | 25 (29.8) | 38 (31.9) | 51 (39.8) | 0.25 | 0.11 |
Number of comorbidities | 4 (2.5–5) | 5 (3–6) | 4.5 (3–6) | 0.004 | 0.03 |
Hypertension | 55 (65.5) | 99 (83.2) | 107 (83.6) | 0.002 | 0.003 |
Coronary heart disease / myocardial infarction | 52 (61.9) | 82 (68.9) | 94 (73.4) | 0.21 | 0.08 |
Atrial fibrillation | 40 (47.6) | 79 (66.4) | 78 (60.9) | 0.03 | 0.09 |
Diabetes mellitus | 32 (38.1) | 35 (29.4) | 53 (41.4) | 0.14 | 0.47 |
Renal dysfunction | 22 (26.2) | 38 (31.9) | 37 (28.9) | 0.67 | 0.75 |
Thyroid disease | 21 (25) | 38 (31.9) | 33 (25.8) | 0.45 | 0.97 |
COPD / asthma | 16 (19.1) | 26 (21.9) | 26 (20.3) | 0.89 | 0.87 |
Cancer | 15 (17.9) | 36 (30.3) | 44 (34.4) | 0.03 | 0.01 |
Anemia | 13 (15.5) | 29 (24.4) | 26 (20.3) | 0.30 | 0.5 |
Stroke (any type) | 7 (8.3) | 19 (16) | 8 (6.3) | 0.03 | 0.42 |
Aortic stenosis | 4 (4.8) | 13 (10.9) | 15 (11.7) | 0.22 | 0.12 |
Liver failure | 3 (3.6) | 7 (5.9) | 4 (3.1) | 0.53 | 0.77 |
ACEI | 72 (87.8) | 101 (87.1) | 111 (87.4) | 0.99 | 0.95 |
BB | 79 (96.3) | 112 (96.6) | 116 (91.3) | 0.14 | 0.08 |
MRA | 53 (64.6) | 78 (67.2) | 79 (62.2) | 0.71 | 0.62 |
Diuretics | 63 (76.8) | 98 (83.8) | 103 (81.1) | 0.47 | 0.57 |
VKA/DOAC | 37 (45.1) | 70 (59.8) | 72 (56.7) | 0.11 | 0.18 |
Death during 5‑year follow‑up | 36 (42.9) | 49 (41.2) | 41 (32) | 0.19 | 0.09 |
Characteristic | T1 (n = 141) | T2 (n = 250) | T3 (n = 271) | P value (T1 vs T2 vs T3) | P value for trend |
Data are presented as number (percentage) or mean (SD) unless indicated otherwise.
Abbreviations: see Table 1 | |||||
Men | 70 (49.7) | 98 (39.2) | 123 (45.4) | 0.11 | 0.67 |
Age, y | 63 (15.19) | 71 (14.44) | 69 (15.83) | <0.001 | 0.001 |
Age >65 y | 61 (43.3) | 187 (74.8) | 182 (67.2) | <0.001 | <0.001 |
Emergency admission | 77 (54.6) | 154 (61.6) | 151 (55.7) | 0.28 | 0.92 |
Chronic HF | 117 (83.6) | 210 (84.3) | 226 (83.7) | 0.97 | 0.99 |
Ischemic etiology | 28 (19.9) | 55 (22) | 45 (16.6) | 0.29 | 0.3 |
Comorbidities, n, median (IQR) | 4 (2–5) | 5 (3–7) | 5 (3–6) | <0.001 | 0.001 |
Hypertension | 102 (72.3) | 215 (86) | 232 (85.6) | 0.001 | 0.003 |
Coronary heart disease / myocardial infarction | 77 (54.6) | 169 (67.6) | 173 (63.8) | 0.04 | 0.21 |
Atrial fibrillation | 81 (57.5) | 172 (68.8) | 174 (64.2) | 0.08 | 0.33 |
Diabetes mellitus | 37 (26.2) | 93 (37.2) | 92 (34) | 0.09 | 0.22 |
Renal dysfunction | 43 (30.5) | 103 (41.2) | 98 (36.2) | 0.1 | 0.46 |
Thyroid disease | 44 (31.2) | 89 (35.6) | 97 (35.8) | 0.61 | 0.4 |
COPD / asthma | 35 (24.8) | 77 (30.8) | 75 (27.7) | 0.44 | 0.71 |
Cancer | 32 (22.7) | 84 (33.6) | 117 (43.2) | <0.001 | <0.001 |
Anemia | 30 (21.3) | 73 (29.2) | 66 (24.4) | 0.19 | 0.74 |
Stroke (any type) | 11 (7.8) | 30 (12) | 36 (13.3) | 0.25 | 0.12 |
Aortic stenosis | 13 (9.4) | 46 (18.5) | 57 (21.1) | 0.01 | 0.005 |
Liver failure | 4 (2.8) | 7 (2.8) | 10 (3.7) | 0.82 | 0.59 |
ACEI | 104 (73.8) | 187 (75.4) | 192 (70.9) | 0.5 | 0.37 |
BB | 130 (92.2) | 228 (91.9) | 253 (93.4) | 0.81 | 0.59 |
MRA | 87 (61.7) | 135 (54.4) | 129 (47.6) | 0.02 | 0.006 |
Diuretics | 113 (80.1) | 206 (83.1) | 206 (76) | 0.14 | 0.15 |
VKA/DOAC | 79 (56) | 163 (65.7) | 166 (61.3) | 0.16 | 0.59 |
Death during 5‑year follow‑up | 63 (44.7) | 116 (46.4) | 103 (38) | 0.13 | 0.09 |
Heart failure phenotypes and patient demography
A 27% decrease in the prevalence of HFrEF and an increase in HFmrEF and HFpEF by 53% and 92%, respectively, were observed between T1 and T3, indicating a significant trend for changes. We observed no differences or trends in the prevalence of chronic HF cases or emergency admissions across the admission time, either in the entire study population or individual subgroups stratified by HF phenotype. Conversely, there was a significant decrease in the percentage of cases with ischemic etiology over successive time periods for the whole HF population, but not when stratified by HF phenotypes.
In addition, changes in demographic characteristics over time were found across the tertiles of admission time, showing an increase in the percentage of women in the overall HF population; however, after stratification by phenotype, this trend was not observed in the HFmrEF and HFpEF groups. Hospitalized patients aged 65 years or older were more prevalent across all tertiles in all HF subgroups.
Comorbidities and pharmacotherapy
The mean number of reported comorbidities increased across the successive tertiles of admission time, with similar trends for all HF phenotypes. A significant and unfavorable trend was observed in the changes between T1 and T3 for several conditions, including hypertension (increase by 19%), atrial fibrillation (increase by 11%), anemia (increase by 45%), COPD / asthma (increase by 18%), aortic stenosis (increase by 113%), and cancer (increase by 104%). Of note, while hypertension and cancer prevalence increased significantly in all HF phenotypes, the changes for other comorbidities were less prominent when stratified by phenotypes. Among the comorbidities analyzed, only liver failure demonstrated a significant decrease in prevalence over time (by 33%), but the trend was mainly driven by changes in HFrEF prevalence.
In terms of pharmacotherapy trends, we observed a decrease in the frequency of use of angiotensin‑converting enzyme inhibitors (ACEIs), mineralocorticoid antagonists (MRAs), and diuretics, but not for β-blockers, across the tertiles of admission time for all patients with HF. Stratification by phenotype showed that differences in ACEI, MRA, and diuretic use occurred primarily in the patients with HFrEF. With respect to anticoagulant use, there were no significant differences between the time periods, either for the whole HF group or individual HF phenotypes.
Survival trends
Mortality rate assessment among the patients admitted to a hospital at different time points showed a significant association between later admission periods and a reduced risk of death, as compared with the risk observed in the patients admitted at the beginning of the observation period. The mortality rate declined by 23% between T1 and T3. However, stratification by phenotype revealed a significant trend only in the HFrEF subgroup.
The Kaplan–Meier survival curves for the whole study population and for the subgroups stratified by HF phenotypes are presented in Figure 1. Analysis of 5‑year survival for the overall HF population demonstrated a more favorable course for patients admitted in T3, as compared with those admitted in T1 or T2 (Figure 1A). In the subgroup analysis, a difference in survival between T1 and T2 and between T1 and T3 was observed for the HFrEF patients (Figure 1B), whereas for the HFmrEF and HFpEF patients, no significant differences were noted (Figure 1C and 1D).
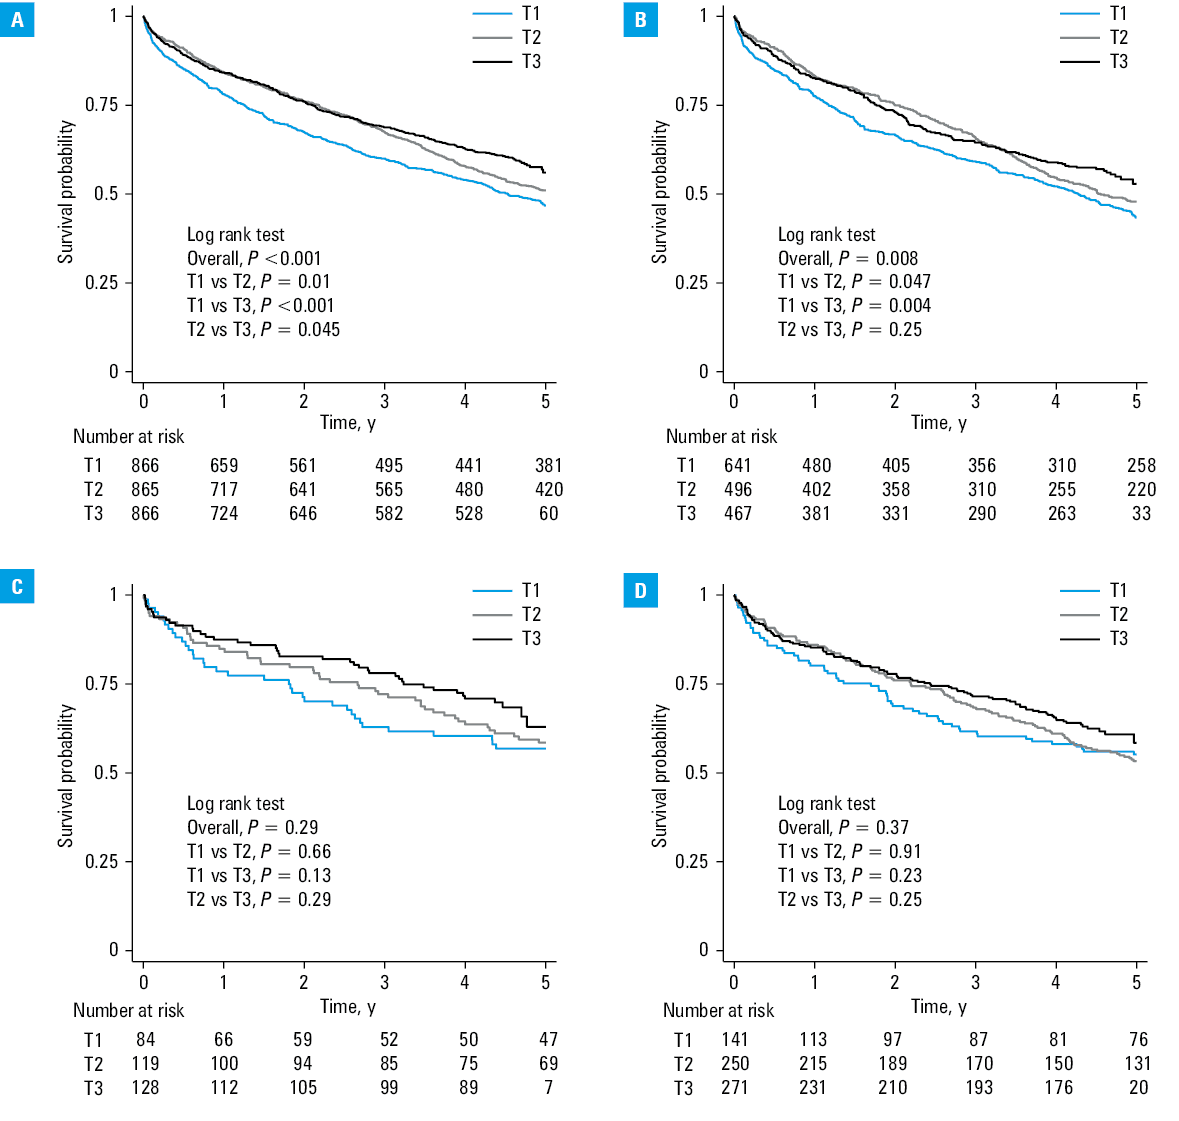
Abbreviations: see Table 1
In the multivariable Cox proportional hazards analysis, this association remained significant after adjusting for potential confounding factors, including HF phenotype, sex, age, HF etiology, number of comorbidities, and treatment with ACEIs, MRAs, or diuretics (Figure 2).
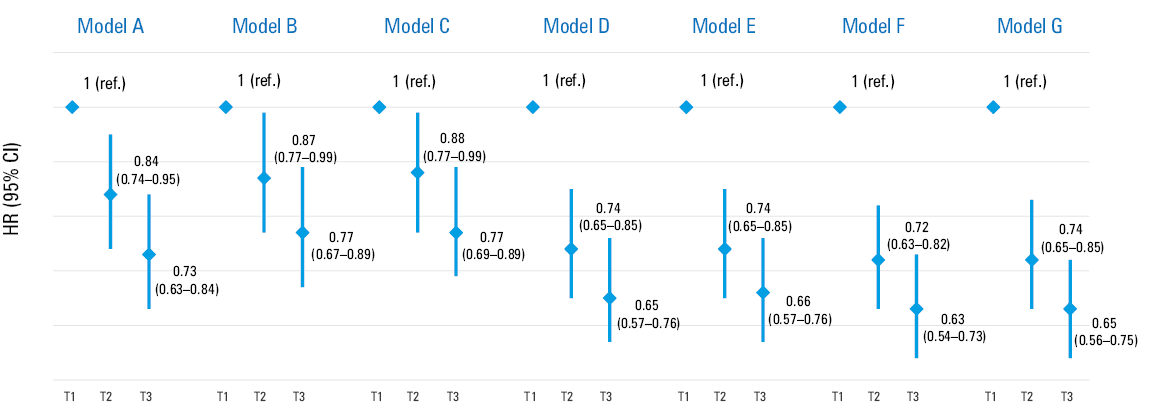
Abbreviations: HR, hazard ratio; ref, reference; others, see Table 1
Given the fact that the strongest changes in prognosis were noted for the HFrEF subgroup, we performed additional Cox proportional hazards analyses exclusively for the patients with this phenotype. The results are presented in Supplementary material, Table S1, and closely resemble those observed in the entire population, further confirming the reliability of our results after adjusting for phenotype.
Discussion
In our study, encompassing the period from 2014 to 2019, we observed significant trends for an increased prevalence of HFpEF and HFmrEF at the expense of HFrEF. This phenomenon was accompanied by a growing comorbidity burden, aging of the population, and changes in sex distribution. Irrespective of the changes in patient characteristics, the participants hospitalized in T2 and T3 demonstrated longer survival.
Phenotype trends
Consistent with most publications, we observed a gradual shift in phenotype prevalence, with an increasing HFpEF frequency, primarily at the expense of HFrEF,8-11 although reports are not uniform.12 This trend may be due to improved HF diagnosis and treatment in older populations, which previously often remained underdiagnosed.8,13 The precise recognition of HFpEF appeared relatively late in HF guidelines.7 As noted elsewhere, the observed change in HF phenotype distribution may result from population aging and a higher proportion of women in later phases of the study.14 The higher proportion of patients with comorbidities in subsequent tertiles warrants consideration. Most publications highlight the increasing rate of individuals with multimorbidity, with hypertension being the most frequent.8,10-18 A growing comorbidity burden can lead to HFpEF. This phenotype may also be favored by aging and changes in sex distribution.3,12,13 An increase in the rate of HFmrEF, based on the literature, may be due to improved care for HFrEF patients, whose EF improves over time. While we lack evidence for this concept, it is supported by reports of patients transitioning from their baseline category,5 and showing better survival.19
Most studies on temporal trends are based on the general HF population, without phenotypic stratification.10,11,13,16,17 The HF population is becoming older across all phenotypes.8,9,11,12,17,20 This may be due to improved diagnostic procedures and longer life expectancy.11 In our analysis, the proportion of women, often underrepresented in HF studies, increased over time, contrary to some reports.13,14,16,17 However, such trends were observed in other studies analyzing HF phenotypes.20 Changes in sex distribution may also be attributable to the improved survival rates of women with HF.12,20
The increasing burden of comorbidities across individual phenotypes aligns with accepted trends.12-14 Conditions such as hypertension and atrial fibrillation, reported in most HF cases, may predispose patients to HFpEF.9,13,14,16 We found an increased prevalence of COPD and anemia (mainly in HFrEF), while aortic stenosis was the most frequent in HFpEF.8,10 The latter may be due to the older age of patient admitted in subsequent tertiles. Notable changes occurred in malignant neoplasm prevalence across all HF phenotypes; this finding is likely beyond the population aging trends.13,14 Other studies either did not report the prevalence of malignancies or showed different results.8,9,11,12,17 The increase in cancer prevalence may result from implementation of an early detection program in Poland in 2015, broader anticancer therapy use, and awareness of cardiac side effects of medications. Unlike in other literature reports, the prevalence of diabetes mellitus and renal disease remained stable.12,20 A decline in liver failure markers in HFrEF may be due to fewer complications from right ventricular HF, resulting from improved treatment. While the HF subgroups analyzed in our study were comparable in terms of clinical characteristics, the findings may not be broadly applicable, as they come from a tertiary cardiology hospital.
Pharmacotherapy trends
A clear stratification of HF by phenotypes with respect to recommended pharmacotherapy appeared for the first time in 2016, with the suggestion of angiotensin receptor neprilysin inhibitors (ARNIs) to be used in HFrEF. Until 2019, there were no strong recommendations with respect to pharmacotherapy for HFmrEF and HFpEF, but this has since changed. Precise treatment guidelines for HFrEF, HFmrEF, and HFpEF, and the implementation of flozins in HFrEF appeared in 2021.21
Contrary to expectations, our study showed a decrease in ACEI, MRA, and diuretics use in the whole HF group. This is in line with some studies reporting no difference or a decrease.9,11,12,22 In contrast, most publications reported increased use of standard therapies.15,18,23 The higher prevalence of HFpEF and HFmrEF in the later phases of the study does not explain our findings regarding changes in pharmacotherapy, as the observed downward trend was limited to the patients with HFrEF, and additionally concerned changes in MRA use in HFpEF.
Since only a few patients with HFrEF were treated with ARNIs and none received sodium‑glucose cotransporter 2 inhibitors, these factors cannot account for the observed reduced use of the other HF medications.
The overall pattern of pharmacotherapy changes is also difficult to explain based on comorbidities, as the temporal trends in the prevalence of conditions such as hypertension, pulmonary disease, and renal dysfunction do not justify our observations.
Other authors also failed to provide a clear explanation for similar findings.
Survival
The survival curves for the whole HF population showed a pattern consistent with previously reported improvements in outcomes over time.8,11,16,17,20 However, some studies showed no differences in survival over longer observation periods.9 As the comorbidity burden increased in subsequent tertiles, improvement of comorbidity therapy must have been significant.16 For HFrEF, survival improvement was less pronounced between the last tertiles, in line with other reports.12 For HFmrEF and HFpEF, survival curves showed no differences between the tertiles, confirming previous findings.20 The differences across phenotypes might result from variations in the number of comorbidities, which remain a management concern and the leading cause of death in HFpEF.12,24 We have previously demonstrated that comorbidities play a significant prognostic role.25 Comorbidity burden has been shown to be the main cause of worse survival in HF.16
In our study, in terms of clinical features, HFmrEF was more similar to HFpEF than to HFrEF.6 Life‑saving medications were only used in HFrEF, with lacking data for HFmrEF and HFpEF.7 Multivariable survival analysis uniformly confirmed improvement over subsequent tertiles after adjusting for phenotypes, sex, age, HF etiology, and pharmacotherapy. Age and comorbidities exerted the most significant modifying effects. This confirms our previous finding emphasizing the need to analyze various characteristics of HF patients beyond general features, such as etiology and age.26
Limitations
Our study had some limitations. First, it was a single‑center analysis. We retrospectively included patients whose admission was coded as a HF hospitalization for administrative purposes, and their HF diagnosis was later verified. Therefore, it is possible that some hospitalizations that were not coded as HF admissions were missed. At the commencement of the observation period, there were fewer HF hospitalizations than in the later period, yielding an uneven observation time in the established tertiles.
As this was a retrospective study, the assessment of EF was based solely on available data from hospital documentation, and there was no procedural protocol to standardize the echocardiography results; therefore, we cannot exclude some imprecision leading to possible misclassification of patients into the EF groups. In addition, it should be underlined that during the study period, the rate of HFpEF diagnosis in general has increased significantly.
Finally, objective evaluation of the clinical status of all patients was impossible due to a lack of relevant data; therefore, we were unable to provide information on the New York Heart Association classification. Moreover, the available documentation lacked information on body weight and lifestyle habits. The comorbidity status was established based on medical records, but it was not verified using objective criteria.
Conclusions
During the study period, among the analyzed population hospitalized for HF, the percentage of patients with HFpEF and HFmrEF increased across successive tertiles of admission time, while the percentage of patients with HFrEF decreased. Additionally, we showed an increase in the proportion of women with HF and in patient age, along with a growing burden of comorbidities. This shift underscores the need for targeted therapeutic strategies, and highlights the evolving landscape of HF management, reflecting broader demographic changes and improvements in diagnostic capabilities.
The survival rate of patients with HF improved across the analyzed time periods; however, this improvement was primarily driven by better outcomes in the patients with HFrEF. Nevertheless, in the multivariable model, the observed improvement over time was independent of age, etiology, sex, phenotype frequency, and presence of comorbidities.
- Lippi G, Sanchis‑Gomar F. Global epidemiology and future trends of heart failure. AME Med J. 2020; 5: 15. | Crossref
- Groenewegen A, Rutten FH, Mosterd A, Hoes AW. Epidemiology of heart failure. Eur J Heart Fail. 2020; 22: 1342‑1356. | Crossref
- Juillière Y, Venner C, Filippetti L, et al. Heart failure with preserved ejection fraction: a systemic disease linked to multiple comorbidities, targeting new therapeutic options. Arch Cardiovasc Dis. 2018; 111: 766‑781. | Crossref
- Pellicori P, Khan MJI, Graham FJ, Cleland JGF. New perspectives and future directions in the treatment of heart failure. Heart Fail Rev. 2020; 25: 147‑159. | Crossref
- Savarese G, Stolfo D, Sinagra G, Lund LH. Heart failure with mid‑range or mildly reduced ejection fraction. Nat Rev Cardiol. 2022; 19: 100‑116. | Crossref
SUPPLEMENTARY MATERIAL
ARTICLE INFORMATION