Joint association of body mass index and lipoprotein(a) with atrial fibrillation prevalence: an observational and Mendelian randomization study
Key words: atrial fibrillation, body mass index, lipoprotein(a), Mendelian randomization

 CC BY 4.0
Joint association of body mass index and lipoprotein(a) with atrial fibrillation prevalence: an observational and Mendelian randomization study
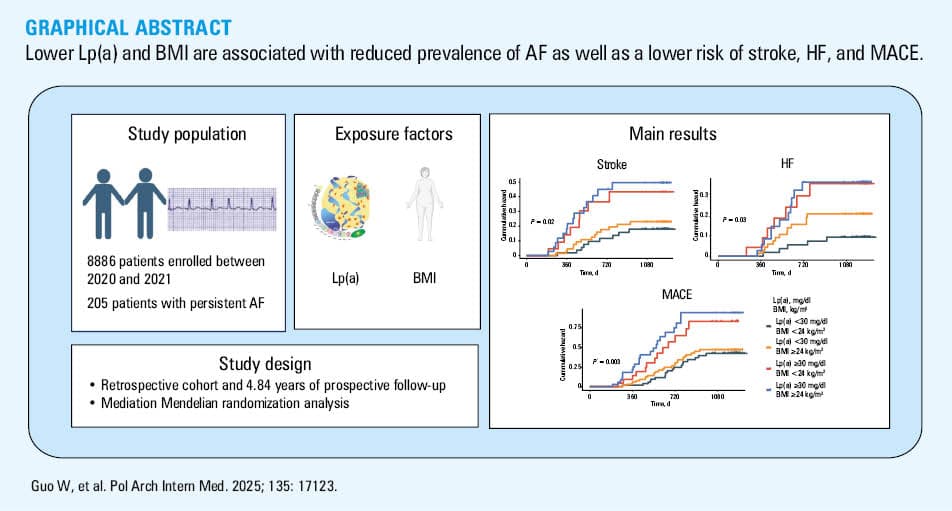
Introduction: Although previous studies have demonstrated that lipoprotein(a) (Lp[a]) and body mass index (BMI) are associated with atrial fibrillation (AF), their joint effect on AF remains poorly understood.
Objectives: Our primary objective was to examine the combined influence of BMI and Lp(a) on AF occurrence.
Patients and methods: The study included 8886 patients, among whom 205 were diagnosed with persistent AF. The joint association of BMI and Lp(a) with AF was evaluated. A mediation Mendelian randomization (MR) analysis was also performed.
Results: In comparison with the individuals with a higher Lp(a) level (≥30 mg/dl) and BMI equal to or above 24 kg/m2, those with a lower Lp(a) level and BMI had the lowest prevalence of AF (odds ratio, 0.96; 95% CI, 0.95–0.97; P <0.001), especially at the age of 50–69 years, and the lowest risk of stroke (hazard ratio [HR], 0.28; 95% CI, 0.12–0.68; P = 0.004), heart failure (HF; HR, 0.24; 95% CI, 0.08–0.66; P = 0.006), and major adverse cardiovascular events (MACE; HR, 0.35; 95% CI, 0.18–0.66; P = 0.001). Mediation MR analysis highlighted the coexposure effects of Lp(a) levels and BMI on AF and their independent influence on AF development.
Conclusions: Lower BMI and Lp(a) levels were associated with a reduced prevalence of AF as well as a lower risk of stroke, HF, and MACE. Mediation analysis showed that neither BMI nor Lp(a) mediated the effect of the other, suggesting that their contributions to AF risk operate through independent pathways.
What's new?
While previous studies have primarily focused on examining the isolated effects of lipoprotein(a) (Lp[a]) and body mass index (BMI) on atrial fibrillation (AF), our study is the first to investigate their synergistic relationship with AF risk. We found that lower Lp(a) levels combined with lower BMI were associated with a reduced risk of AF, a lower risk of stroke, heart failure, and major adverse cardiovascular events, and improved clinical prognosis. Mediation analyses confirmed that both factors independently influenced AF development, unaffected by traditional cardiovascular risk factors. Notably, this joint effect was most pronounced in individuals aged 50–69 years. Our findings emphasize the clinical importance of integrating Lp(a) and BMI assessments in residual risk stratification and optimizing primary prevention strategies in AF management.
Introduction
Atrial fibrillation (AF) is a common arrhythmia characterized by rapid and irregular electrical activity in the atria, which prevents them from contracting effectively, thus affecting the normal function of the heart. In individuals with AF, the electrical signals in the atria are highly chaotic and cannot be transmitted to the ventricles in a normal rhythm, resulting in an asynchronous contraction of the atria and ventricles.1 The condition includes paroxysmal AF, persistent AF, and permanent AF.2 In patients with AF, the risk of stroke, heart failure (HF), and death is significantly greater, making arrhythmia prevention particularly important.3,4
Lipoprotein(a) (Lp[a]) is a structure formed by the linkage of apolipoprotein(a) and apolipoprotein B‑100 through disulfide bonds.5 Lp(a) levels are highly heritable, with up to 90% of the variation in its concentrations attributed to the LPA gene locus alone.6 A cross‑sectional population study7 provided a detailed distribution of Lp(a) levels, showing that in 27.8% of the participants its concentrations exceeded 30 mg/dl, while in 1.5% it was above 100 mg/dl. Recent studies have shown that Lp(a) is an independent cardiovascular risk factor.8 Elevated Lp(a) levels have been associated with factors such as female sex, AF, hyperlipidemia, hypertension, and higher glycated hemoglobin (HbA1c) and low‑density lipoprotein cholesterol (LDL‑C) levels, underscoring its importance in cardiovascular risk assessment.8 Also, among Polish patients, 21.5% were found to have elevated Lp(a) levels.8 Published guidelines and consensus statements have defined serum Lp(a) concentrations greater than 30 mg/dl as hyperlipoproteinemia(a), and recommended screening to lower the Lp(a)-mediated risk of cardiovascular events.9 Lp(a) can contribute to thrombosis by affecting platelet function and the coagulation system, leading to thromboembolic events.10 Elevated Lp(a) levels are associated with earlier‑onset coronary artery disease and more severe progression of cardiovascular disease (CVD).11 However, the mechanisms by which Lp(a) is potentially associated with AF are not clear. Many studies have explored the relationship between Lp(a) levels and AF, but the results are not entirely consistent.12 Body mass index (BMI) is the benchmark commonly used to assess and define obesity and healthy weight.13 Gao et al14 suggested that the cutoff for being overweight in the Chinese population was typically defined as BMI equal to or above 24 kg/m². Previous studies have shown that both high and low BMI can lead to AF.15,16 At present, no studies have elucidated the effect of the interaction between BMI and Lp(a) levels on AF incidence.
To address this gap, we conducted an observational study examining the combined effects of BMI and Lp(a) levels on AF occurrence. Additionally, we utilized Mendelian randomization (MR) to explore the mutual mediating effects of BMI and Lp(a) levels and the development of AF.
Patients and methods
Study population
This was a retrospective cohort study with prospective follow‑up. All data were collected from the electronic medical record system of the Third Affiliated Hospital of Soochow University, including all consecutive patients who met the inclusion criteria between January 2020 and December 2021. The MR analysis was based on the data from the Genome‑Wide Association Study (GWAS) database (https://www.ebi.ac.uk/gwas/).
Definition and diagnosis of atrial fibrillation
The patient data were obtained from medical records, with electrocardiography (ECG) serving as the gold standard for diagnosing AF.17 AF was diagnosed based on the 2024 European Society of Cardiology guidelines, which required the absence of discrete P waves, replaced by fibrillatory waves with a frequency of 350–600 bpm, along with a completely irregular RR interval. The diagnosis was confirmed on either a standard 12‑lead ECG or Holter monitoring, with an episode lasting for at least 30 seconds.18,19
Clinical and laboratory analyses
General information was collected, including age, sex, BMI, alcohol consumption, smoking status, systolic blood pressure (SBP), diastolic blood pressure (DBP) and self‑reported health conditions (hypertension, diabetes, stroke, HF, and coronary heart disease). The recorded laboratory data included total cholesterol (TC), total triglyceride (TG), LDL‑C, high‑density lipoprotein cholesterol (HDL‑C), blood glucose, creatinine, BMI, Lp(a), uric acid, urea, aspartate aminotransferase (AST), alanine aminotransferase (ALT), and estimated glomerular filtration rate (eGFR). Enzymatic colorimetric methods were used to measure TC, TG, LDL‑C, HDL‑C, AST, ALT, serum creatinine, urea, uric acid, and blood glucose. Lp(a) levels were measured using an immunoturbidimetric assay. All biochemical assays were run using the Beckman Coulter AU5800 system (Beckman Coulter, Brea, California, United States).
The Lp(a) concentration was measured after an over 8‑hour fast. In addition, the lipid profile (HDL‑C, LDL‑C, TG, and TC), blood glucose, and biochemical parameters (uric acid, urea, creatinine, AST, and ALT) were measured after an overnight fast of at least 8 hours.
Follow‑up and outcomes
Follow‑up data were collected by skilled researchers through patient visits to the clinic, phone conversations with the patients or their family members, or medical records. This procedure was continued until the patient died or until October 2024. Median (interquartile range [IQR]) follow‑up duration was 3.54 years (3.21–3.99). Adverse outcomes included death, major adverse cardiovascular events (MACEs), stroke, and HF. Deaths were classified as cardiovascular death (sudden / cardiac arrhythmia death, HF, myocardial infarction, stroke, pulmonary embolism, and other cardiovascular‑related causes) and noncardiovascular death (respiratory failure, infection, trauma, and other causes). The primary outcome of this study were MACEs, whereas the secondary outcomes included stroke and HF.
Mediated Mendelian randomization analysis
To select the relevant single nucleotide polymorphisms (SNPs), we set a genome‑wide significance threshold of P below 5 × 10⁻⁸. F statistics were generated to explore the possibility of weak instrument bias. For the instrumental SNPs selected in this MR study, those above the recommended threshold of F above 10 were included in the analysis. To minimize the bias due to linkage disequilibrium (LD), we selected the SNPs associated with the exposure that met the criteria of r² below 0.001 and a physical distance greater than 10 000 kb.20 We predominantly employed the random effects inverse variance weighted (IVW) analysis method to determine the causal relationship between the exposure and outcome. Moreover, weighted median, simple mode, and weighted mode methods were used as auxiliary analysis methods.21 In addition, we used the global test in MR pleiotropy residual sum and outlier to determine the presence of pleiotropy. The MR‑Egger method was used as an additional sensitivity analysis to quantify potential directional pleiotropy from the intercept (P <0.05 was considered significant). The Cochran Q test was utilized to test for heterogeneity, and a P value below 0.05 was considered to indicate heterogeneity. If heterogeneity existed, we used IVW analysis with random effects to conduct the study.22 In the MR analysis, P below 0.05 indicated a significant causal relationship between the exposure and outcome. The mediating effect was calculated as follows: β = β(XZ) × β(ZY), where X was Lp(a) level used as a predictor variable, Z was BMI used as a mediator, and Y was an AF event was used as the outcome variable. The proportion of the total effect accounted for by the mediating effect was calculated as follows: R = β/β(XY) × 100%. After correction for confounders, the effect of the exposure on the outcome was considered a direct effect, and the direct effect was calculated as β(XY) – β.
Statistical analysis
Continuous variables with normal distribution are described as means and SD, while variables that did not follow normal distribution are presented as medians and IQRs. The data were first categorized on the basis of AF groups. Then, baseline characteristics were summarized according to joint assessment of BMI (cutoff of 24 kg/m2) and Lp(a) level (cutoff of 30 mg/dl) and compared among participants in 4 groups (Lp[a] <30 mg/dl and BMI <24 kg/m2; Lp[a] <30 mg/dl and BMI ≥24 kg/m2; Lp[a] ≥30 mg/dl and BMI <24 kg/m2; and Lp[a] ≥30 mg/dl and BMI ≥24 kg/m2). Continuous variables were tested for normality using the Shapiro–Wilk test. For continuous variables that were normally distributed, we used the t test to compare differences between 2 groups. For continuous variables that were not normally distributed, we used the Wilcoxon rank‑sum test to compare differences between 2 groups. For comparisons involving more than 2 groups, we employed the Kruskal–Wallis test. When the Kruskal–Wallis test indicated significant differences, we used the Dunn test with the Bonferroni correction. For categorical variables, we first determined whether the expected frequency was greater than 5. If the expected frequency was below 5, the Fisher exact test was used. Otherwise, the χ2 test was applied for binary or unordered multicategorical variables. In addition, the categorical variables expressed as counts or percentages were analyzed using the same statistical approaches described above. Logistic regression models were employed to examine the hypotheses and and assess the prevalence of AF in these 4 groups. Moreover, subgroup analyses were conducted by age group: 18–49 years, 50–69 years, and 70 years or more. Sensitivity analyses were conducted as follows: all analyses were repeated with the complete dataset (8886 participants). Age (continuous) and sex were adjusted for in Model 1, and in Model 2, sex, age, LDL‑C, HDL‑C, hypertension status (yes, no) and blood glucose level were further adjusted for. We subsequently evaluated the effect of Lp(a) on AF‑related events stratified by BMI, and vice versa. Survival analysis involved the use of Kaplan‒Meier curves to estimate cumulative event rates among the patients with AF. Comparisons were made using the log‑rank test, and the Cox proportional hazard models were employed for survival analysis. We constructed a novel model to assess the prognosis of AF, including evaluating its ability to predict stroke, HF, and MACEs.
We conducted a mediation MR analysis to assess the direct and indirect associations between Lp(a) and AF‑related events via BMI. In brief, Lp(a) was used as a predictor variable (X), BMI was used as a mediator (Z), and an AF event was used as the outcome variable (Y). Moreover, the mediating effect of BMI on AF‑related events through Lp(a) was evaluated in a similar manner.
The statistical analyses were performed with R software, version 4.3.1 (R Foundation for Statistical Computing, Vienna, Austria). A P value below 0.05 was considered significant.
Ethics
The study protocol was reviewed and approved by the Ethics Committee of the Third Affiliated Hospital of Soochow University (2025‑CL027‑01). All participants provided their written informed consent.
Results
Patient characteristics
A total of 8886 adult patients with complete Lp(a) data were included in the final analysis. The study group included 205 patients with persistent AF, and the control group included 8681 patients without AF. After excluding the patients lost to follow‑up and considering visit timing, 183 individuals with persistent AF were ultimately included (Figure 1). The baseline characteristics of the patients with their AF status are summarized in Table 1. As compared with the non‑AF group, the AF group had a greater proportion of men, was older, and was more susceptible to hypertension. However, the non‑AF group presented higher TC, LDL‑C, HDL‑C, and TG values. The indices for all other clinical attributes are presented in Table 1. We followed 183 patients with AF, who were categorized by BMI and Lp(a) level. The baseline characteristics of these groups can be found in Table 2.
![Association between lipoprotein(a) (Lp[a]) level, body mass index (BMI), and atrial fibrillation in the age groups of 18–49 y (n = 5325), 50–69 y (n = 3089), and 70 y and over (n = 472)
Model 1: adjusted for age and sex; Model 2: adjusted for age, sex, low-density lipoprotein cholesterol, high-density lipoprotein cholesterol, hypertension status, and blood glucose level
Abbreviations: see Tables 1 and 2](/paim/_next/image/?url=https%3A%2F%2Fpamw.pl%2Fsites%2Fdefault%2Ffiles%2Fjson_zip_files%2Funcompressed%2F17123%2FIMAGES%2FKP_WEB__FIG_01.png&w=3840&q=75)
Abbreviations: AF, atrial fibrillation
Characteristics | Non‑AF (n = 8681) | AF (n = 205) | P value |
Data are expressed as number and percentage or median and interquartile range.
SI conversion factors: to convert ALT and AST to μkat/l, multiply by 0.0167; TC, LDL‑C, and HDL‑C to mmol/l, by 0.0259; TG, to mmol/l, by 0.0113; creatinine to μmol/l, divide by 88.4
Abbreviations: ALT, alanine aminotransferase; AST, aspartate aminotransferase; BG, blood glucose; BMI, body mass index; DBP, diastolic blood pressure; eGFR, estimated glomerular filtration rate; HDL‑C, high‑density lipoprotein cholesterol; LDL‑C, low‑density lipoprotein cholesterol; Lp(a), lipoprotein(a); SBP, systolic blood pressure; TC, total cholesterol; TG, triglyceride; others, see Figure 1 | |||
Men | 4865 (56) | 127 (62) | <0.001 |
Age, y | 45 (35–55) | 69 (60–75) | <0.001 |
BMI, kg/m2 | 23.8 (21.7–26.2) | 24.6 (22–26.6) | 0.03 |
Hypertension | 3943 (45.4) | 132 (64.4) | <0.001 |
Diabetes | 559 (6.4) | 33 (16.1) | <0.001 |
Obesity | 1094 (12.6) | 24 (11.7) | 0.01 |
SBP, mm Hg | 125 (113–137) | 132 (121–142) | <0.001 |
DBP, mm Hg | 75 (68–82) | 78 (70–85) | 0.001 |
eGFR, ml/min/1.73 m2 | 103.2 (93.7–112) | 105.9 (98.2–113.9) | <0.001 |
Lp(a), mg/dl | 9.5 (4.7–21) | 22.1 (12.2–33.8) | <0.001 |
HDL‑C, mg/dl | 49.8 (42.5–59.1) | 45.2 (38.6–51.7) | <0.001 |
LDL‑C, mg/dl | 112.7 (94.2–133.2) | 91.5 (72.9–110.4) | <0.001 |
TC, mg/dl | 197.3 (174.1–222) | 154.8 (134–179.5) | <0.001 |
TG, mg/dl | 120.3 (84.1–179.6) | 104.4 (78.7–136.3) | <0.001 |
Creatinine, mg/dl | 0.72 (0.62–0.81) | 0.77 (0.67–0.86) | <0.001 |
BG, mmol/l | 5.18 (4.85–5.61) | 6.61 (5.68–8.26) | <0.001 |
Uric acid, μmol/l | 334.6 (267.7–397.5) | 354.7 (300.6–415.1) | <0.001 |
Urea, mmol/l | 4.73 (4.72–5.5) | 5.06 (4.23–5.97) | <0.001 |
AST, U/l | 21.7 (18.3–26.1) | 20.6 (17.3–26) | 0.06 |
ALT, U/l | 19.8 (14–29.6) | 19 (12.8–29.7) | 0.24 |
Lp(a) and BMI groups | |||
Lp(a) <30 mg/dl and BMI <24 kg/m2 | 3748 (43.2) | 62 (30.2) | <0.001 |
Lp(a) <30 mg/dl and BMI ≥24 kg/m2 | 3583 (41.3) | 80 (39) | |
Lp(a) ≥30 mg/dl and BMI <24 kg/m2 | 761 (8.8) | 26 (12.7) | |
Lp(a) ≥30 mg/dl and BMI ≥24 kg/m2 | 588 (6.8) | 37 (18) | |
Characteristics | Lp(a) <30 mg/dl and BMI <24 kg/m2 (n = 55) | Lp(a) <30 mg/dl and BMI ≥24 kg/m2 (n = 69) | Lp(a) ≥30 mg/dl and BMI <24 kg/m2 (n = 23) | Lp(a) ≥30 mg/dl and BMI ≥24 kg/m2 (n = 36) | P value |
Data are expressed as number and percentage or median and interquartile range.
SI conversion factors: to convert LAD to m, divide by 1000; LAV to m3, by 106; others, see Table 1
Abbreviations: CHD, coronary heart disease; EF, ejection fraction; LAD, left atrial diameter; LAV, left atrial volume; others, see Table 1 | |||||
Men | 34 (61.8) | 44 (63.8) | 8 (34.8) | 23 (63.9) | 0.08 |
Age, y | 71 (61–76) | 68 (60–74) | 69 (67.5–76) | 68.5 (59.8–76.2) | 0.23 |
BMI, kg/m2 | 21.5 (20–22.4) | 26.3 (25.4–27.7) | 21.6 (20.7–23.2) | 26.1 (25.4–27.4) | <0.001 |
Hypertension | 36 (65.5) | 42 (60.9) | 16 (69.6) | 26 (72.2) | 0.67 |
CHD | 13 (23.6) | 25 (36.2) | 10 (43.5) | 13 (36.1) | 0.29 |
Diabetes | 8 (14.5) | 11 (15.9) | 3 (13) | 7 (19.4) | 0.91 |
Obesity | 0 | 16 (23.2) | 0 | 4 (11.1) | <0.001 |
Smoking | 13 (23.6) | 13 (18.8) | 5 (21.7) | 5 (13.9) | 0.71 |
Alcohol consumption | 9 (16.4) | 13 (18.8) | 3 (13) | 6 (16.7) | 0.93 |
LAD, mm | 41 (38–46) | 44 (40–47) | 45 (40–48.5) | 43 (37.8–47) | 0.36 |
EF, % | 60 (54.5–64) | 60 (55–63) | 58 (51.5–62) | 61 (54.7–64.2) | 0.74 |
LAV, ml | 73 (57.5–96) | 82 (68–104) | 78 (60.5–92.5) | 73.5 (58–98) | 0.24 |
Lp(a), mg/dl | 19.3 (12.5–24.4) | 13.6 (8.2–20.5) | 40.3 (37.4–46) | 44.4 (36.6–56.9) | <0.001 |
HDL‑C, mg/dl | 47.9 (39.8–53.9) | 41.7 (37.8–51.4) | 45.2 (39.4–51.2) | 45 (39.4–51.1) | 0.48 |
LDL‑C, mg/dl | 81.1 (64.9–103.5) | 96.9 (74.9–122.4) | 78 (61.4–106.9) | 87.6 (73.3–106.2) | 0.09 |
TC, mg/dl | 150.2 (129.9–177.4) | 161.8 (137.8–189.6) | 144 (125.9–176.4) | 154.6 (134.8–180) | 0.17 |
TG, mg/dl | 85.8 (61.5–111.5) | 109.7 (85.8–152.2) | 93.8 (78.8–113.7) | 105.8 (81.4–170.1) | 0.01 |
Uric acid, μmol/l | 363.3 (319.7–432.2) | 347.2 (276.9–399.3) | 332.8 (297.7–395.2) | 372.9 (322.9–415.2) | 0.2 |
Urea, mmol/l | 4.8 (4.2–5.7) | 5.1 (4.3–6.1) | 5.4 (4.2–5.7) | 5.3 (4.4–6) | 0.34 |
eGFR, ml/min/1.73 m2 | 107.4 (102.5–117.6) | 105.7 (97.6–113.5) | 100 (95.6–114.7) | 105.5 (97.1–112.9) | 0.14 |
Creatinine, mg/dl | 0.78 (0.75–0.85) | 0.73 (0.67–0.86) | 0.77 (0.68–0.85) | 0.75 (0.64–0.81) | 0.78 |
AST, U/l | 20.8 (17.2–28.9) | 20.2 (17.9–26.6) | 22.1 (18.9–25.6) | 17.4 (14.9–24.2) | 0.65 |
ALT, U/l | 20.7 (13.8–38.1) | 17.1 (12.7–27.2) | 17.9 (11.3–26.4) | 14.3 (11.4–23) | 0.57 |
Relationship of the lipoprotein(a) level and body mass index with atrial fibrillation
The associations of the Lp(a) level and BMI with AF‑related events are shown in Table 3. After adjusting for potential confounders (in Model 2), decreased Lp(a) levels alone, decreased BMI values alone, and decreased both Lp(a) levels and BMI values were independently associated with by 4%, 4%, and 2% lower risk of AF than high Lp(a) levels and BMI.
Variable | Model 1 | Model 2 | ||
OR (95% CI) | P value | OR (95% CI) | P value | |
Model 1: adjusted for age and sex; Model 2: adjusted for age, sex, LDL‑C level, HDL‑C level, hypertension status, and blood glucose level
Abbreviations: OR, odds ratio; others, see Table 1 | ||||
Lp(a) <30 mg/dl and BMI <24 kg/m2 (n = 3810) | 0.97 (0.96–0.98) | <0.001 | 0.96 (0.95–0.97) | <0.001 |
Lp(a) <30 mg/dl and BMI ≥24 kg/m2 (n = 3663) | 0.97 (0.95–0.98) | 0.001 | 0.96 (0.95–0.97) | <0.001 |
Lp(a) ≥30 mg/dl and BMI <24 kg/m2 (n = 787) | 0.97 (0.96–0.99) | 0.007 | 0.98 (0.96–0.99) | 0.004 |
Lp(a) ≥30 mg/dl and BMI ≥24 kg/m2 (n = 626) | Ref | Ref | ||
Regardless of the Lp(a) level, the participants with lower BMI had a significantly decreased risk of AF events. Similarly, the participants with lower Lp(a) levels had a significantly decreased prevalence of AF‑related events independent of BMI, as shown in Table 4. In terms of age groups, the coexposure effects of the Lp(a) level and BMI tended to be predominant among the individuals aged 50–69 years, as shown in Figure 2. This means that the patients were more likely to develop AF during these decades of life (Supplementary material, Table S1).
Variable | Model 1 | Model 2 | |||
OR (95% CI) | P value | OR (95% CI) | P value | ||
Scenario 1: effect of BMI on AF according to the Lp(a) group; Scenario 2: effect of Lp(a) level on AF according to the BMI group
Model 1: adjusted for age and sex; Model 2: adjusted for age, sex, LDL‑C level, HDL‑C level, hypertension status, and blood glucose level
| |||||
Scenario 1: Lp(a) of 30 mg/dl | |||||
Lp(a) <30 mg/dl (n = 7473) | BMI <24 kg/m2 | 0.99 (0.98–0.99) | 0.01 | 0.99 (0.98–0.99) | 0.007 |
BMI ≥24 kg/m2 | Ref | Ref | |||
Lp(a) ≥30 mg/dl (n = 1413) | BMI <24 kg/m2 | 0.98 (0.96–1) | 0.12 | 0.97 (0.95–0.99) | 0.02 |
BMI ≥24 kg/m2 | Ref | Ref | |||
Scenario 2: BMI of 24 kg/m2 | |||||
BMI <24 kg/m2 (n = 4597) | Lp(a) <30 mg/dl | 0.97 (0.96–0.98) | <0.001 | 0.99 (0.98–0.99) | <0.001 |
Lp(a) ≥30 mg/dl | Ref | Ref | |||
BMI ≥24 kg/m2 (n = 4289) | Lp(a) <30 mg/dl | 0.96 (0.95–0.98) | <0.001 | 0.97 (0.95–0.98) | <0.001 |
Lp(a) ≥30 mg/dl | Ref | Ref | |||
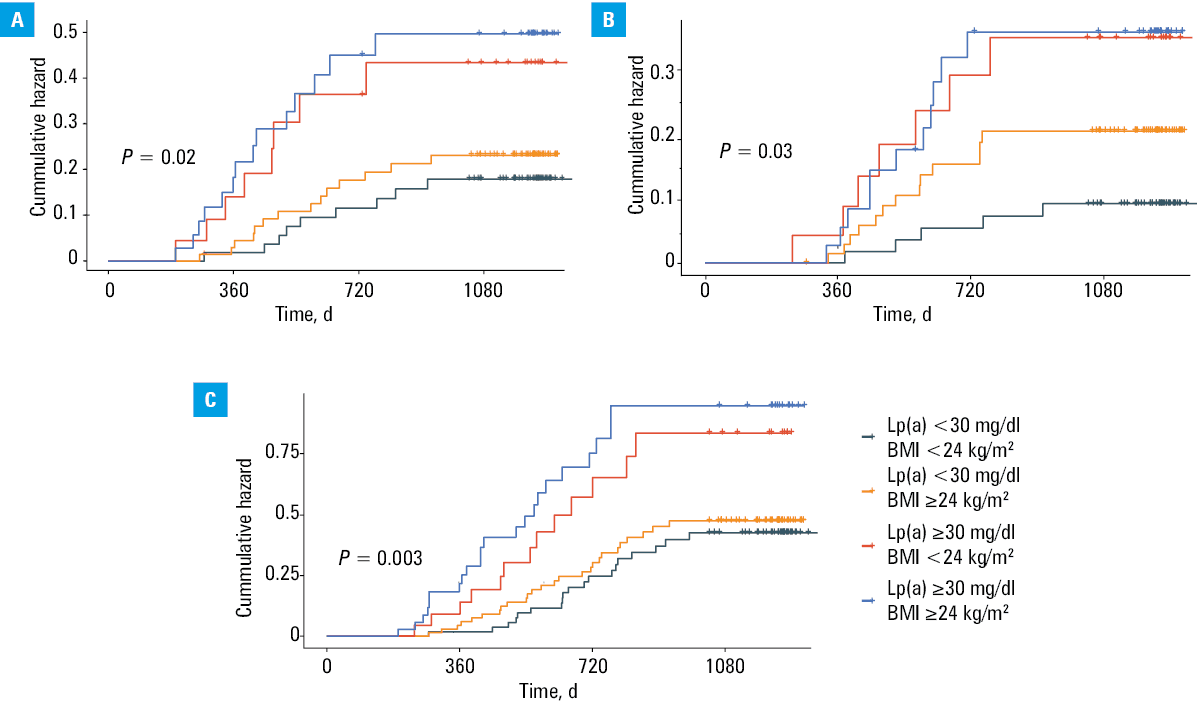
![Kaplan–Meier plots of stroke (A), heart failure (B), and major adverse cardiovascular events (C) according to lipoprotein(a) (Lp[a]) level and body mass index (BMI). P values were calculated with the log-rank test.](/paim/_next/image/?url=https%3A%2F%2Fpamw.pl%2Fsites%2Fdefault%2Ffiles%2Fjson_zip_files%2Funcompressed%2F17123%2FIMAGES%2FKP_WEB__FIG_02.png&w=3840&q=75)
Associations of the lipoprotein(a) level and body mass index with atrial fibrillation prognosis
We ultimately selected 183 patients with persistent AF from the study cohort, and categorized them as described above. The group with both low Lp(a) levels and low BMI included 55 individuals, of whom 9 experienced stroke and 19 experienced a MACE. In the group with low Lp(a) levels and high BMI, comprising 69 individuals, 14 experienced stroke and 26 a MACE. The group with high Lp(a) levels and low BMI included 23 individuals, of whom 8 experienced stroke and 13 a MACE. Finally, in the group with high Lp(a) levels and high BMI, comprising 36 individuals, 14 experienced stroke and 22 a MACE. The differences in stroke, HF, and MACEs between the 4 groups were substantial (P <0.05). As compared with the group with higher Lp(a) levels and BMI, the group with lower Lp(a) levels and BMI had lower rates of stroke, HF, and MACEs according to the Kaplan–Meier curves, as shown in Figure 3. Table 5 shows the associations of the Lp(a) level plus BMI with the prognosis of AF‑related events. The Cox regression analysis was conducted after adjusting for age and sex to examine the relationships between the Lp(a) level plus BMI and the end point event risk (in Model 1). Decreased Lp(a) levels alone and decreased Lp(a) levels and BMI values were independently associated with a 69% and 58% lower risk of stroke, but when the Lp(a) level was equal to or above 30 mg/dl, there was no difference in the stroke risk. Similar results were found for MACEs. As compared with those in the fourth group, in HF patients, only Lp(a) levels and BMI were markedly lower (odds ratio [OR], 0.29; P = 0.02). After adjusting for potential confounders (in Model 2), decreased Lp(a) levels alone and decreased Lp(a) and BMI values were independently associated with a 72% and 59% lower risk of stroke; however, when the Lp(a) level was equal to or above 30 mg/dl, there was no difference in the stroke risk. Similar results were found for MACEs. As compared with the patients in the fourth group, in HF patients, only Lp(a) levels and BMI were markedly lower (OR, 0.24; P = 0.006).
Variable | Model 1 | Model 2 | ||
HR (95% CI) | P value | HR (95% CI) | P value | |
Model 1: adjusted for age and sex; Model 2: adjusted for age, sex, LDL‑C level, HDL‑C level, hypertension status, and blood glucose level
Abbreviations: HR hazard ratio; MACE, major adverse cardiovascular event; others, see Table 1 | ||||
Stroke (n = 45) | ||||
Lp(a) <30 mg/dl and BMI <24 kg/m2 | 0.31 (0.13–0.71) | 0.006 | 0.28 (0.12–0.68) | 0.004 |
Lp(a) <30 mg/dl and BMI ≥24 kg/m2 | 0.42 (0.2–0.9) | 0.02 | 0.41 (0.19–0.86) | 0.02 |
Lp(a) ≥30 mg/dl and BMI <24 kg/m2 | 0.75 (0.31–1.83) | 0.53 | 0.67 (0.26–1.72) | 0.41 |
Lp(a) ≥30 mg/dl and BMI ≥24 kg/m2 | Ref | Ref | ||
Heart failure (n = 36) | ||||
Lp(a) <30 mg/dl and BMI <24 kg/m2 | 0.29 (0.11–0.8) | 0.02 | 0.24 (0.08–0.66) | 0.006 |
Lp(a) <30 mg/dl and BMI ≥24 kg/m2 | 0.52 (0.23–1.19) | 0.13 | 0.58 (0.25–1.33) | 0.2 |
Lp(a) ≥30 mg/dl and BMI <24 kg/m2 | 0.98 (0.37–2.6) | 0.98 | 0.81 (0.3–2.14) | 0.67 |
Lp(a) ≥30 mg/dl and BMI ≥24 kg/m2 | Ref | Ref | ||
MACE (n = 80) | ||||
Lp(a) <30 mg/dl and BMI <24 kg/m2 | 0.39 (0.21–0.72) | 0.002 | 0.35 (0.18–0.66) | 0.001 |
Lp(a) <30 mg/dl and BMI ≥24 kg/m2 | 0.43 (0.24–0.77) | 0.005 | 0.43 (0.24–0.78) | 0.005 |
Lp(a) ≥30 mg/dl and BMI <24 kg/m2 | 0.78 (0.39–1.6) | 0.53 | 0.72 (0.35–1.47) | 0.36 |
Lp(a) ≥30 mg/dl and BMI ≥24 kg/m2 | Ref | Ref | ||
Association between medications and echocardiographic parameters
We analyzed the effects of antihypertensive drugs, aspirin, and statins on left atrial diameter (LAD) and ejection fraction (EF). Our study demonstrated that antihypertensive medications were the only factor significantly associated with a reduction in LAD. This finding suggests that antihypertensive treatment may indirectly influence heart structure by lowering BP, which in turn could contribute to the reduction in LAD (Supplementary material, Table S2). The specific medications used in this study are listed in Supplementary material, Table S3.
Mediation Mendelian randomization analysis
We conducted mediation analyses to investigate whether the effect of the Lp(a) level on AF was mediated by BMI. Additionally, we conducted mediation analyses to investigate whether the effect of BMI on AF was mediated by the Lp(a) level. A summary of the mutual mediating effects linking the Lp(a) level and BMI to AF events is presented in Supplementary material, Tables S4–S7 and Figures S1–S3). The study showed no significant mediating effects of the Lp(a) level or BMI, suggesting an independent causal mechanism between different BMI and Lp(a) levels and the risk of AF (Supplementary material, Table S8).
Discussion
We included 8886 Chinese adults aged 18 years or older to evaluate the associations between the Lp(a) level and BMI and the occurrence of AF, and found that coexposure to a lower Lp(a) level and lower BMI was significantly associated with the lowest risk of AF‑related events, especially among individuals aged 50–69 years. Although the adjusted OR of 0.96 indicates a modest effect size, such small differences may still carry clinical relevance, particularly in middle‑aged and older adults. Even a slight reduction in AF risk can have meaningful implications when considered cumulatively or alongside other risk factors. The Lp(a) level could be used to further stratify cardiovascular risk independently of BMI, and vice versa. The associations persisted even after adjustment for other established cardiovascular risk factors. The MR analysis suggested that the Lp(a) level and BMI affect the occurrence of AF, which further validates the previous conclusion. This combined assessment could enhance the predictive accuracy of AF risk models and support more personalized prevention strategies, particularly in populations with a high prevalence of obesity and elevated Lp(a) levels.
For the prognosis of AF, we conducted follow‑up lasting for up to 4.84 years and including 183 patients with AF. We found that coexposure to a lower Lp(a) level and lower BMI was significantly associated with the lowest risk of stroke and MACEs. The associations persisted even after adjustment for other established cardiovascular risk factors.
Previous studies have widely assessed the positive correlation between Lp(a) levels or BMI and AF or disease prognosis. A systematic review23 concluded that there was no clear evidence linking Lp(a) levels to the development of AF. The authors emphasized the need for further research to better understand the potential mechanisms involved and to explore whether Lp(a) could play a role in AF risk stratification. Moreover, Mora et al24 reported no association between Lp(a) levels and the incidence of AF. In a multivariate analysis comparing the highest and lowest quintiles of Lp(a) levels, the hazard ratio (HR) for AF‑related events was 0.96 (95% CI, 0.76–1.2).24 Similarly, Aronis et al25 reported no association between Lp(a) levels and the incidence of AF. In the adjusted model, the HR for AF‑related events was 0.98 (95% CI, 0.82–1.17).25
In addition, several cohort studies have shown a negative correlation between BMI and established risk factors for AF. A cohort study that included adults aged 45–84 years without clinically recognized CVD revealed that individuals with Lp(a) levels equal to or above 30 mg/dl had a 16% lower risk of developing AF.26 Additionally, a cohort study in China reported that the prevalence of AF decreased from 34.2% for Lp(a) levels in the first quartile to 30.9% for Lp(a) levels in the fourth quartile.27
Also, several other studies have reported a positive relationship between Lp(a) levels and AF. Mohammadi‑Shemirani et al28 showed that for every 50 nmol/l (23 mg/dl) increase in the Lp(a) level, the incidence of AF increased by 3%. However, a study29 evaluating the efficacy of pelacarsen was primarily focused on atherosclerotic CVD (ASCVD) outcomes rather than AF. To date, there is no conclusive clinical evidence that Lp(a)-lowering therapies reduce the incidence or burden of AF, and further research is needed to elucidate this potential association.
On the other hand, BMI is another important risk factor for AF incidence. Many studies have shown that both high and low BMI is associated with an increased risk of AF. Low BMI may lead to changes in cardiac and electrophysiological function, affecting the structure and function of the heart and thereby increasing the risk of AF. For example, low BMI is often associated with malnutrition, myocardial damage, or underlying conditions, such as hyperthyroidism and anemia.15,30 Wang et al31 found that obesity (particularly BMI ≥30 kg/m2) was significantly associated with an increased risk of new‑onset AF. Individuals with higher BMI have more than 2 times higher risk of developing new‑onset AF than those with lower BMI.31 Scridon et al32 suggested that, in addition to general obesity, total pericardial fat volume, particularly pericardial fat volume covering the atria, may be a more important risk factor for AF. A recent study33 has highlighted the benefits of modest weight loss (≥10%) in overweight and obese patients with AF. It showed a 71% reduction in the risk of AF recurrence (risk ratio [RR], 0.29; 95% CI, 0.19–0.44) and significant improvements in AF burden, including fewer episodes, shorter durations, and reduced symptom severity.
For the prognosis of AF, stroke is an important factor that cannot be overlooked. Elevated Lp(a) level was also found to be significantly associated with an increased risk of ischemic stroke. The risk of ischemic stroke was found to be greater in the individuals with higher Lp(a) concentrations, suggesting that elevated Lp(a) levels could contribute to stroke.34 For MACEs, Berman et al35 suggested that, in individuals with undiagnosed ASCVD, the risk of MACEs increased with rising Lp(a) levels, with individuals within 91–100 Lp(a) percentiles having the highest relative risk (adjusted HR, 1.93; P <0.001).
Recent guidelines considered Lp(a) levels to be largely genetically determined and relatively stable.6 However, emerging evidence suggested that Lp(a) levels may fluctuate, particularly in individuals with mildly elevated concentrations. For example, a study by Gołąb et al36 observed intraindividual variability in a middle‑aged population, and identified smoking as a potential contributing factor. These findings indicated that certain environmental or lifestyle factors might influence Lp(a) levels over time, potentially impacting cardiovascular risk stratification.36
Our study showed that antihypertensive medication use was significantly associated with smaller LAD, but no association was found for statins and aspirin. This was supported by a 2020 meta‑analysis,37 which found that intensive BP control (SBP <120 mm Hg) reduced the risk of new‑onset AF by 26%, as compared with standard control (SBP <140 mm Hg) in high‑risk individuals. In contrast, no significant associations were observed between statin or aspirin use and atrial structure in our study. Although a meta‑analysis of 32 randomized controlled trials (RCTs)38 reported that statins reduced the risk of postoperative and recurrent AF, they showed no effect on new‑onset AF. Similarly, a large prospective cohort study found no association between aspirin use and AF incidence.39
In terms of mutual associations, we conducted a mediation MR analysis. The study results indicated that there was no significant mediating effect of Lp(a) level or BMI on the occurrence and progression of AF, suggesting that these 2 factors act independently in relation to AF.
There are several potential mechanisms that explain the complex relationship between the Lp(a) level and BMI and AF. In general, BMI plays a significant role in dyslipidemia, metabolic heart changes, and increased myocardial and vascular stiffness.40,41 Obesity and elevated Lp(a) levels both contribute to an increased inflammatory load in the body. This inflammation not only causes disturbances in atrial electrophysiology but also leads to structural modifications in the atria, such as vascular damage, endothelial dysfunction, and arteriosclerosis. Consistent with prior evidence linking central obesity to AF, such as in a study by Wang et al42 indicating a strong association between waist circumference and nonvalvular AF in HF patients, our results suggest that elevated BMI may amplify AF risk in the presence of high Lp(a) levels. This joint effect may indicate a synergistic pathophysiological burden beyond that of obesity alone.42 Also, as shown in studies linking left atrial appendage flow velocity to AF recurrence after cryoablation, atrial hemodynamic disturbances can favor arrhythmia. Lp(a)-driven vascular inflammation and thrombogenicity may similarly disrupt atrial flow, facilitating AF onset and persistence.43 Furthermore, inflammation can trigger insulin resistance and metabolic dysfunction, with the polarization of macrophages and lymphocytes toward a proinflammatory phenotype potentially exacerbating insulin resistance and thus fostering the development of AF.44,45
Limitations
Several limitations of this study should be acknowledged. First, although the Lp(a) level and BMI have been widely validated as predictors of AF‑related events, owing to the observational study design, we cannot confirm the causal relationship between Lp(a) level and BMI and AF. Second, the study was based on clinical data from a single hospital center, which may introduce bias. Third, owing to the relatively small number of patients with AF in the dataset, a larger sample size is needed for further validation. Fourth, there was no effective follow‑up of patients without AF, making it difficult to compare the associations of these markers with the prognoses of patients with and without AF.
Conclusions
Our study demonstrated that lower BMI and Lp(a) levels are associated with a reduced prevalence of AF. This finding underscores the potential value of considering both BMI and Lp(a) in AF risk assessment. Mediation analysis showed that neither BMI nor Lp(a) mediates the effect of the other, suggesting that their contributions to AF risk occur through independent pathways.
- Chugh SS, Roth GA, Gillum RF, Mensah GA. Global burden of atrial fibrillation in developed and developing nations. Glob Heart. 2014; 9: 113‑119. | Crossref
- Kirchhof P, Benussi S, Kotecha D, et al. 2016 ESC Guidelines for the management of atrial fibrillation developed in collaboration with EACTS. Eur J Cardiothorac Surg. 2016; 50: e1‑e88. | Crossref
- Lip GYH, Proietti M, Potpara T, et al. Atrial fibrillation and stroke prevention: 25 years of research at EP Europace journal. Europace. 2023; 25: euad226. | Crossref
- Chatterjee NA, Chae CU, Kim E, et al. Modifiable risk factors for incident heart failure in atrial fibrillation. JACC Heart Failure. 2017; 5: 552‑560. | Crossref
- Tasdighi E, Adhikari R, Almaadawy O, et al. Lp(a): structure, genetics, associated cardiovascular risk, and emerging therapeutics. Annu Rev Pharmacol Toxicol. 2024; 64: 135‑157. | Crossref
SUPPLEMENTARY MATERIAL
ARTICLE INFORMATION