Circulating short-chain fatty acids and subclinical cardiovascular disease in type 2 diabetes mellitus
4,5,8,9,10 Key words: arterial stiffness, cardiac structure and function, short-chain fatty acid, type 2 diabetes mellitus


 CC BY-NC-SA 4.0
Circulating short-chain fatty acids and subclinical cardiovascular disease in type 2 diabetes mellitus
Introduction: Type 2 diabetes (T2D) is linked to a higher risk of cardiovascular disease (CVD). However, evidence on the impact of different short‑chain fatty acids (SCFAs) on subclinical CVD is limited in patients with T2D.
Objectives: We aimed to investigate the associations between circulating SCFA levels and subclinical CVD in patients with T2D.
Patients and methods: This cross‑sectional study enrolled 326 patients with T2D from November 2016 to June 2020. The levels of 9 SCFAs, including formate, acetate, propionate, butyrate, isobutyrate, methylbutyrate, valerate, isovalerate, and methylvalerate, were measured in fasting serum using liquid chromatography–mass spectrometry. Cardiac structure and function were evaluated on echocardiography. Ankle‑brachial index (ABI) and brachial‑ankle pulse wave velocity, as a parameter of arterial stiffness, were measured. Multivariable linear and logistic regression models were adjusted for traditional risk factors including cholesterol and glycated hemoglobin (HbA1c) levels.
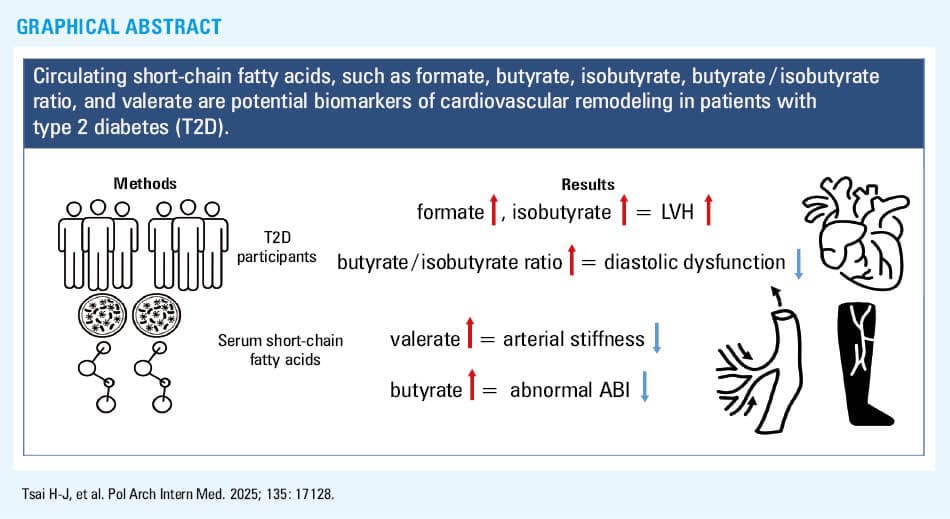
Results: Mean (SD) age of the patients was 63.5 (10.4) years and 56.4% were men. Median (interquartile range) HbA1c level was 7% (6.5%–7.9%). Adjusted odds ratios of left ventricular hypertrophy for comparison of the first and third tertile levels of formate and isobutyrate were 2.39 and 2.6, respectively. Higher butyrate / isobutyrate ratio was significantly associated with a decreased risk of diastolic dysfunction. An inverse relationship between valerate level and arterial stiffness was found. The patients with the highest tertile level of butyrate had a lower risk of abnormal ABI.
Conclusions: Our study demonstrates that serum SCFAs are potential biomarkers of the early stage of cardiovascular remodeling in patients with T2D.
What's new?
The relationships between circulating short‑chain fatty acid levels and subclinical cardiovascular disease are not well known in patients with type 2 diabetes (T2D). We found that the levels of formate and isobutyrate were associated with left ventricular hypertrophy in T2D patients. Additionally, butyrate / isobutyrate ratio and butyrate levels were inversely associated with diastolic dysfunction and abnormal ankle‑brachial index, and lower valerate level was associated with an increased risk of vascular stiffness.
Introduction
Type 2 diabetes (T2D) and its associated complications pose a significant global health challenge. Over the past decade, the worldwide prevalence of T2D has risen by 62%, and it is projected to affect 700 million individuals aged 20–79 years by 2045.1 In addition, the prevalence of T2D may differ among ethnicities.2 T2D increases the risk of cardiovascular disease (CVD) and heart failure (HF), which are the leading causes of morbidity and mortality.3,4 In addition, growing evidence suggests that T2D is linked to a higher risk of subclinical CVD, including structural abnormalities and dysfunction of the heart, as well as vascular stiffness.3
The gut microbiota is a complex microbial ecosystem in the gastrointestinal tract. Through long‑term coevolution with humans, it is closely linked to key physiological functions and contributes to the development of diseases, such as CVD and HF.5 Notably, the gut microbiota affects the host through metabolites, including short‑chain fatty acids (SCFAs), trimethylamine N‑oxide, and bile acids, which enter the systemic circulation and act as key mediators in the pathophysiology of HF and CVD and in the regulation of systemic immune metabolism.6
SCFAs are the main class of gut microbial metabolites and are absorbed into the systemic circulation, where they can act as hormone signals on target tissues or cells.7 The gut microbiota and SCFA production have been proven to play important roles in the pathophysiology of a variety of CVDs.8,9 HF is a terminal stage of almost all CVDs, and it has been potentially associated with alterations in the gut microenvironment.10 Reduced cardiac output and congestion result in intestinal hypoperfusion, which disrupts the barrier function of the intestine and promotes systemic inflammation through bacterial translocation, further worsening HF.11 Previous studies have shown diverse functions of various SCFAs at different pathophysiological stages of CVD.9 For example, butyrate, acetate, and propionate have been associated with reduced blood pressure (BP), improved ischemic reperfusion injury, and a decreased risk of coronary artery disease and atherosclerosis.9 However, there is a lack of direct evidence regarding the effect of serum SCFA levels in patients with T2D and subclinical CVD, and the mechanistic link between SCFAs and the pathophysiology of subclinical CVD in T2D patients has not been well explored. Therefore, the aim of this study was to investigate the associations between circulating SCFA levels and subclinical CVD in individuals with T2D.
Patients methods
Study sample
We invited patients with T2D who attended the outpatient clinics of a tertiary hospital in southern Taiwan from November 2016 to June 2020 to participate in this observational study. The study has been described in detail previously.12-14 In brief, a diagnosis of T2D was based on a previous history of T2D, blood glucose values defined by the American Diabetes Association, or the use of antidiabetic drugs. All patients were enrolled in an education program on diabetes at our hospital, and they followed the guidelines for a diabetic diet.
Clinical measurements
Clinical and sociodemographic data, including age, sex, cigarette smoking, alcohol use, medications, and comorbidities were obtained from medical records and interviews with the patients. Hypertension was defined as a history of hypertension, taking antihypertensive drugs, or BP equal to or above 140/90 mm Hg. Heart disease was defined as a history of myocardial infarction, ischemic heart disease, or congestive HF. Information on the use of medications, including antidiabetic agents, angiotensin‑converting enzyme inhibitors, angiotensin II receptor blockers, β-blockers, and calcium channel blockers before and after enrollment was collected from medical records. BP was measured in the sitting position after 5 minutes of rest, using a single calibrated device (TERUMO ES‑W110ZJ, Lunder Medical Instrument, Kaohsiung, Taiwan). BP was recorded as a mean of 3 consecutive measurements with a 5‑minute interval between each measurement. Body mass index (BMI) was calculated as body weight divided by body height squared (kg/m2). Information on the usual diet of the patients was obtained using a simple questionnaire. Fasting blood samples were collected for biochemical analyses.
Measurement of circulating short‑chain fatty acids
A detailed method for measurement of circulating SCFA levels was described in previous studies.13,14 In brief, serum levels of the following 9 SCFAs were measured using liquid chromatography–mass spectrometry (LC‑MS): formate, acetate, propionate, butyrate, isobutyrate, methylbutyrate, valerate, isovalerate, and methylvalerate. Human serum (50 μl) was derivatized using 3‑nitrophenylhydrazine and N-(3‑dimethylaminopropyl)-N‑ethylcarbodiimide in methanol, incubated at 40 °C for 30 minutes, and diluted to 210 μl with 10% aqueous methanol. Then, 75-μl aliquots were mixed with 25 μl of an internal standard, and 10 μl of the mixture was analyzed with LC‑MS/MS. The analysis was performed using the Waters ACQUITY UPLC system (Waters Corporation, Milford, Massachusetts, United States) coupled with the Finnigan TSQ Quantum Ultra triple‑quadrupole MS (Thermo Electron, San Jose, California, United States) with Xcalibur software (Thermo Finnigan, Bellefonte, Pennsylvania, United States), using an electrospray ionization source in a positive mode. Separation was performed on a BEH C18 column (2.1 mm × 100 mm, 1.7 µm; Waters Corporation) at 40 °C, with a 300 μl/min flow rate.
Evaluation of cardiac structure and function
A detailed evaluation of cardiac structure and function was described in a previous study.12 In brief, echocardiographic examinations were performed by experienced cardiologists using a VIVID 7 system (General Electric Medical Systems, Horten, Norway) with the patients breathing quietly in the left decubitus position. Two‑dimensional and M‑mode images were recorded in standardized views. Echocardiographic measurements, including left atrial diameter (LAD), aortic root diameter, left ventricular posterior wall thickness in diastole and systole (LVPWTd and LVPWTs), left ventricular internal diameter in diastole and systole (LVIDd and LVIDs), interventricular septal wall thickness in diastole and systole, peak early transmitral filling wave velocity (E), and peak late transmitral filling wave velocity (A) were obtained. The E/A ratio below 1 was defined as diastolic dysfunction. The E (early mitral inflow velocity)/E’ (mitral annular early diastolic velocity) ratio was also used to assess diastolic dysfunction, and the data were obtained from 5 beats and then averaged for analysis.15 Left ventricular systolic function was assessed according to left ventricular fraction shortening (LVFS) and left ventricular ejection fraction (LVEF). In addition, left ventricular mass (LVM) was calculated using the modified Devereux method,16 while left ventricular mass index (LVMI) was calculated by dividing the LVM by body surface area. The definition of left ventricular hypertrophy (LVH) was based on the 2007 European Society of Hypertension / European Society of Cardiology guidelines.17 Left ventricular relative wall thickness (LVRWT) was calculated as 2 × LVPWTd/LVIDd. Concentric LVH was defined as LVMI equal to or above 125 g/m2 in men and equal to or above 110 g/m2 in women, with LVRWT equal to or above 0.45; eccentric LVH was defined as LVMI equal to or above 125 g/m2 in men and equal to or above 110 g/m2 in women, with LVRWT below 0.45. Stroke volume was calculated using measurements of ventricular volumes and subtracting the volume of the blood in the ventricle at the end of a beat (end‑systolic volume) from the volume of blood just prior to the beat (end‑diastolic volume).
Assessment of brachial‑ankle pulse wave velocity and ankle‑brachial index and definitions of abnormally low and high ankle‑brachial index
Ankle‑brachial index (ABI) was measured using an ABI‑form device (VP1000; Colin Co. Ltd, Komaki, Japan) at enrollment, which automatically and simultaneously measured BP at the 4 extremities through an oscillometric method.18 ABI was calculated as the ratio of the ankle systolic BP (SBP) divided by the arm SBP. The ABI measurement was performed once for each patient. An abnormally low ABI was defined as below 0.9 and an abnormally high ABI as equal to or above 1.3 in either leg.
As a parameter of arterial stiffness, brachial‑ankle pulse wave velocity (baPWV) was measured using the same ABI‑form device that automatically and simultaneously measured BP on both arms and ankles using an oscillometric method.19,20 Pulse waves obtained from the brachial and tibial arteries were recorded simultaneously, and the transmission time (ΔTba), which was defined as the time interval between the initial increase in brachial and ankle waveforms, was determined. The transmission distance from the brachium to ankle was calculated according to body height, and the path length from the suprasternal notch to the brachium (Lb) was obtained using the following equation: Lb = 0.2195 × height of the patient (in cm) – 2.0734. The path length from the suprasternal notch to the ankle (La) was obtained using the following equation: La = 0.8129 × height of the patient (in cm) + 12.328. Finally, the following equation was used to obtain baPWV: baPWV = (La – Lb)/ΔTba. The highest baPWV value was used to represent arterial stiffness for each patient.
Statistical analysis
Continuous variables were expressed as mean (SD) or median (interquartile range [IQR]), as appropriate. If the continuous variables were not normally distributed, their values were log10‑transformed before further analysis including univariable and multivariable regression models. Categorical variables were expressed as percentages. The Bonferroni post hoc analysis was also used after analysis of variance or the Kruskal–Wallis test. Differences in categorical variables between groups were tested using the χ2 test. Linear or logistic regression was used to investigate the associations between SCFA levels and the cardiac echocardiographic parameters, ABI, and baPWV. Based on the non‑normal distribution of SCFA levels, 9 SCFA variables were introduced as continuous log‑transformed variables; moreover, we stratified the 9 SCFAs, butyrate / isobutyrate ratio, and valerate / isovalerate ratio into tertiles to evaluate the association. We applied the linear regression models to evaluate the associations between SCFAs and LVMI, LAD, E/E’, LVEF, LVFS, stroke volume (SV), and baPWV. The logistic regression models were used for LVH, LAD value above the median, E/A ratio below 1, E/E’ value above the median, baPWV value above the median, and abnormal ABI (<0.9 or ≥1.3). The multivariable linear and logistic models were adjusted for traditional CVD risk factors, such as age, sex, lifestyle factors (smoking history and BMI), clinical diseases (hypertension and heart disease), and laboratory data (serum cholesterol and glycated hemoglobin [HbA1c] levels).21 Statistical analyses were conducted using SPSS 22.0 package for Windows (IBM Inc., Armonk, New York, United States). Significance was set at a 2‑sided P value below 0.05.
Ethics
The study protocol was approved by the Institutional Review Board of Kaohsiung Medical University Hospital (KMUHIRB‑G(II)-20160021, KMUHIRB‑G(I)-20160036, KMUHIRB‑G(II)-20190036). All patients provided their written informed consent to participate in the study, and all clinical investigations were conducted according to the principles expressed in the Declaration of Helsinki. The participants did not give the written consent for their data to be shared publicly, so due to the sensitive nature of the research supporting data are not available.
Results
Characteristics of the study cohort
The clinical characteristics of the study cohort are shown in Table 1. A total of 326 T2D patients were enrolled, at a mean (SD) age of 63.5 (10.4) years, with 56.4% being men. Of the 326 patients, 64.4% had hypertension, 78.5% hyperlipidemia, and 35.3% heart disease. The mean (SD) T2D duration, BMI, and serum cholesterol level were 10.6 (8.5) years, 26.6 (4.4) kg/m2, and 167.8 (36.9) mg/dl, respectively, and the median (IQR) HbA1c level was 7% (6.5%–7.9%). The median (IQR) serum levels of the 9 SCFAs were as follows: formate, 143.3 (95.8–228) μM; acetate, 95.4 (73.3–131) μM; propionate, 14.9 (11.3–21.4) μM; butyrate, 7.9 (5.2–9.7) μM; isobutyrate, 8.6 (5.7–13) μM; methylbutyrate, 7.9 (4.5–14.5) μM; valerate, 2.6 (1.6–5.6) μM; isovalerate, 15.5 (3.2–23.9) μM; and methylvalerate, 1.4 (0.6–3.6) μM (Table 1).
Variable | Entire cohort (n = 326) |
Data are expressed as number (percentage) for categorical variables and mean (SD) or median (interquartile range) for continuous variables, as appropriate.
SI conversion factors: to convert albumin to g/l, multiply by 10; blood urea nitrogen to mmol/l, by 0.357; Ca to mmol/l, by 0.025; total cholesterol, HDL‑C, and LDL‑C to mmol/l, by 0.02586; creatinine to µmol/l, by 88.4; Hb to g/l, by 10; triglyceride to mmol/l, by 0.01129; uric acid to μmol/l, by 59.48
Abbreviations: ACEI, angiotensin‑converting enzyme inhibitor; ARB, angiotensin II receptor blocker; BMI, body mass index; DPP4, dipeptidyl peptidase 4; eGFR, estimated glomerular filtration rate; GOT, glutamic oxaloacetic transaminase; GPT, glutamic pyruvic transaminase; Hb, hemoglobin; HbA1c, glycated hemoglobin; HDL‑C, high‑density lipoprotein cholesterol; LDL‑C, low‑density lipoprotein cholesterol; SGLT2i, sodium‑glucose cotransporter 2 inhibitor | |
Demographics | |
Age, y | 63.5 (10.4) |
Men | 184 (56.4) |
BMI, kg/m2 | 26.6 (4.4) |
Current smokers | 80 (24.5) |
Alcohol consumption | 67 (20.6) |
Diabetes mellitus duration, y | 9 (4–15) |
Heart disease | 115 (35.3) |
Hypertension | 210 (64.4) |
Hyperlipidemia | 256 (78.5) |
Systolic blood pressure, mm Hg | 137 (17) |
Diastolic blood pressure, mm Hg | 79 (9) |
Medication | |
Calcium channel blocker | 76 (23.3) |
β-Blocker | 73 (22.4) |
ACEI/ARB | 132 (40.5) |
Diuretic | 53 (16.3) |
Statin | 151 (46.3) |
Sulfonylurea | 147 (45.1) |
DPP4 inhibitor | 219 (67.2) |
Metformin | 283 (86.8) |
SGLT2i | 7 (2.5) |
Thiazolidinedione | 108 (33.1) |
Insulin | 54 (16.6) |
Short‑chain fatty acids, μM | |
Formate | 143.3 (95.8–228) |
Acetate | 95.4 (73.3–130.1) |
Propionate | 14.9 (11.3–21.4) |
Butyrate | 7.9 (5.2–9.7) |
Isobutyrate | 8.6 (5.7–13) |
Butyrate / isobutyrate ratio | 1 (0.5) |
Methylbutyrate | 7.9 (4.5–14.5) |
Valerate | 2.6 (1.6–5.6) |
Isovalerate | 15.5 (3.2–23.9) |
Valerate / isovalerate ratio | 0.4 (0.3) |
Methylvalerate | 1.4 (0.6–3.6) |
Laboratory parameters | |
Blood urea nitrogen, mg/dl | 15 (12.1–19) |
Creatinine, mg/dl | 0.9 (0.7–1.1) |
eGFR, ml/min/1.73 m2 | 78.6 (26.2) |
HbA1c, % | 7 (6.5–7.9) |
GOT, IU/l | 27 (22–33) |
GPT, IU/l | 25 (18–37.5) |
Hb, g/dl | 13.6 (1.6) |
Albumin, g/dl | 4.5 (0.3) |
Uric acid, mg/dl | 5.9 (1.5) |
Ca, mg/dl | 9.3 (9.1–9.5) |
Total cholesterol, mg/dl | 167.8 (36.9) |
Triglyceride, mg/dl | 125 (87–178) |
HDL‑C, mg/dl | 43 (36–50) |
LDL‑C, mg/dl | 94.4 (30.5) |
Relationships between short‑chain fatty acids and clinical characteristics
Univariable linear regression or nonparametric method was used to analyze the association between 9 circulating SCFAs and demographic, clinical, and laboratory variables (Supplementary material, Tables S1 and S2). BMI was inversely associated with isobutyrate and methylbutyrate, but positively with isovalerate levels; higher serum triglycerides were inversely related to formate, acetate, methylbutyrate, and valerate levels, but positively associated with propionate level (Supplementary material, Table S1). Current smoking was positively linked to acetate levels (Supplementary material, Table S2).
Relationships between short‑chain fatty acids and cardiac structure
The distribution of echocardiographic parameters is shown in Table 2. Overall, 17.2% of the patients had LVH, including 6.5% of the concentric type and 10.7% of the eccentric type. Regarding LV systolic function, mean (SD) LVEF and LVFS were 70.6% (9.5%) and 40.8% (7.7%), respectively. In addition, 71.1% of the patients had diastolic dysfunction (E/A <1). Mean (SD) ABI was 1.1 (0.1), and 10.5% of the patients had abnormal ABI. We further analyzed the associations among the 9 SCFAs, butyrate / isobutyrate ratio, and valerate / isovalerate ratio with cardiac structure and systolic and diastolic function. We further stratified the SCFAs by tertiles to explore the relationship between the SCFAs and cardiac structure or function (Supplementary material, Table S3). The unadjusted unstandardized β of LVMI was significant for the tertile 3 level of formate, isobutyrate, and valerate, as compared with tertile 1 level of formate (β = 0.04; 95% CI, 0–0.08; P = 0.04), isobutyrate (β = 0.05; 95% CI, 0.01–0.09; P = 0.02, and valerate (β = 0.05; 95% CI, 0.01–0.09; P = 0.03; Supplementary material, Table S4). After adjusting for traditional risk factors, including age, sex, smoking, BMI, hypertension, heart disease, serum cholesterol level, and HbA1c level of 7%, the patients with tertile 3 level of formate (β = 0.05; 95% CI, 0.01–0.1; P = 0.01), isobutyrate (β = 0.05; 95% CI, 0.01–0.09; P = 0.01), and valerate (β = 0.06; 95% CI, 0.01–0.1; P = 0.01) had higher LVMI than those with tertile 1 level of formate, isobutyrate, and valerate (Table 3). The adjusted odds ratio (OR) of LVH was 2.39 (95% CI, 1.06–5.41; P = 0.03) for tertile 3 level of formate, as compared with tertile 1 level of formate, and 2.6 (95% CI, 1.12–5.99; P = 0.02) for tertile 3 level of isobutyrate compared with tertile 1 level of isobutyrate. In addition, there were no significant associations between any of the SCFAs and LAD in the adjusted analysis (Supplementary material, Table S5).
Variable | Entire cohort (n = 326) |
Data are expressed as number (percentage) for categorical variables and mean (SD) or median (interquartile range) for continuous variables, as appropriate.
Abbreviations: ABI, ankle‑brachial index; baPWV, brachial‑ankle pulse wave velocity; E/A, peak early transmitral filling wave velocity / peak late transmitral filling wave velocity; E/E’, early mitral inflow velocity / mitral annular early diastolic velocity; LV, left ventricle; LVEF, left ventricular ejection fraction; LVFS, left ventricular fraction shortening; LVH, left ventricular hypertrophy; LVMI, left ventricular mass index; SV, stroke volume | |
Aortic root diameter, cm | 3.3 (0.4) |
Left atrial diameter, cm | 3.7 (0.6) |
Left atrial diameter / aortic root diameter | 1.1 (0.2) |
LVMI, g/m2 | 86.5 (65.5–104.9) |
LVH | 56 (17.2) |
LV geometry | |
Non‑LVH | 270 (82.8) |
Concentric LVH | 21 (6.4) |
Eccentric LVH | 35 (10.7) |
SV, ml | 78.9 (24.3) |
LVEF, % | 70.6 (9.5) |
LVFS, % | 40.8 (7.7) |
E/A <1 | 232 (71.1) |
E/E’ | 9.2 (2.7) |
baPWV, cm/s | 1742.2 (340.8) |
ABI | 1.1 (0.1) |
ABI groups | |
ABI <0.9 | 7 (2.4) |
ABI >0.9 and ≥1.3 | 264 (89.5) |
ABI ≥1.3 | 24 (8.1) |
Variable | Log‑transformed LVMI | LVH | ||||||
Unadjusted model | Adjusted model | Unadjusted model | Adjusted model | |||||
ß (95% CI) | P value | ß (95% CI) | P value | OR (95% Cl) | P value | OR (95% Cl) | P value | |
Multivariable adjusted model: adjusted for age, sex, hypertension, heart disease, smoking status, body mass index, serum cholesterol levels, and HbA1c cutoff at 7%; formate tertile cutoff at 110.1 μM and 199.1 μM; isobutyrate tertile cutoff at 6.3 μM and 11.4 μM; valerate tertile cutoff at 1.8 μM and 4 μM
| ||||||||
Formate | ||||||||
Log‑transformed | 0.03 (–0.01 to 0.08) | 0.16 | 0.04 (–0.01 to 0.08) | 0.1 | 1.34 (0.63–2.88) | 0.45 | 1.57 (0.71–3.45) | 0.26 |
Tertile 1 | Ref | – | Ref | – | Ref | – | Ref | – |
Tertile 2 | 0.02 (–0.03 to 0.05) | 0.48 | 0.02 (–0.02 to 0.06) | 0.4 | 1.53 (0.73–3.2) | 0.26 | 1.89 (0.84–4.26) | 0.12 |
Tertile 3 | 0.04 (0–0.08) | 0.04 | 0.05 (0.01–0.09) | 0.01 | 1.74 (0.84–3.6) | 0.14 | 2.39 (1.06–5.41) | 0.03 |
Isobutyrate | ||||||||
Log‑transformed | 0.08 (0–0.16) | 0.04 | 0.1 (0.02–0.18) | 0.01 | 2.2 (0.58–8.28) | 0.24 | 4.65 (1.01–21.44) | 0.04 |
Tertile 1 | Ref | – | Ref | – | Ref | – | Ref | – |
Tertile 2 | 0.02 (–0.02 to 0.06) | 0.33 | 0.02 (–0.02 to 0.06) | 0.24 | 1.66 (0.78–3.53) | 0.18 | 2.12 (0.92–4.9) | 0.07 |
Tertile 3 | 0.05 (0.01–0.09) | 0.02 | 0.05 (0.01–0.1) | 0.01 | 2 (0.95–4.18) | 0.06 | 2.6 (1.12–5.99) | 0.02 |
Valerate | ||||||||
Log‑transformed | 0.04 (–0.01 to 0.08) | 0.12 | 0.03 (0.01–0.05) | 0.01 | 1.28 (0.61–2.68) | 0.52 | 1.62 (0.73–3.59) | 0.23 |
Tertile 1 | Ref | – | Ref | – | Ref | – | Ref | – |
Tertile 2 | 0.02 (–0.02 to 0.07) | 0.26 | 0.02 (–0.02 to 0.06) | 0.34 | 2.16 (1.02–4.6) | 0.046 | 2 (0.89–4.49) | 0.09 |
Tertile 3 | 0.05 (0.01–0.09) | 0.03 | 0.06 (0.01–0.1) | 0.01 | 1.95 (0.91–4.2) | 0.09 | 2.28 (0.99–5.22) | 0.051 |
Relationships between short‑chain fatty acids and cardiac diastolic or systolic function
We defined the E/E’ value greater than the median (8.8) or E/A ratio above 1 as indicating diastolic dysfunction. After adjusting for well‑known risk factors, the patients with the highest tertile of butyrate / isobutyrate ratio had a lower risk of E/E’ above the median, as compared with those with the lowest tertile of butyrate / isobutyrate ratio (OR = 0.05; 95% CI, 0.27–0.93; P = 0.03; Table 4). On the other hand, significant associations between E/A ratio below 1 and butyrate / isobutyrate ratio and acetate were found in the unadjusted model, but the results were not consistent in the adjusted model (Table 4 and Supplementary material, Table S6). In addition, none of the SCFAs were associated with SV or LV systolic function, including LVEF and LVFS (Supplementary material, Table S7).
Variable | E/A ratio <1 | E/E’ >median | ||||||
Unadjusted model | Adjusted model | Unadjusted model | Adjusted model | |||||
OR (95% Cl) | P value | OR (95% Cl) | P value | OR (95% Cl) | P value | OR (95% Cl) | P value | |
Multivariable adjusted model: adjusted for age, sex, hypertension, heart disease, smoking status, body mass index, serum cholesterol levels, and HbA1c cutoff at 7%; butyrate / isobutyrate ratio tertile cutoff at 0.4 μM and 1.4 μM; acetate tertile cutoff at 80 μM and 114.3 μM
| ||||||||
Butyrate / isobutyrate ratio | 1.38 (0.88–2.17) | 0.16 | 1.56 (0.93–2.6) | 0.09 | 0.81 (0.54–1.21) | 0.3 | 0.74 (0.48–1.12) | 0.16 |
Tertile 1 | Ref | – | Ref | – | Ref | – | Ref | – |
Tertile 2 | 1.17 (0.63–2.16) | 0.62 | 1.37 (0.68–2.74) | 0.38 | 0.76 (0.43–1.36) | 0.36 | 0.78 (0.42–1.43) | 0.42 |
Tertile 3 | 1.98 (1.01–3.87) | 0.04 | 2.12 (0.99–4.51) | 0.053 | 0.6 (0.33–1.08) | 0.09 | 0.5 (0.27–0.93) | 0.03 |
Acetate | ||||||||
Log‑transformed | 9.6 (1.91–48.23) | 0.006 | 7.19 (1.2–42.92) | 0.03 | 0.22 (0.06–0.85) | 0.03 | 0.19 (0.05–0.76) | 0.02 |
Tertile 1 | Ref | – | Ref | – | Ref | – | Ref | – |
Tertile 2 | 0.86 (0.47–1.58) | 0.63 | 0.84 (0.43–1.61) | 0.6 | 0.72 (0.4–1.29) | 0.26 | 0.73 (0.4–1.34) | 0.31 |
Tertile 3 | 2.15 (1.06–4.34) | 0.03 | 1.68 (0.78–3.59) | 0.18 | 0.72 (0.4–1.29) | 0.26 | 0.7 (0.38–1.3) | 0.26 |
Relationships between short‑chain fatty acids and arterial stiffness and abnormal ankle‑brachial index
We then analyzed the relationships between circulating SCFAs and the severity of arterial stiffness, defined as a baPWV value greater than the median (1719 cm/s; Supplementary material, Table S8). Among the 9 SCFAs, the patients with the highest tertile level of valerate had a lower risk of arterial stiffness than those with the lowest tertile level (adjusted OR = 0.47; 95% CI, 0.23–0.95; P = 0.04; Table 5). In addition, the patients with the highest tertile level of butyrate less often had abnormal ABI (<0.9 or ≥1.3) than those with the lowest tertile level (adjusted OR = 0.26; 95% CI, 0.08–0.8; P = 0.02; Table 6).
Variable | baPWV >median | |||
Unadjusted model | Adjusted model | |||
OR (95% CI) | P value | OR (95% CI) | P value | |
Multivariable adjusted model: adjusted for age, sex, hypertension, heart disease, smoking status, body mass index, serum cholesterol levels, and HbA1c cutoff at 7%; valerate tertile cutoff at 1.8 μM and 4 μM; isovalerate tertile cutoff at 4.3 μM and 21 μM; valerate / isovalerate ratio tertile cutoff at 0.1 μM and 0.6 μM; acetate tertile cutoff at 80 μM and 114.3 μM
| ||||
Valerate | ||||
Log‑transformed | 0.75 (0.41–1.37) | 0.35 | 0.62 (0.3–1.3) | 0.2 |
Tertile 1 | Ref | – | Ref | – |
Tertile 2 | 0.82 (0.46–1.44) | 0.49 | 0.59 (0.29–1.18) | 0.13 |
Tertile 3 | 0.62 (0.35–1.08) | 0.09 | 0.47 (0.23–0.95) | 0.04 |
Isovalerate | ||||
Log‑transformed | 0.89 (0.55–1.43) | 0.63 | 1.03 (0.57–1.86) | 0.92 |
Tertile 1 | Ref | – | Ref | – |
Tertile 2 | 0.52 (0.3–0.92) | 0.02 | 0.43 (0.22–0.84) | 0.01 |
Tertile 3 | 0.68 (0.39–1.21) | 0.19 | 0.74 (0.36–1.5) | 0.4 |
Valerate / isovalerate ratio | 0.77 (0.39–1.54) | 0.46 | 0.44 (0.18–1.04) | 0.06 |
Tertile 1 | Ref | – | Ref | – |
Tertile 2 | 1.45 (0.81–2.58) | 0.2 | 1.33 (0.65–2.69) | 0.43 |
Tertile 3 | 0.82 (0.47–1.45) | 0.50 | 0.59 (0.29–1.2) | 0.14 |
Acetate | ||||
Log‑transformed | 3.98 (1.08–14.67) | 0.04 | 1.9 (0.38–9.46) | 0.43 |
Tertile 1 | Ref | – | Ref | – |
Tertile 2 | 0.86 (0.49–1.48) | 0.57 | 0.86 (0.44–1.67) | 0.66 |
Tertile 3 | 1.99 (1.11–3.56) | 0.02 | 1.59 (0.78–3.23) | 0.2 |
Variable | Abnormal ABI | |||
Unadjusted model | Adjusted model | |||
OR (95% CI) | P value | OR (95% CI) | P value | |
Multivariable adjusted model: adjusted for age, sex, hypertension, heart disease, smoking status, body mass index, serum low density cholesterol and high density cholesterol levels, and HbA1c cutoff at 7%; butyrate tertile cutoff at 6.6 μM and 8.7 μM; isobutyrate tertile cutoff at 6.3 μM and 11.4 μM; butyrate / isobutyrate tertile cutoff at 0.4 μM and 1.4 μM
| ||||
Butyrate | ||||
Log‑transformed | 0.29 (0.05–1.72) | 0.17 | 0.26 (0.04–1.64) | 0.15 |
Tertile 1 | Ref | – | Ref | – |
Tertile 2 | 1.02 (0.45–2.3) | 0.96 | 0.93 (0.41–2.13) | 0.86 |
Tertile 3 | 0.27 (0.09–0.85) | 0.03 | 0.26 (0.08–0.8) | 0.02 |
Isobutyrate | ||||
Log‑transformed | 1.96 (0.35–10.96) | 0.44 | 2.35 (0.39–14.09) | 0.35 |
Tertile 1 | Ref | – | Ref | – |
Tertile 2 | 0.6 (0.22–1.64) | 0.31 | 0.67 (0.24–1.87) | 0.44 |
Tertile 3 | 1.29 (0.54–3.06) | 0.56 | 1.38 (0.57–3.36) | 0.48 |
Butyrate / isobutyrate ratio | 0.67 (0.35–1.3) | 0.24 | 0.62 (0.32–1.22) | 0.17 |
Tertile 1 | Ref | – | Ref | – |
Tertile 2 | 0.34 (0.13–0.89) | 0.03 | 0.33 (0.12–0.9) | 0.03 |
Tertile 3 | 0.49 (0.2–1.2) | 0.12 | 0.43 (0.17–1.1) | 0.07 |
Relationships between short‑chain fatty acids and subclinical cardiovascular disease in the subgroup analysis
We performed the subgroup analysis of the patients stratified by age (<65 vs ≥65 y), sex, HbA1c level (≤7% vs >7%), and BMI (<25 kg/m2 vs ≥25 kg/m2) to further examine the synergistic interactions between circulating SCFAs and these covariates with the parameters of subclinical CVD (Figure 1). A significant positive relationship between LVH and serum formate across tertile 1 to 3 was found in the patients younger than 65 years (Figure 1A), whereas a positive relationship between LVH and serum isobutyrate was found in the patients aged 65 years or older (Figure 1B). The patients younger than 65 years with the highest tertile level of butyrate / isobutyrate ratio had a lower risk of E/E’ above the median, as compared with those with tertile 1 level of butyrate / isobutyrate ratio (Figure 1C). In addition, the men with the highest tertile levels of serum valerate (Figure 1D) and butyrate (Figure 1E) had lower risks of baPWV above the median and abnormal ABI than those with the lowest tertile levels of serum valerate and butyrate, respectively. Moreover, an inverse association between LVH and serum isobutyrate was found in the patients with BMI below 25 kg/m2 and those with poor glycemic control (HbA1c >7%; Figure 1B).

Discussion
This study assessed the relationships between the levels of circulating SCFAs and measures of cardiovascular structure and function as subclinical features of CVD in patients with T2D. The results showed that high levels of formate and isobutyrate were significantly associated with increased LVMI and prevalence of LVH after adjusting for traditional cardiovascular risk factors. We also found a negative association between serum butyrate / isobutyrate ratio and diastolic dysfunction, as indicated by the E/E’ value above the median. In addition, we observed an inverse relationship between serum valerate level and arterial stiffness, as indicated by the baPWV value greater than the median, and a high risk of abnormal ABI in the patients with a low serum level of butyrate. Taken together, our results showed that the levels of circulating SCFAs, especially of formate, butyrate, isobutyrate, butyrate / isobutyrate ratio, and valerate, were potential markers of subclinical CVD in T2D patients.
CVD is the most common cause of morbidity and mortality worldwide, and HF is the major end point of CVD.22 Reduced cardiac output can cause intestinal hypoperfusion, leading to increased intestinal barrier permeability. This disruption permits the translocation of inflammatory bacterial products into the bloodstream, contributing to chronic low‑grade inflammation.23 HF may disrupt the intestinal environment and alter the composition of the gut microbiota, resulting in decreased microbial diversity, diminished anti‑inflammatory functions, and an increase in the abundance of pathogenic bacteria.23 SCFAs are key molecules mediating the beneficial effects of the microbiota on the pathophysiology of HF via various mechanisms, including histone deacetylase (HDAC) inhibition and G protein‑coupled receptor–mediated effects.11 Reduced serum levels of SCFAs have been linked to HF and CVD by influencing cholesterol accumulation, lipid levels in the circulation and liver, and the activation or suppression of inflammatory pathways.24 Taken together, SCFAs may interact with the pathophysiology of HF and CVD and significantly ameliorate their progression. Given their potential as novel therapeutics, SCFAs could pave the way for personalized medicine tailored to HF patients through gut microbiome characterization.
Our results indicated that serum butyrate / isobutyrate ratio was inversely associated with diastolic dysfunction (E/E’ >median). Butyrate is an important regulator of bacterial balance, intestinal barrier function, and the expression of various genes, including those encoding lipids and those related to immunity, differentiation, apoptosis, phagocytosis, and efferocytosis.25 Butyrate exerts anti‑inflammatory effects through colonocyte peroxisome proliferator–activated receptor γ activation and regulatory T‑cell proliferation.26 Butyrate also inhibits the expression of the proinflammatory gene nuclear factor κ-light‑chain‑enhancer of activated B, which has been implicated in the progression of HF.27 In addition, several animal studies demonstrated that butyrate administered to diabetic mice reduced cardiac hypertrophy and interstitial fibrosis in streptozotocin‑treated animals, and prevented apoptosis of cardiomyocytes caused by a high‑fat diet.28,29 A recent study further showed a decrease in the butyrate‑producing bacterial community in the guts of patients with chronic HF.30 However, the potential pathophysiological mechanisms underlying the link between isobutyrate levels and the features of subclinical CVD, including LVH and diastolic dysfunction, remain unclear. Our results highlight the potential impact of imbalances in butyrate and isobutyrate on E/E’ ratio in T2D patients, further indicating that the distribution of butyrate and isobutyrate is more important in heart diastolic dysfunction than the individual expression of butyrate or isobutyrate.
We also found that the patients with a low serum butyrate level had a higher risk of abnormal ABI, indicating narrowed arteries. In addition, we observed an inverse relationship between serum valerate level and an increased risk of arterial stiffness, as indicated by the baPWV value above the median. Previous research has suggested that butyrate may participate in vascular remodeling by regulating the production of regulatory T cells and suppressing HDACs.31,32 Butyrate may regulate vascular tone and blood pressure by binding to receptors on smooth muscle cells.33 Dardi et al34 reported that reduced intestinal butyrate availability was associated with arterial resistance in hypertensive rats, and Biruete et al35 showed that the presence of Faecalibacterium spp., a known butyrate producer with potential anti‑inflammatory properties, was negatively associated with arterial stiffness in hemodialyzed patients. On the other hand, valerate is a 5‑carbon molecule and a salt of a straight‑chain alkyl carboxylic acid, and it is considered to be an important modulator of immune response, oxidative stress, inflammation, and autophagy pathways.36,37 Onyszkiewicz et al38 found that valerate exerts vasodilatory and hypotensive effects in rats. Thus, butyrate and valerate may attenuate the progression of arterial stiffness by regulating inflammation and oxidative stress, further providing a novel preventive and therapeutic target for arterial stiffness.
Another finding of this study is that high levels of circulating formate and isobutyrate were significantly associated with an increased risk of LVH. Formate and isobutyrate have not been traditionally regarded as clinically significant by physicians, and the direct role of formate or isobutyrate in CVD is less understood than that of other SCFAs, such as acetate, propionate, or butyrate.39 Formate, a 1‑carbon molecule, is a mediator of metabolic interactions between the host and microbiome.40 Changes in formate levels may reflect gut microbiome dysbiosis, which has been implicated in hypertension, atherosclerosis, and HF.39 Isobutyrate is a branched‑chain SCFA produced by the gut microbiota primarily through valine fermentation.41 A previous animal study showed increased serum isobutyrate levels in rats with a stress‑dependent form of arterial hypertension.42 Taken together, we speculate that formate and isobutyrate may exert a hazardous effect on subclinical cardiovascular outcomes in T2D patients.
We also performed the subgroup analysis of the patients stratified by age (<65 vs ≥65 y) and sex to further examine the synergistic interactions between the circulating SCFAs and these covariates with the parameters of subclinical CVD. The results showed a positive association between LVH and serum formate level across all tertiles and an inverse association between butyrate / isobutyrate ratio and diastolic dysfunction in the patients younger than 65 years. However, a negative relationship was found between LVH and serum isobutyrate in the patients older than 65 years. In addition, male patients with the highest tertile levels of serum valerate and butyrate had lower risks of baPWV above the median and abnormal ABI, respectively, than those with the lowest tertile levels of serum valerate and butyrate. A previous study reported decreases in the abundance of SCFAs and SCFA‑producing genera with age,43 and aging has been associated with significant alterations in gut microbiota composition and a decline in SCFA production, which may contribute to various age‑related diseases, including T2D, hypertension, and CVD.44 Extensive research on sex differences in changes in SCFAs is limited.45 Our results may help elucidate the role of SCFAs in various subgroups of patients with T2D and subclinical CVD.
Limitations
Several limitations of this study should be acknowledged. First, SCFAs and echocardiographic parameters were measured only once at enrollment, and therefore the effect of variations in SCFA levels on cardiac structure and function over time may be underestimated. In addition, the cross‑sectional study design limits the ability to establish causal relationships between SCFAs levels and cardiac structure and function. Second, the relatively small sample size may have reduced the statistical power of the results. In addition, the participants were enrolled from a single hospital, and the sample may be insufficient to represent the broader population or different ethnicities. Third, we did not have detailed information on diet composition (such as total energy, carbohydrate, protein, and fat intake) and lifestyle, which may influence the serum concentrations of SCFAs. Fourth, the proportion of patients on sodium‑glucose transporter type 2 inhibitors was low in this study, which may be not in line with current common use of this class of drugs in most countries. In addition, we did not analyze stool levels of the SCFAs to compare with their serum levels. Further research is needed to explore the interactions among SCFAs in the serum, feces, and microbiota with subclinical CVDs in T2D patients. Finally, the biological mechanisms of SCFA action in CVD remain unknown, and future in vitro and in vivo studies are necessary to investigate the pathophysiology of SCFAs in CVD and other novel biomarkers in T2D patients.
Conclusions
This study demonstrated various relationships between different SCFAs and subclinical CVD parameters in T2D patients. Our findings suggest that formate, butyrate, isobutyrate, butyrate / isobutyrate ratio, and valerate are potential biomarkers of cardiovascular remodeling in T2D patients. Future studies are warranted to investigate the pathogenic role of SCFAs in cardiovascular structure and function.
- Saeedi P, Petersohn I, Salpea P, et al. Global and regional diabetes prevalence estimates for 2019 and projections for 2030 and 2045: results from the International Diabetes Federation Diabetes Atlas, 9(th) edition. Diabetes Res Clin Pract. 2019; 157: 107843. | Crossref
- Zieleniewska NA, Szum‑Jakubowska A, Chlabicz M, et al. The prevalence of diabetes and prediabetes: a population‑based study. Pol Arch Intern Med. 2023; 133: 16407. | Crossref
- Bertoni AG, Kramer H, Watson K, et al. Diabetes and clinical and subclinical CVD. Glob Heart. 2016; 11: 337‑342. | Crossref
- Lehrke M, Marx N. Diabetes mellitus and heart failure. Am J Cardiol. 2017; 120: S37‑S47. | Crossref
- Durack J, Lynch SV. The gut microbiome: relationships with disease and opportunities for therapy. J Exp Med. 2018; 216: 20‑40. | Crossref
SUPPLEMENTARY MATERIAL
ARTICLE INFORMATION