Epicardial fat: a noninvasive, noncontrast imaging biomarker for high-risk plaque monitoring on computed tomography
Key words: atherosclerosis, computed tomography, coronary artery disease, diet intervention, high-risk plaque


 CC BY-NC-SA 4.0
Epicardial fat: a noninvasive, noncontrast imaging biomarker for high-risk plaque monitoring on computed tomography
Introduction: Coronary computed tomography angiography (CCTA) is a viable method for monitoring vulnerable plaques; however, noncontrast calcium scoring (CAS) has a limited utility in this context. It is therefore necessary to search for novel noncontrast imaging biomarkers to track high‑risk plaques.
Objectives: We aimed to investigate possible associations between low‑attenuation plaque (LAP) identified on CCTA and noncontrast CAS, pericardial adipose tissue (PAT), and epicardial adipose tissue (EAT) in patients with nonobstructive coronary atherosclerosis undergoing serial CCTA.
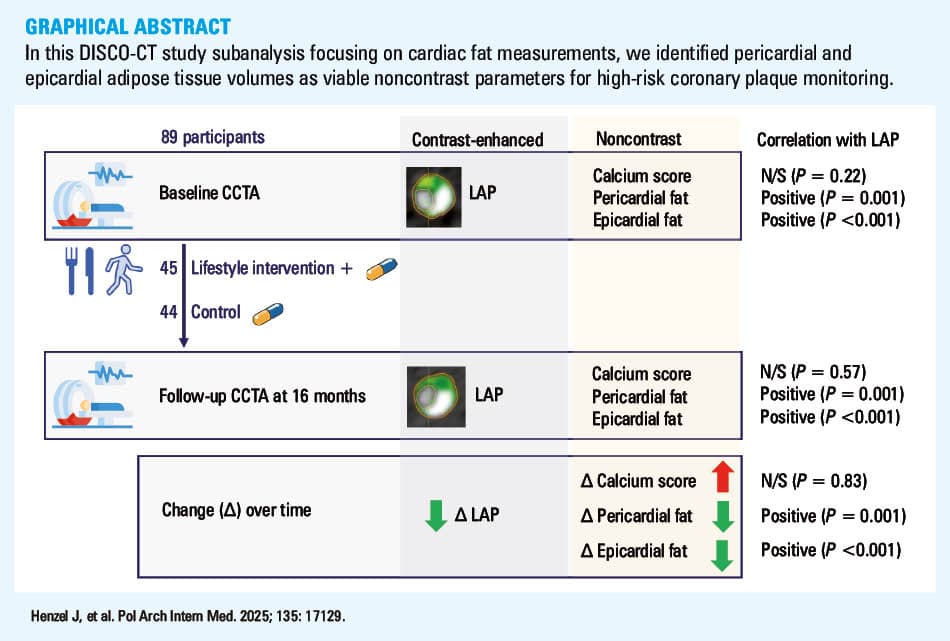
Patients and methods: We analyzed data from 89 participants (40% women; mean [SD] age, 60 [7.7] y) enrolled in the Dietary Intervention to Stop Coronary Atherosclerosis in Computed Tomography trial. CCTA was performed at baseline and repeated at mean (SD) follow‑up of 66.8 (13.7) weeks. CAS and cardiac fat were measured on noncontrast reconstructions and analyzed in relation to contrast‑derived LAP.
Results: Mean (SD) decrease in LAP burden was 0.23% (1%; P = 0.04), median (interquartile range [IQR]) decrease in PAT volume was 4.2 (–36.9 to 8.3) cm³ (P <0.001), median (IQR) decrease in EAT volume was 2.8 (–12.2 to 6.7) cm³ (P = 0.01), and median (IQR) increase in CAS was 21.2 (1.7–71.7) Agatston units (P <0.001). Positive correlations were found between changes in LAP burden and both PAT and EAT volumes (r = 0.349; P = 0.001 and r = 0.49; P <0.001, respectively), but not with a change in CAS. Multivariable linear regression analysis identified EAT as an independent predictor of LAP regression (95% CI, 0.007–0.032; P = 0.003).
Conclusions: Pericardial and epicardial fat volumes and their dynamics are positively associated with LAP burden, while CAS is not. Monitoring EAT volume on noncontrast CT may facilitate the assessment of high‑risk plaque progression or regression, overcoming the limitations of CAS.
What's new?
In this subanalysis of the computed tomography study of dietary approaches to stop coronary atherosclerosis focusing on cardiac fat measurements, we recognized epicardial adipose tissue as a viable noncontrast parameter for high‑risk coronary plaque monitoring. Unlike calcium score, epicardial fat volume dynamics reflects quantitative changes in the low‑attenuation plaque over time. These pilot observations lay the groundwork for further imaging algorithms to stratify cardiovascular risk by noncontrast coronary computed tomography.
Introduction
Coronary computed tomography angiography (CCTA) not only facilitates individualized cardiovascular risk assessment by detecting vulnerable atherosclerosis, but it also enables the monitoring of changes in plaque composition, thereby offering insight into the effectiveness of antiatherosclerotic treatments.1-4 Beyond traditional lumen stenosis evaluation, modern CCTA applications allow for precise quantification of plaque burden and identification of various coronary plaque features associated with adverse prognosis, including low‑attenuation plaque (LAP). This type of coronary plaque is associated with an increased risk of cardiovascular events and is often referred to as high‑risk or vulnerable plaque.5,6
However, one limitation of CCTA is the requirement for contrast agents, which restricts its use in widespread screening and in patients with kidney impairment. Traditional methods, such as calcium scoring (CAS), do not necessitate contrast administration; however, they have not been effective in monitoring the progression of vulnerable atherosclerosis, particularly in statin‑treated patients.1,2,7-10 Recent studies have suggested that cardiac fat quantification, which can also be obtained from noncontrast CT imaging, may serve as a method for assessing residual metabolic risk.11,12 Particularly, epicardial adipose tissue (EAT), a compartment of pericardial adipose tissue (PAT) situated between the myocardium and the visceral layer of the pericardium,13-15 has been emphasized for its role in coronary atherogenesis. Nevertheless, there are limited data on the simultaneous, longitudinal evaluation of cardiac fat volume and vulnerable plaque burden.16
It has been shown that clinical risk scores based on traditional risk factors of coronary artery disease (CAD) may be limited and thus, a need to search for novel risk stratifiers has been postulated.17-20 Developing a method to assess vulnerable atherosclerosis through noncontrast CT imaging could offer a new avenue for cardiovascular risk assessment and therapy monitoring. Therefore, we aimed to investigate the correlations between vulnerable plaque components identified via CCTA and noncontrast CT parameters, such as CAS, PAT, and EAT, in a dynamic setting of patients with nonobstructive coronary atherosclerosis undergoing serial CCTA.
Patients and methods
Study population
We analyzed data collected from 89 participants of the DISCO‑CT (Dietary Intervention to Stop Coronary Atherosclerosis in Computed Tomography; NCT02571803), a single‑center randomized pilot study carried out in the years 2015–2019.21 The study participants were recruited from the patients in whom CCTA was performed as part of routine CAD diagnostics. The patients with nonobstructive coronary atherosclerosis (stenosis <70%) in at least 2 coronary artery segments on the baseline CCTA and qualified for conservative treatment who were willing to participate in a lifestyle intervention‑oriented program were included in the study. The main exclusion criteria were type 2 diabetes mellitus, cardiomyopathy, heart disease with indications for cardiac surgery within 12 months, genetic familial hypercholesterolemia and / or other congenital metabolic disorders. A complete list of inclusion and exclusion criteria is provided in Supplementary material, Table S1. A total of 97 patients were included in the trial. Six patients (6.2%) did not complete the study (consent withdrawal). Three patients (3.1%) were excluded from the analysis due to incomplete imaging of pericardial fat area on CT. The study design flowchart is presented in Supplementary material, Figure S1. As per the study protocol, all participants were randomized (1:1) to intensive diet and lifestyle intervention atop optimal medical therapy (OMT) vs OMT alone.
The intervention program was implemented at the study site. In a close cooperation of cardiologists and clinical dietitians, the intervention arm participants were provided with dietary counselling based on the dietary approaches to stop hypertension (DASH) diet and encouraged to gradually increase their physical activity to attain the goals recommended by the 2016 European Guidelines on cardiovascular disease prevention in clinical practice.22 The recommendations were implemented at 6 visits: at baseline and after 1, 3, 6, 9, and 12 months (follow‑up visit). Adherence to dietary recommendations was evaluated based on a food frequency questionnaire with a focus on food group consumption aligned with the DASH diet. Energy and nutrient intake were calculated based on the results of a 24‑hour dietary interview. The level of physical activity was recorded using self‑reported frequency questionnaires, and the type of activity was evaluated at each study visit.21
Medical therapy was optimized in all study participants (both intervention and control arm) at the baseline visit, after 6, and 12 months (follow‑up visit), aiming to lower low‑density lipoprotein cholesterol (LDL‑C) level, increase the use of antiplatelet treatment, and adjust blood pressure control, as recommended by the 2016 European Society of Cariology guidelines on cardiovascular disease prevention in clinical practice.22 Detailed information on medical therapy is presented in Supplementary material, Table S2.
Since the study intervention was diet- and lifestyle‑oriented, and the study visits were scheduled distinctly depending on the arm allocation, there was no blinding.
CCTA was performed twice, at baseline and after a mean (SD) follow‑up of 66.8 (13.7) weeks, using a 2 × 192‑multislice scanner (temporal resolution 66 ms, Somatom Force, Siemens Healthineers, Erlangen, Germany).
Ethics
The study was approved by the Bioethics Committee of the Institute of Cardiology in Warsaw (IK‑NP‑0021‑51/1514/15). Written informed consent was obtained from each patient. The study protocol conformed to the ethical guidelines of the 1975 Declaration of Helsinki as reflected in a priori approval by the institution’s human research committee.
Quantification of noncontrast computed tomography parameters
CAS, PAT, and EAT were measured on CT reconstructions for coronary calcium scoring (3‑mm thick axial slices; Figure 1A). CAS was assessed using a dedicated software and expressed in Agatston units. EAT and PAT volumes, expressed in cm3, were measured on the same noncontrast reconstructions with a dedicated offline software (syngo.via Frontier, Siemens Healthineers) using the semi‑automatic segmentation technique. PAT was defined as areas with attenuation values ranging from –45 to –195 Hounsfield units (Figure 1B).23,24 To quantify EAT, 2 blinded observers with experience in CCTA analysis manually traced the visceral pericardium in every third slice of the scan from the bifurcation of the pulmonary artery to the apex (Figure 1C). Computer software automatically interpolated the parietal pericardium in the remaining slices. The images were verified for accuracy by the investigators and optimized, if necessary.

Coronary plaque quantification
Plaque analysis including total atheroma volume (expressed in mm3) and LAP burden (expressed in %) was performed using a semiautomated plaque analysis software (QAngioCT, Medis Medical Imaging Systems, Leiden, the Netherlands). LAP was defined as the volume of coronary plaque below 30 Hounsfield units divided by the vessel volume in each analyzed coronary artery segment. Segmental measurements were added per patient to calculate LAP burden (Supplementary material, Figure S2).
Anthropometric measurements
Height, body mass, and body mass index (BMI) were measured with an accuracy of 0.1 cm and 0.05 kg using the electronic device BSM370 (InBody, Seoul, South Korea). Visceral fat area, defined as the cross‑sectional area of visceral fat found in the abdomen, expressed in cm2, was measured using a body composition analyzer (InBody S10 Body Water Analyzer, Seoul, South Korea; Supplementary material, Figure S3). The measurements were carried out on an empty stomach, with an at least 12‑hour interval from the last physical activity, without shoes and with minimum clothing on.
Clinical data
Medical records including traditional CAD risk factors and medical therapy were obtained from all study participants. A laboratory panel including total cholesterol, LDL‑C, high‑density lipoprotein cholesterol (HDL‑C), triglycerides, and high‑sensitivity C‑reactive protein (hs‑CRP) was taken at baseline and follow‑up visits.
Interobserver and intraobserver variability
Inter- and intraobserver variability were studied for the EAT measurements 6 months after the original imaging data analysis. The interobserver variability was checked in 9 randomly chosen cases (10.1%) by the other investigator, while intraobserver reproducibility was performed in 9 randomly chosen cases (10.1%) by each investigator. Intraclass correlation coefficients were calculated.
Statistical analysis
Data normality was analyzed with the Shapiro–Wilk test. Continuous variables were described using means (SD) when distributed normally, otherwise using medians and interquartile range (IQR). Qualitative variables were reported as numbers and percentages. Baseline and follow‑up values were compared using the paired t test for normally distributed variables and the paired Wilcoxon signed ranks test for non‑normally distributed variables. Categorical variables were compared using the χ2 test or Fisher exact test (for counts below 5).
The Pearson correlation (reported with R and P values) was used for normally distributed variables, and Spearman correlation (reported with r and P value) was used otherwise. A P value below 0.05 was considered significant.
Univariable linear regression analysis was performed to determine the relationship between change in LAP burden and potential predictors of atherosclerosis. To this end, we investigated traditional clinical risk factors of CAD (age, sex, smoking history, arterial hypertension, hyperlipidemia, obesity), clinical characteristics (statin treatment, antiplatelet treatment, impaired glucose tolerance, prior myocardial revascularization, original DISCO‑CT allocation arm), traditional laboratory biomarkers (cholesterol fractions, hs‑CRP), obesity characteristics (change in body mass, BMI, visceral fat area), and noncontrast CT imaging biomarkers (PAT volume, EAT volume, CAS). Multivariable linear regression analysis was performed to adjust for potential confounders. Variables with P values below 0.1 in the univariable regression were included in the multivariable regression models created separately for changes in EAT (model A) and PAT volumes (model B) serving as the independent variables and change in LAP serving as the dependent variable. To account for multiple testing, P values below 0.025 were considered significant in this part of the analysis.
Statistical analysis was performed using SPSS software, version 21 (IBM SPSS Statistics, IBM Corp., Chicago, Illinois, United States).
Results
The analysis included 89 participants, of whom 45 (50.5%) represented the experimental arm of the original study, and 36 (40.4%) were women. Mean (SD) age was 60 (7.7) years. Detailed information on the demographic and clinical characteristics of the study population is presented in Table 1.
Characteristics | Total (n = 89) | |
Data are presented as number (percentage) unless indicated otherwise.
a Percutaneous coronary angioplasty only (no coronary artery bypass grafting)
b Inability to continue statin medication due to adverse effects documented in patient’s medical records
c Atorvastatin 40 mg per day or above, or rosuvastatin 20 mg per day or above
d Ezetimibe 10 mg per day and / or fenofibrate 200 mg per day or above
Abbreviations: ACEI, angiotensin‑converting enzyme inhibitor; ARB, angiotensin receptor blocker; BMI, body mass index; CCS, Canadian Cardiovascular Society (angina grading); IQR, interquartile range | ||
Women | 36 (40.5) | |
Age at baseline, y, mean (SD) | 60 (7.7) | |
Previous myocardial revascularizationa | 4 (4.5) | |
Angina functional class | No angina or CCS 1 | 83 (93.3) |
CCS 2 | 6 (7.9) | |
CCS 3 or 4 | 0 | |
Impaired glucose tolerance | 10 (11.2) | |
Hyperlipidemia | 86 (96.6) | |
Arterial hypertension | 79 (88.7) | |
Antiplatelet treatment | 57 (64) | |
Statin treatment | 60 (67.4) | |
Confirmed statin intoleranceb | 6 (6.7) | |
High‑intensity dose statinc | 14 (15.7) | |
Other hypolipemic drugsd | 6 (6.7) | |
β-Blocker | 52 (58.4) | |
Calcium channel blocker | 28 (31.5) | |
ACEI/ARB | 64 (71.9) | |
Number of hypotensive drugs, median (IQR) | 2 (1–3) | |
Metformin | 7 (7.9) | |
Atrial fibrillation | 6 (6.7) | |
Smoking history | 54 (61) | |
Current smoking | 9 (10.1) | |
Overweight (BMI ≥25 kg/m2) | 70 (78.7) | |
Obesity (BMI ≥30 kg/m2) | 40 (44.9) | |
Study intervention (experimental arm) | 45 (50.5) | |
Observation time, wk, mean (SD) | 66.8 (13.7) | |
Clinical and laboratory biomarkers
Baseline‑to‑follow‑up differences were significant for the laboratory marker levels, including a decrease in total cholesterol, LDL‑C, and hs‑CRP, and an increase in HDL‑C. A significant difference was observed in the proportion of patients who achieved LDL‑C level of 115 mg/dl at follow‑up, as compared with baseline (Table 2).
Parameter | Baseline | Follow‑up | ∆ | P value |
Data are presented as mean (SD) or median (interquartile range) unless indicated otherwise.
a Patients with triglyceride values >400 mg/dl were excluded.
SI conversion factors: to convert TC, HDL‑C, LDL‑C, and TG to mmol/l, multiply by 0.0259; hs‑CRP to nmol/l, by 9.524
Abbreviations: ∆, baseline‑to‑follow‑up change; CAS, calcium score; CCTA, coronary computed tomography angiography; EAT, epicardial adipose tissue; HDL‑C, high‑density lipoprotein cholesterol; hs‑CRP, high‑sensitivity C‑reactive protein; HU, Hounsfield unit; LDL‑C, low‑density lipoprotein cholesterol; n/a, not applicable; PAT, pericardial adipose tissue; TC, total cholesterol; TG, triglyceride; VFA, visceral fat area; others, see Table 1 | ||||
Laboratory biomarkers | ||||
TC, mg/dl | 179.8 (43.4) | 165.3 (36) | –14.5 (39.6) | 0.001 |
LDL‑C, mg/dl; n = 87a | 109.1 (30.8) | 96.2 (30.8) | –12.6 (37.2) | 0.002 |
LDL‑C <115 mg/dl; n (%) | 52 (55.9); n = 87a | 68 (73.1); n = 88a | n/a | 0.01 |
HDL‑C, mg/dl | 56 (15) | 58.5 (16.3) | 2.5 (8.4) | 0.007 |
TG, mg/dl | 82 (49.2–119) | 97 (67–133.5) | 6 (–19.2 to 48.7) | 0.08 |
hs‑CRP, mg/l; n = 86 | 0.13 (0.09–0.25) | 0.1 (0.06–0.16) | –0.03 (–0.11 to 0.02) | <0.001 |
Anthropometric biomarkers | ||||
Body mass, kg | 83.6 (15.6) | 81.1 (14.3) | –1.7 (–3.4 to 0.7) | <0.001 |
BMI, kg/m2 | 29.4 (4) | 28.5 (3.7) | –0.7 (–1.3 to –0.1) | <0.001 |
VFA, cm2 | 104 (77.8–135.4) | 96 (71.2–117.2) | –6.2 (–24.4 to 0) | <0.001 |
CCTA imaging biomarkers | ||||
Total atheroma volume, mm3 | 993.9 (321.8) | 998.1 (304.1) | 4.2 (154.8) | 0.8 |
Low‑attenuation plaque, % | 1.57 (1.29) | 1.34 (0.59) | –0.23 (1) | 0.041 |
Noncontrast CT imaging biomarkers | ||||
CAS, Agatston units, n = 88 | 83.6 (29.5–260.9) | 116.7 (41.4–339.9) | 21.2 (1.7–71.7) | <0.001 |
PAT volume, cm3 | 217.1 (99.3) | 199.3 (82.5) | –4.2 (–36.9 to 8.3) | <0.001 |
EAT volume, cm3 | 128.9 (50.9) | 123.5 (46.2) | –2.8 (–12.2 to 6.7) | 0.01 |
EAT density, HU | –94 (–96 to –89) | –93 (–96 to –90) | 7 (4–10) | 0.73 |
PAT density, HU | –101 (–104 to –96.5) | –100 (–103 to –97) | 0 (–1 to 3) | 0.06 |
Significant decreases were observed in body mass, BMI, and visceral fat area. Complete data are presented in Table 2.
Positive correlations were found for the baseline LAP burden and baseline BMI (r = 0.341; P = 0.001) and visceral fat area (R = 0.246; P = 0.02), whereas a negative correlation was observed for HDL‑C concentration (R = –0.209; P = 0.04).
Positive correlations were seen for follow‑up LAP burden and follow‑up BMI (r = 0.392; P <0.001) and visceral fat area (R = 0.218; P = 0.04), as well as for changes in LAP burden and changes in BMI (r = 0.436; P <0.001) and visceral fat area (R = 0.265; P = 0.01).
Coronary computed tomography angiography plaque evaluation
The mean total atheroma volume did not change significantly during the study observation, while the mean decrease in LAP was 0.23% (SD, 1%; P = 0.04; Supplementary material, Figure S4). Complete data are available in Table 2. Overall, LAP reduction was observed in 50 patients (56.2%), 27 in the experimental arm (60%), and 23 in the control arm (52.3%; P = 0.46).
Noncontrast computed tomography biomarker
Median (IQR) CAS increased throughout the study observation (∆ = 21.2 [1.7–71.7] Agatston units; P <0.001), while median (IQR) PAT and EAT volumes decreased (∆ = –4.2 [–36.9 to 8.3] cm³; P <0.001 and ∆ = –2.8 [–12.2 to 6.7] cm³; P = 0.01, respectively; Table 2 and Supplementary material, Figure S4).
At baseline, positive correlations were found between LAP burden and both PAT (R = 0.345; P = 0.001) and EAT volumes (R = 0.397; P <0.001), whereas the correlation with CAS was insignificant (r = 0.133; P = 0.22; Figure 2A–2C).

At follow‑up, similar positive correlations were seen between LAP burden and both PAT (R = 0.454; P = 0.001) and EAT (R = 0.441; P <0.001) volumes, whereas the correlation with CAS was insignificant (r = 0.061; P = 0.57; Figure 2D–2F).
Positive correlation was observed between the change in LAP burden and changes in both PAT (r = 0.349; P = 0.001) and EAT (r = 0.49; P <0.001) volumes, whereas the correlation with the change in CAS was insignificant (r = –0.023; P = 0.83; Figure 2G–2I).
Multivariable linear regression models
Multivariable linear regression models were computed to assess the usefulness of changes in EAT (model A) and PAT volumes (model B) as predictors of LAP regression. The original study allocation arm, change in visceral fat area, change in BMI, and impaired glucose tolerance were included as potential confounders.
In the model A, a significant positive association between the changes in EAT volume and LAP burden was demonstrated, independent of other cofactors (unstandardized β = 0.019; 95% CI, 0.007–0.032; P <0.001; Table 3). The model B, however, did not confirm the association between the changes in LAP burden and PAT volume when adjusted for other cofactors (unstandardized β = 0.003; 95% CI, 0.015–0.416; P = 0.33; Table 3).
Parameter | Unstandardized β | Standardized β | 95% CI | P value |
a P values 0.05–0.1; b P values <0.05; c P values <0.025 in the multivariable regression analysis (parts B and C); 95% CI refers to the nonstandardized β coefficients
| ||||
Univariable regression | ||||
Age | 0.008 | 0.058 | –0.021 to 0.037 | 0.59 |
Sex | 0.311 | 0.147 | –0.135 to 0.756 | 0.17 |
Intervention arm allocation | –0.393 | –0.189 | –0.827 to 0.042 | 0.08a |
Arterial hypertension | –0.227 | –0.069 | –0.926 to 0.472 | 0.52 |
Hyperlipidemia | –0.593 | –0.103 | –1.812 to 0.626 | 0.34 |
Statin treatment | 0.137 | 0.054 | –0.402 to 0.676 | 0.62 |
Antiplatelet treatment | –0.119 | –0.05 | –0.624 to 0.386 | 0.64 |
∆TC | <0.001 | 0.003 | –0.006 to 0.006 | 0.97 |
∆LDL‑C | <0.001 | 0.003 | –0.006 to 0.006 | 0.93 |
∆HDL‑C | 0.008 | 0.013 | –0.018 to 0.035 | 0.53 |
∆TG | –0.001 | –0.078 | –0.003 to 0.001 | 0.47 |
LDL‑C <115 mg/dl at follow‑up | 0.128 | 0.051 | –0.405 to 0.661 | 0.64 |
∆hs‑CRP | –0.036 | –0.019 | –0.452 to 0.38 | 0.86 |
Smoking history | –0.223 | 0.083 | –0.797 to 0.351 | 0.44 |
Impaired glucose tolerance | –0.833 | –0.229 | –1.585 to 0.08 | 0.031b |
Prior coronary revascularization | –0.065 | –0.013 | –1.132 to 1.003 | 0.91 |
∆Body mass | 0.113 | 0.45 | 0.065–0.16 | <0.001b |
∆BMI | 0.321 | 0.436 | 0.18–0.462 | <0.001b |
∆VFA | 0.009 | 0.265 | 0.002–0.015 | 0.01b |
∆CAS | 0 | 0.022 | –0.003 to 0.003 | 0.84 |
∆EAT | 0.027 | 0.49 | 0.016–0.037 | <0.001b |
∆PAT | 0.008 | 0.349 | 0.004–0.013 | 0.001b |
Multivariable regression model A (R2 =0.296; ANOVA F(5,83) = 6.973; P <0.001) | ||||
∆EAT | 0.019 | 0.353 | 0.007–0.032 | 0.003c |
Intervention arm allocation | –0.159 | –0.077 | –0.576 to 0.258 | 0.45 |
Impaired glucose tolerance | –0.503 | –0.139 | –1.206 to 0.2 | 0.16 |
∆VFA | 0.001 | 0.021 | –0.007 to 0.008 | 0.86 |
∆BMI | 0.12 | 0.163 | –0.063 to 0.302 | 0.2 |
Multivariable regression model B (R2 =0.228; ANOVA F(5,83) = 4.891; P = 0.001) | ||||
∆PAT | 0.003 | 0.126 | –0.003 to 0.009 | 0.33 |
Intervention arm allocation | –0.138 | –0.066 | –0.576 to 0.301 | 0.53 |
Impaired glucose tolerance | –0.536 | –0.148 | –1.275 to 0.203 | 0.15 |
∆VFA | 0.001 | 0.036 | –0.006 to 0.009 | 0.76 |
∆BMI | 0.216 | 0.293 | 0.015–0.416 | 0.035b |
Intraobserver variability
There was an excellent agreement in EAT volume measurements between the 2 observers, with an intraclass correlation coefficient of 0.99 (95% CI, 0.96–0.99; P <0.001). The intraobserver correlation coefficient was 0.97 (95% CI, 0.84–0.99; P <0.001) for the Observer 1, and 0.98 (95% CI, 0.93–0.99; P <0.001) for the Observer 2.
Discussion
By demonstrating that a decrease in epicardial and pericardial adipose tissue volume is associated with LAP regression on noncontrast CT, our findings uncovered a promising approach to noninvasive monitoring of coronary atherosclerosis.
Our results indicated a persistent positive association between the volume of cardiac fat—both pericardial and epicardial—and high‑risk coronary plaque burden at each of the 2 study time points (Figure 2A and 2B; Figure 2D and 2E). Previous cross‑sectional studies have demonstrated associations between cardiac fat and total coronary plaque burden,25 noncalcified coronary plaque,26,27 and the presence of high‑risk plaque features, such as LAP, positive remodeling, spotty calcifications, and decreased fibrous cap thickness.28-32 The relationship between increased epicardial fat volume and high‑risk plaque features has also been confirmed in meta‑analyses.33,34 The utility of cardiac fat as a predictor of major adverse cardiovascular events has been reported in studies involving patients free of cardiovascular diseases35,36 as well as those with established CAD.37 As a unique study based on prospective quantification of cardiac fat and coronary atherosclerosis, our observations add to the existing body of literature, showing direct associations between changes in cardiac fat volume and high‑risk coronary plaque burden in a longitudinal context (Figure 2G and 2H). In the case of EAT, this association remained significant after adjusting for traditional cardiovascular risk factors and other anthropometric measurements, which further enhances the potential of EAT as an imaging biomarker for high‑risk plaque monitoring.
In contrast, changes in CAS did not reflect variations in high‑risk coronary plaque burden, despite a significant increase, by approximately 25%, of CAS in the study population. CAS increase was comparable in patients with and without LAP reduction (Supplementary material, Table S3). Despite evidence suggesting CAS as a cardiovascular risk modifier in asymptomatic, very low‑risk patients,38 the utility of CAS as a marker of vulnerable plaque in patients with established coronary atherosclerosis remains questionable. On the one hand, CAS may overlook the presence of entirely noncalcified lesions and should always be interpreted with caution.39,40 On the other hand, coronary plaque modification is substantially affected by statins, which promote plaque stabilization by increasing its density.1,2,10 The fact that coronary plaque regression was perceivable in our study cohort within only 16 months of observation could be partly attributed to medical treatment optimization including statin use, resulting in local inflammation mitigation and plaque transformation toward calcified lesions. In Figure 3, we present an exemplary case of coronary plaque reduction with a phenotypic plaque transformation from a high‑risk, lipid‑rich to calcified lesion. Nevertheless, we were unable to show any significant differences regarding dynamics of the plaque parameters depending on statin treatment or high‑intensity dose statin regimen, probably due to small subgroup sizes (eg, only 15.7% of the patients received high‑intensity dose statin), as presented in Supplementary material, Table S4.

Recent studies highlight the importance of comprehensive assessment of adipose tissue in patients with coronary atherosclerosis to improve metabolic risk stratification.41,42 In this context, epicardial fat has garnered particular attention due to its anatomical proximity to the coronary arteries, which may influence plaque modification through various mechanisms, including inflammation, endothelial dysfunction, oxidative stress, and glucotoxicity.14,15 In our study population, changes in EAT not only outperformed changes in PAT in predicting high‑risk plaque regression but also exceeded changes in visceral fat area, a recognized marker of cardiometabolic risk (Table 3).43,44 Since epicardial fat responds to therapies, such as with thiazolidinediones, glucagon‑like peptide 1 receptor agonists, dipeptidyl peptidase‑4 inhibitors, and statins, our findings should encourage further research on epicardial fat as a modifiable therapeutic target in patients with metabolic diseases.33,42,45
The selection of an optimal imaging modality for cardiac fat assessment is of paramount importance in clinical practice. Noncontrast cardiac magnetic resonance (CMR) imaging has long been regarded as the gold standard for this purpose, owing to its advantages in safety, visualization, and quantification.46 However, numerous advantages of cardiac CT over CMR should be recognized, including shorter acquisition time, lower susceptibility to motion artifacts, and wider availability. Compared with CMR, cardiac CT provides superior spatial resolution allowing for more precise visualization of regional fat depots. In this regard, the semimanual quantification of EAT may pose challenges in everyday practice, regarding tracing the visceral pericardium and correctly defining the anatomical limits by individual imagers. Nevertheless, studies have reported high reproducibility of EAT quantification on CT scans.47 In our analysis, similarly, excellent inter- and intraobserver reproducibility of the measurements were achieved. In the near perspective, artificial intelligence–based software applications are envisioned to offer a more convenient approach, enabling a fully automated EAT measurement in less than 30 seconds per patient, which can help to integrate noncontrast CT‑derived epicardial fat quantification into daily clinical practice.48,49
Conversely, the utility of pericardial fat assessment remains uncertain. Although a positive association between PAT volume with LAP burden was observed throughout the study, multivariable regression analysis suggests that this association may be confounded by changes in body mass (or BMI). Studies indicate that the extrapericardial portion of PAT may be more susceptible to changes in body mass than EAT owing to metabolic differences.50,51 However, it cannot be excluded that our analysis lacked sufficient statistical power to definitely rule out the role of pericardial fat, which highlights the need for studies involving larger cohorts.
It is important to acknowledge that our analysis does not provide information on diabetic patients, and thus generalizability of our results may be limited in the real‑world population of patients with CAD. As per the study protocol, the patients with diabetes mellitus were excluded due to their supposedly distinct metabolic profile, which would require detailed additional clinical and laboratory evaluation beyond the scope of the pilot DISCO‑CT study. Nonetheless, our data did not identify impaired glucose metabolism as a confounder in the multivariable regression analysis, despite a significant positive association with LAP progression in the univariable analysis. Certainly, a representation of diabetic patients would be highly desirable in future studies.
There are additional limitations to this study that should be addressed. First, pericardial fat measurements were based on an arbitrary attenuation range (expressed in Hounsfield units), which is not uniformly defined in the literature; based on previous experience of our research group, we adopted the methodology suggested by Rosenquist et al26 and Ueda et al.27 Due to the pilot character of the original study, the sample size was small, and the observation period was too short for cardiovascular events to occur. Nevertheless, we believe that this analysis provides a mechanistic explanation for the utility of cardiac fat as a plausible prognostic predictor strongly associated with vulnerable plaque progression. Further long‑term longitudinal studies involving larger groups are necessary to confirm this observation and establish prognosis‑associated thresholds for cardiac fat reduction.
Despite these limitations, our analysis offers an innovative perspective on the concomitant changes in noncontrast CT cardiac imaging biomarkers in relation to contrast CT‑derived vulnerable plaque burden. We believe that these pilot observations may contribute to further refining of imaging algorithms aiming to stratify cardiovascular risk and monitor nonobstructive coronary lesions without the need for contrast administration, which would be advantageous in terms of safety and availability, especially in patients with severe renal impairment or iodine contrast allergies.
Conclusions
Pericardial and epicardial fat volumes and their dynamics are positively associated with LAP burden, while CAS is not.
Monitoring EAT volume using noncontrast CT may facilitate the assessment of high‑risk plaque progression or regression, overcoming the limitations of CAS.
- Lee SE, Chang HJ, Sung JM, et al. Effects of statins on coronary atherosclerotic plaques: the PARADIGM study. JACC Cardiovasc Imaging. 2018; 11: 1475‑1484. | Crossref
- Inoue K, Motoyama S, Sarai M, et al. Serial coronary CT angiography‑verified changes in plaque characteristics as an end point: evaluation of effect of statin intervention. JACC Cardiovasc Imaging. 2010; 3: 691‑698. | Crossref
- Tamarappoo B, Otaki Y, Doris M, et al. Improvement in LDL is associated with decrease in non‑calcified plaque volume on coronary CTA as measured by automated quantitative software. J Cardiovasc Comput Tomogr. 2018; 12: 385‑390. | Crossref
- Shin S, Park HB, Chang HJ, et al. Impact of intensive LDL cholesterol lowering on coronary artery atherosclerosis progression: a serial CT angiography study. JACC Cardiovasc Imaging. 2017; 10: 437‑446. | Crossref
- Williams MC, Kwieciński J, Doris M, et al. Low‑attenuation noncalcified plaque on coronary computed tomography angiography predicts myocardial infarction: results from the multicenter SCOT‑HEART trial Scottish computed tomography of the HEART. Circulation. 2020; 141: 1452‑1462. | Crossref
SUPPLEMENTARY MATERIAL
ARTICLE INFORMATION