Altered fibrin clot properties and the risk of thromboembolism in women with obstetric antiphospholipid syndrome: a cohort study
Key words: fibrin clot, fibrinolysis, obstetric antiphospholipid syndrome, thromboembolism

 CC BY 4.0
Altered fibrin clot properties and the risk of thromboembolism in women with obstetric antiphospholipid syndrome: a cohort study
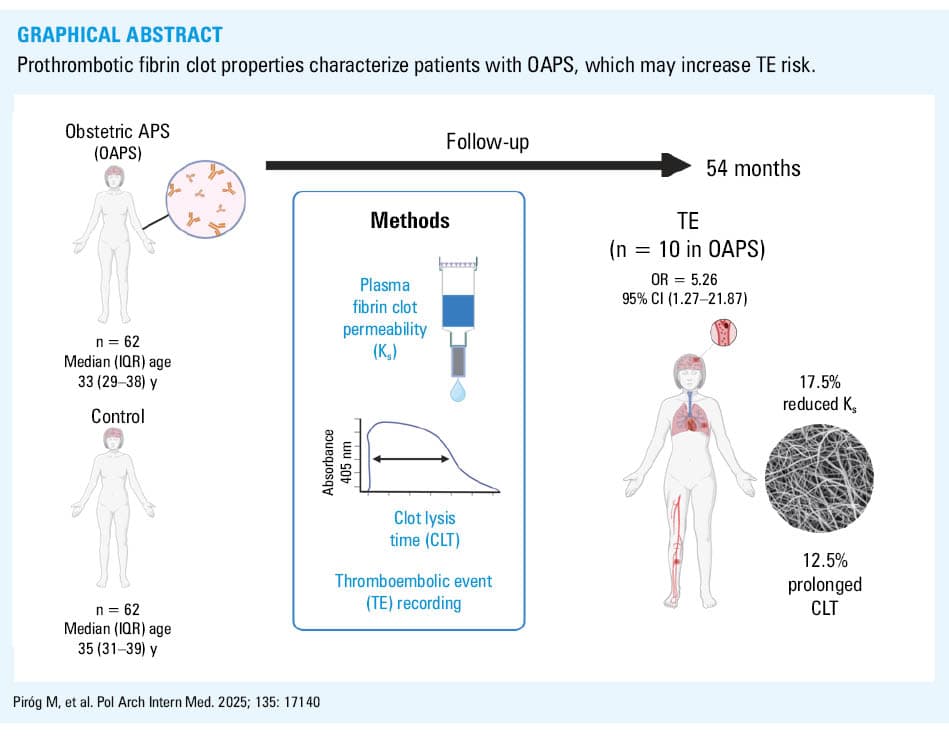
Introduction: Formation of denser and poorly lysable fibrin clots has been reported in thrombotic antiphospholipid syndrome (APS). However, it is not known whether unfavorably altered fibrin clot properties and suppressed fibrinolysis characterize women with obstetric APS (OAPS) free of thromboembolic events (TEs).
Objectives: This study sought to investigate fibrin clot characteristics and if they predict TE in women with OAPS.
Patients and methods: In 62 women with OAPS and 62 controls, we determined plasma fibrin clot properties, including permeability (Ks) and clot lysis time (CLT), along with the levels of thrombin activatable fibrinolysis inhibitor (TAFI), plasminogen activator inhibitor‑1 (PAI‑1), plasminogen, and endogenous thrombin potential (ETP). TEs were recorded during median (interquartile range) follow‑up of 54 (49–58) months.
Results: The patients with OAPS had lower Ks (by 16.4%) and longer CLT (by 16.9%), with slightly higher ETP (by 4.2%), higher TAFI antigen level (by 15.6%), lower plasminogen level (by 7.9%), and similar PAI‑1 antigen level, as compared with controls (all P <0.05). The patients with high‑risk OAPS (n = 47; 75.8%) and positive for lupus anticoagulant (LA) had lower Ks and longer CLT than the low‑risk and LA‑negative individuals. There were no differences in fibrin clot properties and ETP between the patients positive for a single antiphospholipid antibody and controls. During follow‑up, higher odds of developing TEs were observed in the patients with OAPS (adjusted odds ratio, 5.26; 95% CI, 1.27–21.87), and those with OAPS who experienced a TE (16.1%; 2.2/year) had lower baseline Ks (by 17.5%) and longer CLT (by 12.2; both P <0.05). Reduced Ks (≤6.1 × 10⁻⁹ cm2) predicted TE in the patients with OAPS.
Conclusions: Prothrombotic fibrin clot properties characterize the patients with OAPS, which may increase the risk of TEs.
What's new?
Fibrin clot properties were determined in women with obstetric antiphospholipid syndrome (OAPS) vs controls with similar obstetric complications along with assessment of thromboembolic events (TEs). The patients with OAPS had altered fibrin clot properties, including reduced clot porosity and resistance to lysis in comparison with controls. Over long‑term follow‑up, TEs were associated with more compact fibrin clots and decreased fibrinolysis at baseline. The evaluation of plasma clot permeability could help identify the patients with OAPS who are more likely to develop TEs.
Introduction
Antiphospholipid syndrome (APS) is a systemic autoimmune disease with a prevalence of 40–50 cases per 100 000 adults. It is characterized by a persistent presence of antiphospholipid antibodies (aPL) involving lupus anticoagulant (LA), anticardiolipin antibodies (aCL), and anti-β-2‑glycoprotein I antibodies (aβ2GPI). APS is associated with an increased thrombotic risk of venous and arterial events.1,2
It has also been reported that thrombotic APS patients form compact plasma fibrin clots with small pores, reflected by reduced plasma fibrin clot permeability (Ks) and impaired lysability, related to prolonged clot lysis time (CLT).3 The so‑called prothrombotic fibrin clot phenotype may predispose to recurrent thrombotic events in APS patients despite anticoagulation.4
However, women with APS can also manifest solely obstetric complications (obstetric antiphospholipid syndrome [OAPS]),5 usually related to recurrent miscarriages, fetal death, preeclampsia (PEC), and placental insufficiency (PI).6,7 Basic studies proposed multiple mechanisms underlying the association of aPL with poor pregnancy outcomes, involving placental infarction, impaired spiral artery remodeling, and decidua inflammation.1 Moreover, the patients with OAPS are at a risk of venous and arterial thromboembolic events (TEs) ranging from below 1% to 7% annually.8,9 Previous reports showed the possible association of aPL with thrombosis, as reflected by endothelial cell injury, platelet activation, complement activation, inhibition of anticoagulant proteins, and suppressed fibrinolysis.3,10 It is, however, unclear whether the patients with OAPS share similar fibrin clot properties, including hypofibrinolysis, with thrombotic APS patients.
We hypothesized that the patients with OAPS free of prior TEs have unfavorably altered fibrin clot properties associated with an increased risk of TEs during long‑term follow‑up.
Patients and methods
Population
Between January 2014 and March 2017, a total of 292 participants with pregnancy‑related complications were referred to the Department of Thromboembolic Disorders, Institute of Cardiology in Kraków, Poland, with a suspicion of APS. All participants fulfilled at least 1 of the following clinical obstetric criteria: 1) at least 3 consecutive prefetal (before 10 weeks of gestation) and / or early fetal (from 10 weeks + 0 days to 15 weeks + 6 days) deaths, 2) fetal death (from 16 weeks + 0 days to 33 weeks + 6 days) in the absence of either PEC or PI with severe features, 3) either PEC or PI with severe features (<34 weeks + 0 days) with / without fetal death, or 4) both PEC and PI with severe features (<34 weeks + 0 days) with / without fetal death. PEC and PI were defined according to standard definitions.11 All participants were enrolled in the study at least 3 months after the last obstetric complication. The control group was selected from women free of OAPS, matched for age, body mass index (BMI), and type of obstetric complications, who were diagnosed in our center during the same time period.
Exclusion criteria were as follows: prior TE (including documented pulmonary embolism [PE], deep vein thrombosis [DVT], ischemic stroke, peripheral artery embolism, or myocardial infarction), exacerbation of systemic lupus erythematosus (SLE), C‑reactive protein (CRP) level above 10 mg/l, signs of acute infection, known cancer, use of hormonal contraceptives, pregnancy, kidney failure (serum creatinine ≥120 µmol/l), severe liver injury, anemia (hemoglobin <10 g/dl) inherited thrombophilia (ie, protein C deficiency, protein S deficiency, antithrombin deficiency, factor V Leiden and prothrombin G20210A mutation), and current anticoagulation. The study flowchart is presented in Supplementary material, Figure S1.
We collected demographic data and information on risk factors along with comorbidities. SLE was diagnosed based on the American College of Rheumatology classification criteria.12 Arterial hypertension was defined as systolic blood pressure equal to or above 140 mm Hg and / or diastolic blood pressure equal to or above 90 mm Hg or taking antihypertensive medications. Obesity was defined as BMI equal to or above 30 kg/m2. Diabetes mellitus was defined in accordance with the American Diabetic Association criteria.13 Smoking status was positive if a patient smoked at least 1 cigarette a day.
The Jagiellonian University Medical College Ethics Committee approved the study (1072.6120.316.2022), and the participants provided their written informed consent in accordance with the Declaration of Helsinki.
Antiphospholipid syndrome diagnosis
OAPS was diagnosed based on the criteria comprising at least 3 points from the clinical domain and at least 3 points from the laboratory domain.6 All aPL were determined at least 3 months after the end of pregnancy / the end of a pregnancy‑related complication, and all aPL measurements were performed twice if positive, at least 12 weeks apart to exclude clinically unimportant or transient changes in antibody levels. LA was assessed as recommended.14
The levels of immunoglobulin (Ig) G and IgM isotypes of aCL, and aβ2GPI along with antiphosphatidylserine / prothrombin (aPS/PT) antibodies were measured with the enzyme‑linked immunosorbent assay (ELISA) kits (INOVA, San Diego, California, United States). The division into moderate (40–79 IU) and high (≥80 IU) levels of aCL/aβ2GPI IgM/IgG was based on ELISAs.6 The cutoff values for both IgG and IgM isotypes of aPS/PT antibodies, that is, above 30 IU, were suggested as positive by the manufacturer.
The women with OAPS were divided into the high‑risk and low‑risk aPL profile groups according to the European League Against Rheumatism (EULAR) recommendations.6 The high‑risk aPL profile was defined as the presence of LA (on at least 2 occasions at least 12 weeks apart), or of double (any combination of LA, aCL, and / or aβ2GPI antibodies at moderate / high levels) or triple (all 3 subtypes) aPL positivity, or the presence of persistently high aPL titers. The women with the low‑risk aPL profile presented isolated aCL or aβ2GPI antibodies at low‑to‑medium titers.
Follow‑up
Follow‑up was started on the day when preliminary laboratory evaluations to confirm eligibility were performed, and was carried out every 6 months with visits to the center or phone calls. Clinical events recorded during follow‑up were TEs. A TE was defined as documented venous or arterial thrombosis.15 Venous thromboembolism (VTE) was confirmed after diagnosis of either DVT, established based on clinical symptoms and a positive finding on color duplex sonography, or PE, identified based on clinical symptoms and positive results of computed tomography angiography. Stroke was diagnosed on the basis of a new and abrupt neurological deficit lasting for at least 24 hours and typical lesions on brain imaging. Myocardial infarction was diagnosed based on typical chest pain and electrocardiographic changes in at least 2 contiguous leads and elevated cardiac troponin levels.
In the absence of a TE, the last visit at the center or telephone contact before June 2023 was considered the end of follow‑up.
Laboratory investigations
Venous blood samples were drawn with minimal stasis using atraumatic venipuncture between 8.00 AM and 10.00 AM, after an overnight fast and a 10‑minute rest.
CRP, fibrinogen, activated partial thromboplastin time (APTT), prothrombin time / international normalized ratio, and D‑dimer were determined using routine laboratory techniques.
Von Willebrand factor activity (ristocetin cofactor activity) was determined turbidimetrically (BCS XP System, Siemens, Erlangen, Germany), and the reference range was 58%–172%. PAI‑1 antigen was determined by ELISA (American Diagnostica, Stamford, Connecticut, United States). Thrombin activatable fibrinolysis inhibitor (TAFI) antigen was determined with an ELISA (Chromogenix, Lexington, Massachusetts, United States). Antiplasmin and plasminogen levels were measured in plasma with chromogenic assays (STA Stachrom 2‑antiplasmin and STA Stachrom plasminogen, Diagnostica Stago, Asnieres, France), and the reference range was 75%–135%.3,16,17 Thrombophilia screening, which comprised protein C, free protein S, antithrombin, factor V Leiden, and prothrombin G20210A genetic variants, was performed in all study participants, as described before.18
Fibrin clot parameters
Ks was assessed using calcium chloride (20 mmol/l) and human thrombin (1 U/ml; Sigma, St. Louis, Missouri, United States) added to citrated plasma (120 µl). Tubes containing the clots were connected via plastic tubing to a reservoir of Tris buffer, and its volume flowing through the gels was measured. A permeation coefficient (Ks), which indicates an average pore size in fibrin networks was assessed using a pressure‑driven system, and was calculated from the equation: Ks = Q × L × η/t × A × Δp, where Q is the flow rate in time t; L is the length of a fibrin gel; η is viscosity of the liquid (in poise); A is the cross‑sectional area (in cm2), and Δp is differential pressure (in dyne/cm2). The lower the Ks values, the more compact the fibrin clot structure.3
CLT was evaluated in citrated plasma mixed with calcium chloride (15 nM), diluted human tissue factor (6 pM; Innovin, Siemens, Marburg, Germany), phospholipid vesicles (12 µM), and recombinant tissue plasminogen activator (60 ng/ml; Boehringer Ingelheim, Ingelheim, Germany). CLT was defined as the time from the midpoint of the clear‑to‑maximum‑turbid transition to the midpoint of the maximum‑turbid‑to‑clear transition.3
Scanning electron microscopy
Plasma clots from 10 randomly selected women, including 5 with OAPS and 5 controls, were fixed using 2.5% glutaraldehyde, washed with distilled water, dehydrated in graded water‑ethanol solutions, dried by the critical point procedure and sputter‑coated with gold.3
Thrombin generation
Thrombin generation was measured using calibrated automated thrombography, as previously described.17 The maximum concentration of thrombin formed during the time of thrombin generation recording was presented as the thrombin peak, and the area under the curve represented endogenous thrombin potential (ETP).
Statistical analysis
The study was powered to have a 90% chance of detecting at least 10% difference in Ks and CLT using a P value of 0.05 based on the values of Ks and CLT established in our laboratory over the last 10 years for healthy individuals (n = 100; mean [SD] Ks, 7.02 [1.09] × 10-9 cm2 and mean CLT, 91 [16] min) and APS patients (n = 100; mean Ks, 6.39 [0.69] × 10-9 cm2 and mean CLT, 106 [21] min). To demonstrate such a difference or greater in Ks, at least 39 participants were required per group, while for CLT, at least 29 were needed.
Categorical variables are presented as numbers and percentages. Continuous variables are expressed as mean (SD) or median with interquartile range (IQR), as appropriate. The Shapiro–Wilk test was used to assess conformity with a normal distribution, whereas non‑normally distributed data were analyzed with the Mann–Whitney test. Categorical variables were analyzed using either the χ2 test or the Fisher exact test. The Spearman rank correlation coefficient (R) was calculated to assess linear associations between the variables. The associations between the variables were examined using logistic regression and expressed as odds ratios (ORs) with 95% CI. The Kaplan–Meier analysis was used to estimate the event‑free rate in the study group, and the results were presented as hazard ratio with 95% CI. Two‑sided P values below 0.05 were considered significant. The statistical analysis was performed with the STATISTICA 13.0 software (StatSoft, Kraków, Poland).
Results
Comparison of the patients with obstetric antiphospholipid syndrome and controls at baseline
The final analysis included 62 women with OAPS and 62 well‑matched controls (Table 1). In both groups, the most common obstetric complication was PEC or PI with severe features (<34 w + 0 d) with / without fetal death (80.6% in the OAPS group and 79% in the controls). The mean (SD) time from the last obstetric complication to the study enrollment was 11.5 (4.6) months. SLE and other autoimmune diseases were observed only in the OAPS patients with at least 1 fetal loss from the 10th week of pregnancy (Supplementary material, Table S1).
Variable | OAPS (n = 62) | Controls (n = 62) | P value | High‑risk OAPS (n = 47) | Low‑risk OAPS (n = 15) | P value |
Data are presented as number (percentage) or median (interquartile range) unless indicated otherwise.
a Five women with OAPS and SLE were on corticosteroids, that is, 2–8 mg/day prednisolone and 2 on hydroxychloroquine 200 mg/day similarly to 2 control women
Abbreviations: aβ2GPI, aβ2 glycoprotein I antibodies; aCL, anticardiolipin antibodies; Ag, antigen; APS, antiphospholipid syndrome; aPS/PT, antiphosphatidylserine / prothrombin antibodies; APTT, activated partial thromboplastin time; BMI, body mass index; CLT, clot lysis time; ETP, endogenous thrombin potential; hs‑CRP; high‐sensitivity C‐reactive protein; Ig, immunoglobulin; INR, international normalized ratio; Ks, permeability coefficient; LA, lupus anticoagulant; OAPS, obstetric antiphospholipid syndrome; PAI‐1, plasminogen activator inhibitor‐1; PEC, preeclampsia; PI, placental insufficiency; SLE, systemic lupus erythematosus; TAFI, thrombin activatable fibrinolysis inhibitor; TE, thromboembolic event; vWF, von Willebrand factor | ||||||
Age, y | 33 (29–38) | 35 (31–38.8) | 0.47 | 33 (29–39.5) | 34 (27.5–39.5) | 0.81 |
BMI, kg/m2, mean (SD) | 25.6 (3.43) | 26 (2.93) | 0.49 | 25.8 (3.5) | 25.1 (3.4) | 0.52 |
Obstetric complications | ||||||
Recurrent (≥3) pregnancy loss <16 w + 0 d week | 8 (12.9) | 5 (8.1) | 0.36 | 7 (14.9) | 1 (6.7) | 0.38 |
PEC or PI with severe features (<34 w + 0 d) with / without fetal death | 50 (80.6) | 49 (79) | 37 (78.7) | 13 (86.6) | ||
PEC and PI with severe features (<34 w + 0 d) with / without fetal death | 4 (6.5) | 8 (12.9) | 3 (6.4) | 1 (6.7) | ||
Comorbidities | ||||||
Hypertension | 14 (22.6) | 16 (25.8) | 0.67 | 12 (25.5) | 2 (13.3) | 0.28 |
Diabetes | 3 (4.8) | 2 (3.2) | >0.99 | 1 (2.1) | 2 (13.3) | 0.25 |
Hypercholesterolemia | 26 (41.9) | 24 (38.7) | 0.71 | 20 (42.6) | 6 (9.7) | 0.87 |
SLEa | 7 (11.3) | 2 (3.2) | 0.22 | 6 (12.8) | 1 (6.7) | 0.13 |
Other autoimmune diseases | 2 (3.2) | 2 (3.2) | 0.49 | 1 (2.1) | 1 (6.7) | 0.85 |
APS parameters | ||||||
LA‑positive | 21 (33.9) | 0 | <0.001 | 21 (44.7) | 0 | <0.001 |
aCL IgG, GPL | 58.6 (26.1–85.9) | 6.1 (4.7–7.48) | <0.001 | 68.8 (33.45–66) | 47.5 (17.26–66) | 0.28 |
aCL IgM, MPL | 30.3 (11.1–55.9) | 8.4 (7.33–10.4) | <0.001 | 33.7 (11.68–28) | 12 (9.05–18) | 0.02 |
aβ2GPI IgG, SGU | 46.5 (7.55–76.4) | 4.2 (3.4–5.38) | <0.001 | 54.2 (32.8–45.15) | 9.1 (5.1–45.15) | 0.001 |
aβ2GPI IgM, MPU | 10.5 (7.55–33.7) | 4.8 (3.9–5.6) | <0.001 | 12 (8.38–10) | 6.9 (5.44–10) | <0.001 |
aPS/PT IgG, UI | 27.8 (13.–55.1) | 5.32 (2.37–8.98) | <0.001 | 33.2 (18.9–31.8) | 19.1 (8.75–31.8) | 0.002 |
aPS/PT IgM, UI | 17.2 (9.13–28.6) | 8.37 (4.21–11.9) | <0.001 | 18.8 (8.65–21.35) | 14.5 (10.15–31.35) | 0.16 |
Laboratory results | ||||||
hs‑CRP, mg/l | 1.89 (1.36–2.34) | 1.71 (1.04–2.16) | 0.04 | 1.88 (1.48–2.32) | 1.89 (1.16–2.32) | 0.83 |
INR | 1 (0.92–1.04) | 1.01 (0.97–1.07) | 0.23 | 0.99 (0.93–1.05) | 1.02 (0.89–1.06) | 0.19 |
APTT, s | 30.6 (28.4–32.5) | 29.4 (28.1–31.1) | 0.06 | 30.9 (29.3–39.9) | 28 (25.7–29.9) | <0.001 |
Fibrinogen, g/l, mean (SD) | 2.76 (0.42) | 2.8 (0.37) | 0.58 | 2.8 (0.4) | 2.6 (0.3) | 0.07 |
vWF, IU/dl | 142 (129–164) | 140 (118–165) | 0.39 | 147 (132–164) | 139 (121–176) | 0.43 |
ETP, nM × min, mean (SD) | 1480 (91.1) | 1420 (127) | 0.003 | 1499.2 (88) | 1438.6 (88.2) | 0.02 |
D‑Dimer, ng/ml | 287 (213–424) | 247 (199–310) | 0.07 | 287 (214–421.5) | 275 (206.8–378) | 0.58 |
Plasminogen, %, mean (SD) | 105 (12.1) | 114 (18.1) | 0.004 | 105.8 (13.2) | 104.4 (8.2) | 0.7 |
α2-Antiplasmin, % | 104 (94.3–113) | 108 (98–121) | 0.67 | 103.6 (92.8–116.2) | 105.1 (92.6–128.3) | 0.71 |
TAFI Ag, IU/dl | 104 (97.3–113) | 90 (83.3–100) | <0.001 | 104.9 (93.8–114.3) | 103.5 (94.8–114.3) | 0.85 |
PAI‑1 Ag, ng/ml | 17.9 (15.6–19.7) | 16.3 (13.8–19.2) | 0.09 | 18.2 (15.1–19.9) | 15.8 (12.3–19.7) | 0.01 |
Fibrin clot properties | ||||||
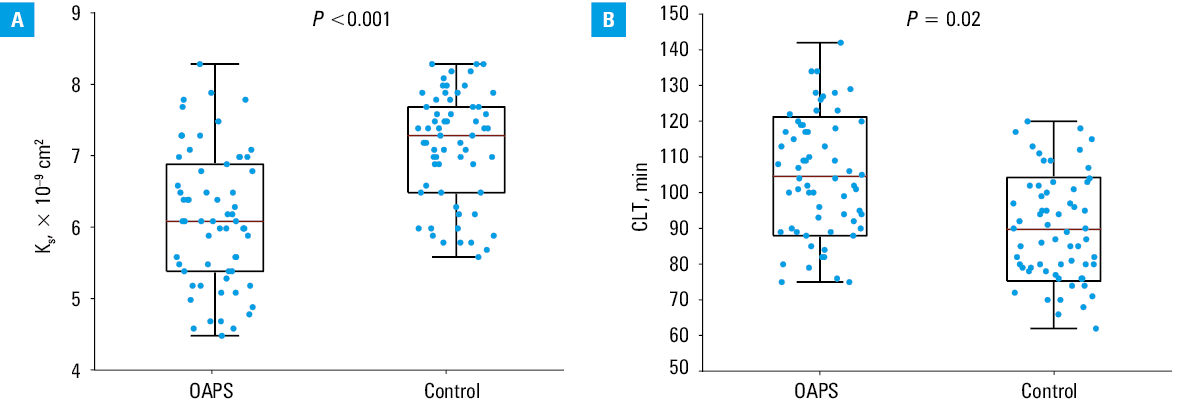
Ks, × 10–9 cm2 | 6.1 (5.4–6.88) | 7.3 (6.53–7.7) | <0.001 | 5.9 (5.2–6.4) | 6.9 (6.4–7.3) | <0.001 |
CLT, min, mean (SD) | 105 (16.6) | 89.8 (14.5) | <0.001 | 107.4 (15.9) | 95.7 (16.2) | 0.02 |
Events during follow‑up | ||||||
TE | 10 (16.1) | 2 (3.2) | 0.02 | 9 (19.2) | 1 (6.7) | 0.26 |
Twenty‑one (33.9%) patients with OAPS were positive for LA, 58 (93.5%) for aCL, and 51 (82.3%) for aβ2GPI, while 38 (61.3%) had positive aPS/PT antibodies, all of them detected after a median (IQR) of 10 (7.3–13) months since the last obstetric complication. Nineteen OAPS patients (30.6%) had a triple‑positive aPL profile (LA + aCL + aβ2GPI).
There were no intergroup differences regarding the clinical and laboratory variables, except for by 10.5% higher CRP level in the OAPS group (Table 1). The patients with OAPS had slightly higher thrombin generation capacity, evidenced by ETP (Table 1) that positively correlated with aβ2GPI IgG levels (R = 0.39; P = 0.02), but not with other aPL or APS types.
An analysis of plasma fibrin clot properties (Table 1) showed that the patients with OAPS had lower Ks than the controls (by 16.4%; Figure 1A), indicating more compact fibrin networks (Supplementary material, Figure S2), and prolonged CLT (by 16.9%; Figure 1B; both P <0.001). Ks negatively correlated with fibrinogen level (R = –0.43; P = 0.001). In the OAPS group, Ks negatively correlated with PAI‑1 level, as well as with aCL IgG, aβ2GPI IgG, and aPS/PT IgG (Supplementary material, Table S2). CLT was associated with PAI‑1 level, but not with TAFI, and also with aPS/PT IgG levels (R = 0.29; P = 0.02), but not with other aPL (Supplementary material, Table S2).
We observed lower, though within the reference range, plasminogen (by 7.9%) and higher TAFI antigen (by 15.6%) levels in the OAPS patients than in the controls, without intergroup differences in PAI‑1 or antiplasmin levels (Table 1).
No differences in fibrin clot properties and fibrinolysis proteins were reported regarding the type of obstetric complications (Supplementary material, Table S1).
Comparison of different antiphospholipid antibody profiles
High‑risk aPL OAPS participants (n = 47; 75.8%) had by 10.4% longer APTT and by 4.2% higher ETP than the remaining OAPS patients. The participants with a high‑risk vs low‑risk aPL profile had by 14.5% decreased Ks, by 12.2% longer CLT, and by 15.2% higher PAI‑1 antigen, without any other differences in the variables tested (Table 1). The patients with positive LA (alone or in combination with other aPL; n = 47; 75.8%), had by 16.8% lower Ks (Supplementary material, Figure S3A) and by 10.8% prolonged CLT (Supplementary material, Figure S3B) than those with LA‑negative OAPS.
There were no differences between the single‑positive aPL patients and the controls in laboratory paremeters related to coagulation and fibrinolysis as well as and fibrin clot properties (Supplementary material, Table S3).
Thromboembolic events
None of the patients had a TE before the study enrollment. None of the participants were lost to follow‑up (median [IQR] duration, 54 [49–58] mo). We recorded 10 (16.1%; 2.2/y) TEs in 10 participants with OAPS, including 9 from the high‑risk aPL group, and 3 (4.8%) TEs in the control group (Table 1) during follow‑up. Eight patients with OAPS experienced VTE, including 6 with DVT and 2 with PE, whereas 2 individuals experienced ischemic stroke. In the control group, 2 individuals experienced DVT and 1 woman had ischemic stroke. The participants with TE during follow‑up more commonly had hypercholesterolemia and autoimmune disorders as well as positive LA than the participants free of TE (Table 2).
Variable | OAPS with TE (n = 10) | OAPS without TE (n = 52) | P value |
Data are presented as mean (SD) or median (interquartile range) unless indicated otherwise.
Abbreviations: see Table 1 | |||
Age, y | 38 (33–42) | 33 (28–38) | 0.055 |
BMI, kg/m2 | 27.7 (3.4) | 25.3 (3.3) | 0.07 |
Comorbidities, n (%) | |||
Hypertension | 3 (30) | 11 (21.2) | 0.51 |
Diabetes | 3 (30) | 0 | 0.08 |
Hypercholesterolemia | 8 (80) | 18 (34.6) | 0.02 |
SLE | 2 (20) | 5 (9.6) | 0.03 |
Other autoimmune diseases | 1 (10) | 3 (5.8) | 0.03 |
APS parameters | |||
LA‑positive, n (%) | 7 (70) | 14 (26.9) | <0.001 |
aCL IgG, GPL | 69.7 (37.1–90.3) | 46.5 (14–60) | 0.09 |
aCL IgM, MPL | 21.8 (10.9–36.3) | 30.6 (11.3–60.9) | 0.7 |
aβ2GPI IgG, SGU | 66.1 (44.1–88.5) | 42.1 (6.6–75.9) | 0.23 |
aβ2GPI IgM, MPU | 10.3 (7.1–33.2) | 10.6 (8.1–37.7) | 0.8 |
aPS/PT IgG, UI | 48.3 (27.0–61.3) | 25.2 (11.6–52.5) | 0.09 |
aPS/PT IgM, UI | 10.7 (7.4–27.2) | 18.1 (9.7–31.3) | 0.50 |
Coagulation and fibrinolysis parameters | |||
hs‑CRP, mg/l | 1.91 (1.47–3.63) | 1.87 (1.39–2.32) | 0.32 |
INR | 0.96 (0.86–1.01) | 1 (0.93–1.05) | 0.16 |
APTT, s | 34.5 (30–50.7) | 30.2 (28.2–32.2) | 0.07 |
Fibrinogen, g/l | 2.9 (0.3) | 2.7 (0.4) | 0.19 |
vWF, IU/dl | 146 (136–163) | 142 (127.5–164.5) | 0.8 |
ETP, nM × min | 1540.1 (86.5) | 1473.8(88.9) | 0.03 |
D‑Dimer, ng/ml | 434 (281.8–492.2) | 277 (209–346) | 0.1 |
Plasminogen, % | 98.3 (16.8) | 106.8 (10.7) | 0.15 |
α2-Antiplasmin, % | 96 (92–106) | 107 (96–114) | 0.14 |
TAFI Ag, IU/dl | 106 (94–117) | 103.5 (97.5–111.5) | 0.98 |
PAI‑1 Ag, ng/ml | 19 (16.9–20.4) | 17.7 (14.5–19.7) | 0.19 |
Fibrin clot properties | |||
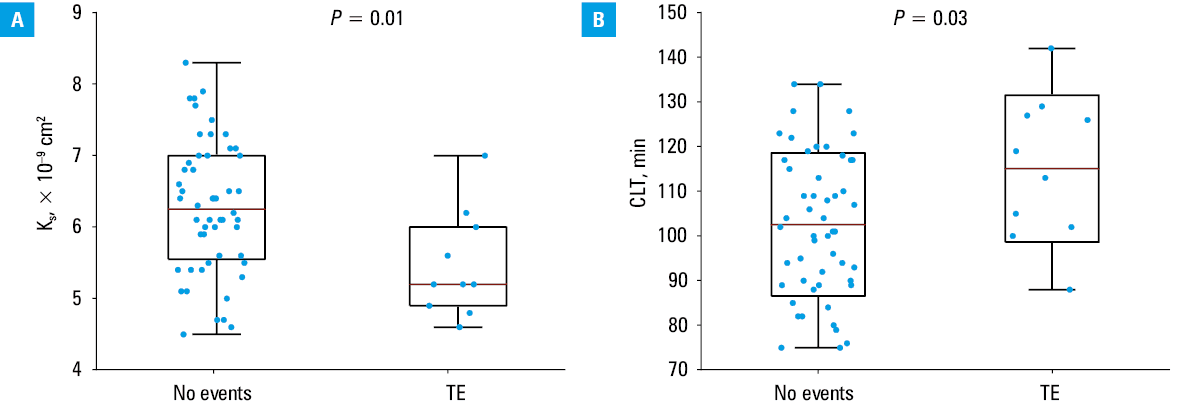
Ks, × 10–9 cm2 | 5.2 (4.9–6) | 6.3 (5.6–7) | 0.01 |
CLT, min | 115.1 (16.4) | 102.6 (16) | 0.03 |
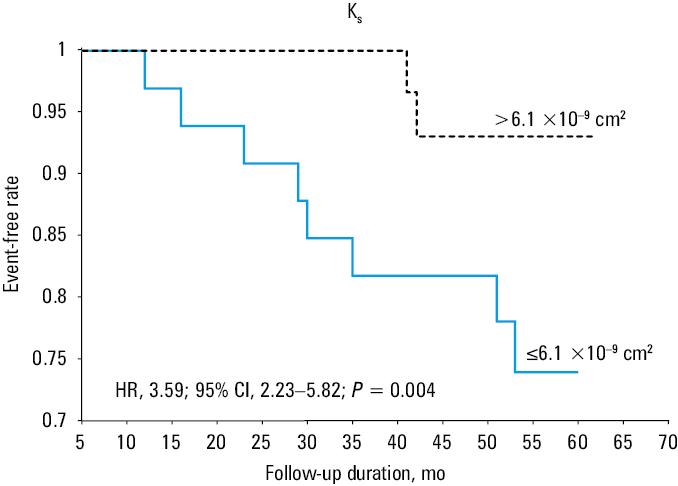
Higher ETP (by 4.5%) was observed in the patients with OAPS and TE, as compared with the remaining patients (Table 2). Interestingly, the individuals with OAPS who experienced TE had by 17.5% lower Ks (Table 2; Figure 2A) and by 12.2% longer CLT than those without TE (Table 2; Figure 2B). After adjustment for age, BMI, and fibrinogen, 5‑fold higher odds of developing TE were seen in the patients with OAPS (OR, 5.26; 95% CI, 1.27–21.87). The Kaplan–Meier event‑free survival curves showed that reduced Ks (≤6.1 × 10⁻⁹ cm2) was a predictor of TE in OAPS (Figure 3).
Discussion
This study showed that formation of denser fibrin clots displaying impaired lysability occurs in OAPS, particularly in the presence of high titers of aPL. Moreover, OAPS is related to higher thrombin generation, increased TAFI, and lower plasminogen levels, all of which might contribute to a prothrombotic state in this disease. Importantly, during long‑term follow‑up, TEs were associated with more compact fibrin networks and hypofibrinolysis.
We found similarities between OAPS and thrombotic APS regarding unfavorably altered fibrin clot properties, and showed lower fibrin clot porosity and impaired clot lysis in the patients with OAPS with high titers of aPL and those with the presence of LA. Similar findings were also reported in APS patients without prior TE.3 Moreover, the prothrombotic fibrin clot phenotype is associated with elevated levels of inflammatory markers, that is, of fibrinogen and CRP,19,20 and these factors have been consistently reported as increased in APS3 and other autoimmune diseases with unfavorably altered fibrin clot properties.21 Although fibrinogen is the key determinant of fibrin clot structure,22 it did not explain the intergroup differences in the clot characteristics in the current study, while by 10% higher CRP level in the OAPS group may contribute to the prothrombotic clot phenotype.
The increased thrombotic event rate ranging from 0.4–7.4/100 patient‑years9,23 is consistent with our study results, where 16% of the participants with OAPS (3.6/100 patient‑years) suffered from a new TE not related to pregnancy. Moreover, the current median time from pregnancy to the first TE was 4.6 (4.3–4.8) years, which is comparable to another study, where the median time was 4.8 (0.9–24.2) years.8 As previously stated, multiple aPL positivity and high‑titer IgG aCL are related to an increased risk of thrombosis,24 which agrees with our findings, as only 1 of our 15 participants with a low‑risk aPL profile experienced a TE.
Though aPS/PT antibodies have not been included in the latest APS classification criteria,6 as in thrombotic APS, there are associations between Ks and IgG aPS/PT antibodies, and such a correlation was reported for the first time in OAPS.4 Moreover, aPS/PT antibodies were found to be significant independent predictors of adverse pregnancy outcomes.25
The current standard treatment for OAPS relies on the combination of low‑molecular‑weight heparin and acetylsalicylic acid, but it fails in 20%–30% of patients.26-28 It might be speculated that another fibrin‑improving therapy might be needed in such individuals, which is in line with our previous observations.17
Fibrin architecture determines clot stability and susceptibility to lysis.21 Our findings on the predictive role of fibrin architecture and susceptibility to lysis in OAPS are of particular interest, as they were already demonstrated in thrombotic APS patients with regard to TE.16 Reduced Ks and prolonged CLT were related to TE in APS patients, regardless of anticoagulant treatment.3,16 Interestingly, this study showed that during 4.5‑year follow‑up both clot permeability and lysability can predict first‑ever TE episodes also in relatively young women with OAPS and high aPL titers. The magnitude of the observed differences in the fibrin clot features seems to be relevant, as both recurrent DVT and PE were associated with a formation of clots with by 7%–12% reduced porosity and by 11%–25% prolonged CLT.29,30 This study provides additional insights into the clinical significance of fibrin clot characteristics as a potential thrombotic risk marker by showing their predictive role in women with OAPS. Therefore, maternal characteristics can play a role in the prediction of poor obstetric outcomes.31
Our study had several important strengths, including the control group well‑matched for age, BMI, and the type of obstetric complications. In addition, our study benefited from the comprehensive analysis of fibrin clot properties along with thrombin generation. However, it also has several limitations. First, the size of the group was limited, even though the groups were well‑matched for potential confounders, including the type of obstetric complications, and the study was adequately powered to show differences in the 2 key fibrin clot properties. Nevertheless, our article should be considered hypothesis‑generating. Second, the fibrin clot properties were determined once, therefore, changes in the clot parameters over time cannot be excluded. Moreover, these methods are not standardized despite international efforts,32 and are not used in clinical practice, even though their utility in prognosis of TEs, not only in APS, has been shown in several studies.3,16,18 Finally, we did not determine other potential modulators of thrombotic risk in APS33 and fibrin clot phenotype, for example, complement activation markers34 and neutrophil extracellular trap–associated proteins.35
In conclusion, this study provides evidence for the role of fibrin clot properties in OAPS and TE during follow‑up. It might be hypothesized that evaluation of plasma clot permeability could help identify patients with OAPS who are more likely to develop TE, which might have practical implications and highlight the need for novel therapeutic approaches.
- Schreiber K, Sciascia S, de Groot PG, et al. Antiphospholipid syndrome. Nat Rev Dis Primers. 2018; 4: 17103. | Crossref
- Manning JE, Arachchillage DJ. Dilemmas in the diagnosis and management of antiphospholipid syndrome. J Thromb Haemost. 2024; 22: 2156‑2170. | Crossref
- Celińska‑Lowenhoff M, Iwaniec T, Padjas A, et al. Altered fibrin clot structure / function in patients with antiphospholipid syndrome: association with thrombotic manifestation. Thromb Haemost. 2014; 112: 287‑296. | Crossref
- Ząbczyk M, Celińska‑Löwenhoff M, Plens K, et al. Antiphosphatidylserine / prothrombin complex antibodies as a determinant of prothrombotic plasma fibrin clot properties in patients with antiphospholipid syndrome. J Thromb Haemost. 2019; 17: 1746‑1755. | Crossref
- Ambati A, Knight JS, Zuo Y. Antiphospholipid syndrome management: a 2023 update and practical algorithm‑based approach. Curr Opin Rheumatol. 2023; 35: 149‑160. | Crossref
SUPPLEMENTARY MATERIAL
ARTICLE INFORMATION