Monoclonal and oligoclonal gammopathies secondary to allogeneic hematopoietic cell transplantation: a phenomenon associated with an increased survival and frequency of chronic graft-versus-host disease
Key words: allogeneic transplantation, chronic graft-versus-host disease, long-term survival, monoclonal gammopathy, oligoclonal gammopathy

 CC BY 4.0
Monoclonal and oligoclonal gammopathies secondary to allogeneic hematopoietic cell transplantation: a phenomenon associated with an increased survival and frequency of chronic graft-versus-host disease
Introduction: The occurrence of monoclonal gammopathies (MGs) and oligoclonal gammopathies (OGs; 2 or more monoclonal proteins) might be triggered by such factors as immune recovery following allogeneic hematopoietic cell transplantation (allo‑HCT). It has been suggested that post–allo‑HCT gammopathy is associated with increased survival and frequent occurrence of chronic graft‑versus‑host disease (cGvHD).
Objectives: This study aimed to verify these notions by comparing patients with and without gammopathy and, similarly, patients with MG and OG after allo‑HCT in terms of long‑term survival, the incidence and severity of cGvHD, and patient characteristics. Moreover, we aimed to explain the relation between allo‑HCT, the onset of gammopathy, and cGvHD diagnosis.
Patients and methods: Among 241 allo‑HCT recipients evaluated from 2014 to 2024, we identified 36 cases of post–allo‑HCT gammopathy (20 MG and 16 OG). From the remaining allo‑HCT recipients, we selected a case‑by‑case matched control group of patients without gammopathy. Survival was analyzed with the Kaplan–Meier method, the Cox proportional hazards model, and the log‑rank test.
Results: The patients with post–allo‑HCT gammopathy had a superior 5‑year overall survival (OS) rate, as compared with the control group (79.6% vs 50.9%; P = 0.02). The frequency of cGvHD was significantly higher in the gammopathy group (odds ratio, 4.02). OG was identified mostly before cGvHD diagnosis (median [interquartile range, IQR], 6.3 [14.2–2.5] months following allo‑HCT), while MG mostly after cGvHD diagnosis (median [IQR], 4.5 [0.9–20] months following allo‑HCT).
Conclusions: Post–allo‑HCT gammopathies (both MG and OG) are associated with better prognosis and increased frequency of cGvHD. There are only minor clinical differences between the patients with post–allo‑HCT MG and OG.
What's new?
The occurrence of gammopathy following allogeneic hematopoietic cell transplantation (allo‑HCT) has been confirmed as an effective prognostic factor in patients with malignancies of the hematopoietic system. The occurrence of chronic graft‑versus‑host disease (cGvHD) was increased in patients with gammopathy. We showed that the superiority of overall survival did not exceed 10 years, and that clinical characteristics and survival benefits were independent of the number of monoclonal proteins detectable in patient serum. Oligoclonal gammopathies occurred mostly before, and monoclonal gammopathies mostly after cGvHD diagnosis, implying both types of post–allo‑HCT gammopathy to be probably different stages of a single phenomenon related to cGvHD. Patients with various gammopathy types did not differ regarding the frequency and severity of cGvHD.

Introduction
Monoclonal gammopathy (MG) is described as the presence of monoclonal protein (M protein) in patient serum or urine, detected on electrophoresis with subsequent immunofixation. It is produced by clonal, genetically aberrant plasma cells, frequently associated with plasma cell dyscrasias, such as multiple myeloma (MM), Waldenström macroglobulinemia, or light chain amyloidosis.1
Oligoclonal gammopathy (OG) involves the presence of at least 2 distinct M proteins in patient serum or urine, detected on electrophoresis with subsequent immunofixation. In 65% of cases, its occurrence is related to MM, classified as Durie–Salmon IIIA or IIIB, without major differences between patients with biclonal (2 distinct M proteins) and triclonal (3 distinct M proteins) gammopathy regarding clinical characteristics and long‑term survival.2,3 OG involves 3%–6% of gammopathies, and might be identified as an initial diagnosis or occur following treatment of plasma cell dyscrasias, including autologous transplantation.4
Gammopathy might also occur during immune recovery following allogeneic hematopoietic cell transplantation (allo‑HCT)5 or solid organ transplantation.6 Factors associated with post–allo‑HCT gammopathy include the occurrence of chronic graft‑versus‑host disease (cGvHD),7,8 viral reactivation (Epstein–Barr virus [EBV]9 and cytomegalovirus [CMV])10, or alemtuzumab‑based conditioning regimens.10
Immunoglobulin G (IgG) is the most common M protein type in post–allo‑HCT gammopathy (75% of cases).7 The frequency of post–allo‑HCT gammopathy varies from 10%,11 14%,7 to even 36%8 of all recipients. Therefore, it is more frequent than in the general population, where gammopathy is identified in 3% of people aged over 50 years.1 Oligoclonal post–allo‑HCT gammopathy accounts for 15% of all post–allo‑HCT gammopathies.7 In most cases (77.8%), post–allo‑HCT gammopathy is identified during 12 months following transplantation,11 with a median period of detection of only 6 months.7,8
As described in previous studies,2,3 there are in general only minor clinical differences between patients with MG and OG. However, it is still uncertain whether this finding is applicable to post–allo‑HCT gammopathies. Moreover, the impact of M protein abundance on prolonged survival and increased frequency of cGvHD, typically observed in patients with post–allo‑HCT gammopathy, remains unknown. Regarding cGvHD, precise data on particular organ involvement and disease severity in patients with and without post–allo‑HCT gammopathy are still lacking. Moreover, previous survival analyses of these groups were truncated after 5 years of observation. A longer potential impact of post–allo‑HCT gammopathy on increased survival cannot be ruled out. Lastly, the temporal relationship between allo‑HCT, the onset of gammopathy (both MG and OG), and the diagnosis of GvHD is still unknown.
This study aimed to estimate the incidence of post–allo‑HCT gammopathy and compare patients with and without gammopathy. We also compared the patients with MG and OG after allo‑HCT in terms of long‑term survival, the frequency and severity of cGvHD, and patient characteristics. Moreover, we attempted to analyze and explain the relationships between allo‑HCT, the onset of gammopathy, and the diagnosis of cGvHD.
Patients and methods
Study design
In this retrospective study, we searched our database of allo‑HCT recipients from 2014 to 2024. The only inclusion criterion was the occurrence of at least 1 M protein peak verified by immunofixation after the date of allo‑HCT. The exclusion criterion was the presence of gammopathy before allo‑HCT. Next, we extracted clinical data from the hospital records of patients included in the analysis.
Setting and study size
The analysis concerned relevant clinical data of allo‑HCT recipients, undergoing a transplant from January 2014 to December 2024, who met the inclusion criterion. The data were collected from November 2024 to April 2025. The inclusion period was chosen to maximize the chance of identifying individuals with post–allo‑HCT gammopathy. Data availability before the year 2014 was limited.
Participants
Among 241 allo‑HCT recipients, we identified 36 patients with gammopathy who were divided into 2 subgroups: 20 patients with MG and 16 with OG. In another 43 patients, serum protein electrophoresis with subsequent immunofixation were performed at least once after allo‑HCT. However, in these cases, no M protein was identified, and hence, these patients were not included in the study. Subsequently, we analyzed and gathered relevant data for all 36 participants. Then, in the same initial cohort, we identified 36 individuals without gammopathy, case‑by‑case matched for sex, age at transplantation, donor type, and diagnosis being an indication for allo‑HCT. As our study involved retrospective analysis of already existing data from past hospital records and no intervention requiring patient informed consent was performed, the study did not require an approval of the ethics committee.
Variables
The analyzed data included age at transplantation, sex, disease being an indication for transplantation, donor type, M protein type(s), conditioning regimen, date of transplantation, date of immunofixation, and date of the last follow‑up for all participants. Furthermore, if applicable, we also accounted for date of death, date of relapse / progression, date of cGvHD diagnosis, organ and global severity of the disease according to the 2014 National Institute of Health (NIH) criteria,12 date of acute GvHD (aGvHD) diagnosis, organ and global severity of the disease according to the MAGIC criteria,13 and other variables potentially associated with post–allo‑HCT gammopathy occurrence.
Statistical analysis
Quantitative variables were analyzed and compared in terms of the number of cases, percentage, incidence (in %), incidence rate (in cases per person‑years), mean with corresponding 95% CIs and SD, median with corresponding interquartile ranges, hazard ratio (HR) with corresponding 95% CIs, overall survival (OS), and progression‑free survival (PFS). Normal distribution of the data in the analyzed groups was evaluated with the Shapiro–Wilk test. The equality of variances was assessed with the Levene test. Based on these results, differences between the groups were evaluated with the Student t test, Welch t test, or Mann–Whitney test for continuous data. The χ2 test and the method of logistic regression of univariable outcomes were used for categorical data. Survival analysis was performed for the gammopathy group vs the matched control group and for the MG group vs the OG group. Survival curves were evaluated with the Kaplan–Meier method. OS was calculated from the date of allo‑HCT to the date of death from any cause, with living patients censored on the last follow‑up date. PFS was calculated from the date of allo‑HCT to the date of relapse / progression or death from any cause, with living patients without relapse / progression censored on the last follow‑up date. HRs were assessed with the Cox proportional hazards model. Comparisons of survival distributions were performed using the log‑rank test. For all tests, a P value below 0.05 was chosen as a default threshold necessary to reject the null hypothesis. In the case of multiple comparisons for variables with more than 2 categories, the thresholds of significance were adjusted using the Bonferroni correction of P values. All necessary data analyses were performed using Statistica version 13.3 (TIBCO Software Inc., Palo Alto, California, United States).
Results
Gammopathy vs no gammopathy
Among the 241 allo‑HCT recipients, we identified 36 cases of post–allo‑HCT gammopathy (incidence, 14.9%; incidence rate, 0.142 cases per person‑years). Then, their characteristics were compared with corresponding data for the matched control group. Comprehensive data on patient characteristics in both groups are showed in Table 1.
Parameter | Gammopathy group | Matched control group | P valuea |
a In the case of multiple comparisons in relation to variables with more than 2 categories, the thresholds of significance were adjusted using the Bonferroni correction of P values.
Abbreviations: ALL, acute lymphoblastic leukemia; AML, acute myeloid leukemia; CML, chronic myeloid leukemia; CMML, chronic myelomonocytic leukemia; HL, Hodgkin lymphoma; MDS, myelodysplastic syndrome; MMUD, mismatched unrelated donor; MRD, matched related donor; MUD, matched unrelated donor; NHL, non‑Hodgkin lymphoma; PMF, primary myelofibrosis | |||
Sex | 25 men, 11 women | 26 men, 10 women | 0.8 |
Age at transplantation, y, mean (SD) | 44.9 (16) | 44.7 (16.1) | 0.97 |
Donor type, n | |||
MRD | 12 | 9 | 0.44 |
MUD | 18 | 19 | 0.81 |
MMUD | 3 | 6 | 0.29 |
Haploidentical | 3 | 2 | 0.64 |
Indications, n | |||
AML | 16 | 17 | 0.8 |
ALL | 6 | 4 | 0.5 |
MDS | 5 | 4 | 0.72 |
CMML | 2 | 2 | >0.99 |
PMF | 1 | 1 | >0.99 |
CML | 1 | 2 | 0.56 |
HL | 2 | 1 | 0.56 |
NHL | 3 | 5 | 0.45 |
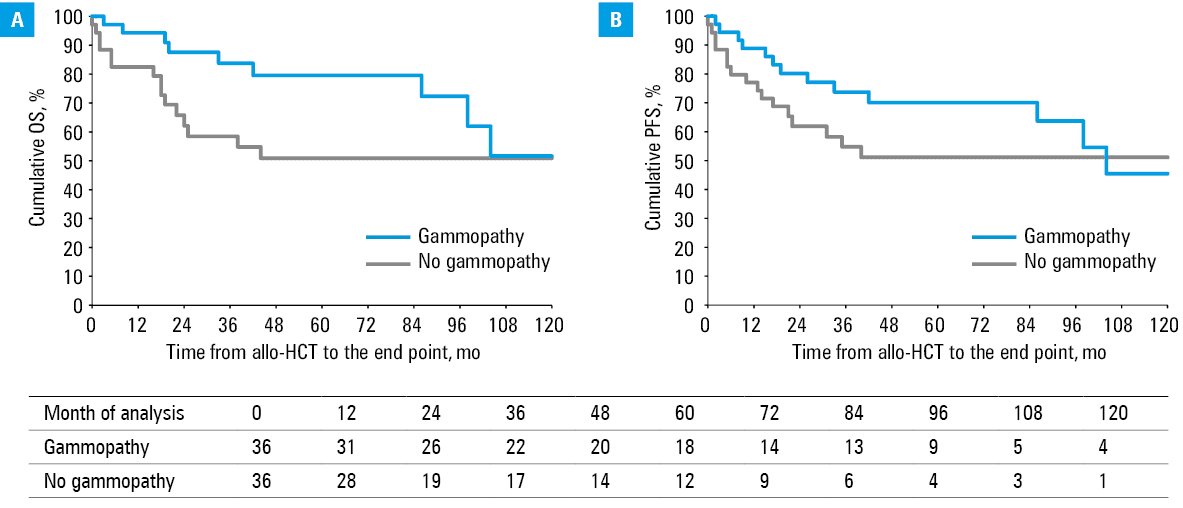
For the groups with and without post–allo‑HCT gammopathy, 5‑year OS rates were 79.6% and 50.9%, respectively (HR, 3.05; 95% CI, 1.18–7.86; P = 0.02). After 10 years from transplantation, survival was highly comparable, with OS rate of 51.7% and 50.9%, respectively (HR, 2.19; 95% CI, 0.95–5.03; P = 0.06). Similarly, 5- and 10‑year PFS rates were 70.1% and 51.2% (HR, 1.91; 95% CI, 0.86–4.21; P = 0.1) and 45.5% and 51.2% (HR, 1.54; 95% CI, 0.74–3.22; P = 0.25), respectively. The Kaplan–Meier curves are showed in Figure 1.
The frequency of aGvHD in the gammopathy and control groups was also similar (22.2% vs 19.4%; P = 0.77), with no major differences in aGvHD severity according to the MAGIC criteria (mild, P = 0.64; moderate, P = 0.45; and severe, P = 0.15).
On the other hand, cGvHD occurred more frequently in the gammopathy group (63.9% vs 30.6%; OR, 4.02; 95% CI, 1.5–10.74; P = 0.005). There was no difference in terms of the severity of cGvHD according to the 2014 NIH criteria (mild, P = 0.5; moderate, P = 0.06; and severe, P = 0.21). The organs involved more frequently in the gammopathy group included the skin (P = 0.004), oral cavity (P = 0.009), gastrointestinal tract (P = 0.006), and liver (P = 0.01). No differences were observed for the eyes (P = 0.55), lungs (P = 0.45), joints (P = 0.08), and the hematopoietic system (P = 0.09).
Monoclonal vs oligoclonal gammopathy
Among the 36 individuals with post–allo‑HCT gammopathy, we identified 20 MG and 16 OG cases. There were no major differences between the MG and OG groups in terms of sex (P = 0.42) and age at transplantation (P = 0.22). Mean (SD) age at transplantation was 47.1 (17) years (95% CI, 38.9–55.3) for the MG group and 42.2 (13) years (95% CI, 35–49.3) for the OG group. Moreover, the groups did not differ in terms of donor type, type of conditioning, and the most common underlying diseases.
The most commonly identified M protein types were IgGλ and IgGκ, which occurred in 9 and 7 patients with MG, respectively, and in all but 1 patient as part of protein combination in the OG group. Moreover, 9 in 16 patients in the OG group had both IgGλ and IgGκ identified with immunofixation. Comprehensive data on patient characteristics are showed in Table 2.
ID | Sex | Age at HCT, y | Indication for transplantation | Type of monoclonal protein(s) |
Abbreviations: aCML, atypical chronic myeloid leukemia; DLBCL, diffuse large B‑cell lymphoma; FL, follicular lymphoma; MAC, myeloablative conditioning; M, man; PTCL, peripheral T‑cell lymphoma; RIC, reduced‑intensity conditioning; SAA, severe aplastic anemia; T‑LBL, T‑cell lymphoblastic lymphoma; W, woman; others, see Table 1 | ||||
1 | M | 23 | AML | IgGκ |
2 | M | 50 | PMF | IgMκ |
3 | M | 25 | ALL | IgGκ |
4 | M | 17 | AML | IgGκ |
5 | M | 60 | MDS | IgMλ |
6 | M | 62 | CMML | IgGλ |
7 | M | 38 | PTCL | IgGλ |
8 | M | 49 | AML | IgGλ |
9 | M | 60 | MDS | IgGλ |
10 | M | 59 | AML | IgGκ |
11 | M | 66 | AML | IgMκ |
12 | M | 40 | DLBCL | IgGκ |
13 | W | 41 | AML | IgGκ |
14 | M | 21 | AML | IgGλ |
15 | M | 67 | AML | IgGκ |
16 | W | 61 | AML | IgAκ |
17 | W | 64 | AML | IgGλ |
18 | W | 56 | AML | IgGλ |
19 | W | 57 | FL | IgGλ |
20 | M | 17 | ALL | IgGλ |
21 | W | 46 | AML | IgGλ, IgMλ |
22 | M | 35 | MDS | IgGκ, IgMκ |
23 | M | 61 | CMML | IgGκ, IgGλ |
24 | W | 58 | AML | IgGκ, IgGλ |
25 | W | 57 | CML | IgGκ, IgGλ |
26 | M | 44 | PTCL | IgGκ, IgGλ |
27 | M | 24 | ALL | IgMλ, IgGκ |
28 | W | 36 | HL | IgMκ, IgGλ |
29 | M | 28 | T‑LBL | IgGκ, IgGλ |
30 | W | 37 | AML | IgGκ, IgGλ |
31 | W | 47 | AML | IgGλ, IgMκ |
32 | M | 57 | aCML | IgMκ, IgMλ |
33 | M | 28 | ALL | IgGλ, IgMλ |
34 | M | 55 | MDS | IgGκ, IgGλ, IgAλ |
35 | M | 18 | AML | IgGλ, IgMκ, IgGκ |
36 | M | 36 | AML | IgMκ, IgGλ, IgGκ |
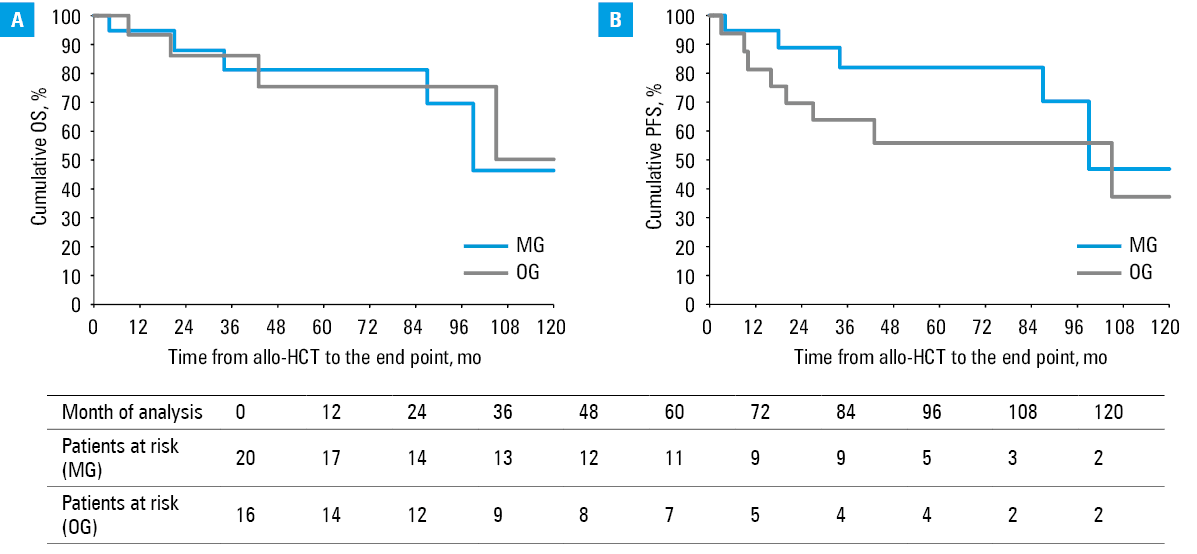
For patients with MG and OG secondary to allo‑HCT, 5‑year OS rates were 81.2% and 75.4%, respectively, and 10‑year OS rates were 46.4% and 50.3%, respectively. The groups did not differ much in terms of either 5‑year OS (HR, 0.81; 95% CI, 0.16–4.04; P = 0.8) or 10‑year OS (HR, 1.02; 95% CI, 0.27–3.83; P = 0.98). Similarly, 5‑year PFS rates were 82% and 55.9%, respectively, and 10‑year PFS rates were 46.8% and 37.2%, respectively. The groups did not differ markedly in terms of either 5‑year PFS (HR, 0.3; 95% CI, 0.08–1.17; P = 0.07) or 10‑year PFS (HR, 0.43; 95% CI, 0.14–1.31; P = 0.13). The Kaplan–Meier curves are showed in Figure 2.
There was no significant difference in terms of the frequency of aGvHD between the MG and OG groups (30% vs 12.5%; P = 0.21). No difference was also observed regarding the severity of aGvHD according to the MAGIC criteria.
The incidence of cGvHD was very high in both groups. The patients with MG and OG did not differ in terms of the frequency of cGvHD (55% vs 75%, P = 0.22). There were also no differences in terms of particular organ involvement. Considering global severity, the incidence of moderate (P = 0.44) and severe cGvHD (P = 0.72) was similar in both groups. Mild cGvHD occurred more frequently in the OG group (P = 0.04).
Relationship between allogeneic hematopoietic cell transplantation, gammopathy, and chronic graft‑versus‑host disease
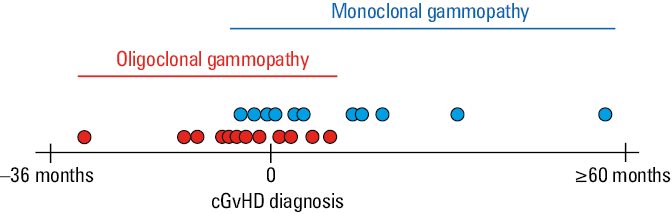
The mean (SD) time from allo‑HCT to immunofixation that confirmed the occurrence of secondary gammopathy was 16 (14.5) months for the MG group and 7.9 (6.3) months for the OG group. This difference (P = 0.06) implied a high probability of MG to be identified later than OG. The mean (SD) difference in time from allo‑HCT to the diagnosis of cGvHD was 9.1 (4.8) months for the MG group and 14.9 (9.3) months for the OG group (P = 0.09). Considering the diagnosis of cGvHD as a fixed point in time and relating it to the occurrence of gammopathy, the P value reached 0.009. Interestingly, OG was identified mostly before cGvHD diagnosis (median [IQR] of 6.3 [14.2–2.5] months following allo‑HCT), and MG mostly following cGvHD diagnosis (median [IQR] of 4.5 [0.9–20] months following allo‑HCT). Moreover, most MG and OG cases were identified in the interval from 12 months before to 12 months following cGvHD diagnosis. Comprehensive data are presented in Figure 3.
Gammopathy risk factors
Almost every patient in our study was diagnosed with infectious complications following allo‑HCT during immunosuppressive therapy. Such complications included viral reactivations (EBV, CMV, hepatitis B virus, human papillomavirus, varicella zoster virus, human herpesvirus 6, human polyomavirus 1), bacterial sepsis, and fungal pulmonary infections. Moreover, 2 patients were diagnosed with post‑transplant lymphoproliferative disease as a result of EBV reactivation. There were also 3 other secondary malignancies, namely renal cell carcinoma, lung squamous cell carcinoma, and head and neck carcinoma. All 3 cases of secondary malignancies occurred late following transplantation (about 3.5, 8, and 8.5 years following the procedure, respectively) in patients who remained in complete remission of the disease that was the original indication for allo‑HCT. One patient was diagnosed with Wiskott–Aldrich syndrome in childhood. Some individuals suffered from vasculitis. However, in these cases, it was difficult to differentiate between microangiopathy following allo‑HCT, drug‑related complications, or atypical cGvHD. None of the patients received alemtuzumab‑based conditioning. The gammopathy‑inducing potential of the mentioned factors has already been documented.14 Furthermore, 6 patients were preemptively treated with donor lymphocyte infusions. In 2 patients, natural killer cell lymphocytosis of uncertain significance was identified. One patient was diagnosed with hemophagocytic lymphohistiocytosis. One patient was treated with chimeric antigen receptor T‑cells following allo‑HCT. The gammopathy‑inducing potential of these factors has not been confirmed yet.
Discussion
The incidence of post–allo‑HCT gammopathy was 36 per 241 cases (14.9%), similarly to other studies.7,11 According to another analysis of 18 cases,11 5‑year OS rates for allo‑HCT recipients with and without secondary gammopathy were 70.8% and 30.3%, respectively (HR, 3.5; P = 0.003). Moreover, similar results were observed in terms of 5‑year PFS rates, that is, 64.4% and 29.4%, respectively (HR, 2.6; P = 0.01).11 In our study, the difference in PFS between the groups was insignificant. Furthermore, the fact that initial survival differences disappeared after 10 years of observation is a novelty. It is hypothesized that early survival benefits might be associated with the graft‑versus‑leukemia effect, with gammopathy being a hint of the underlying process.7
No survival differences between the patients with secondary MG and OG were suspected in previous studies.7,11 However, the OG groups were too small to obtain valid results. Similar survival rates in our study support the notion that MG and OG are most probably not distinct conditions.
The incidence of post–allo‑HCT MG and OG was similar in our study, with 20 and 16 cases in the entire group, respectively. It was higher than the incidence of 15% for OGs among all post–allo‑HCT gammopathies reported in a study of 52 paraproteinemia cases.7 In another study, 8 MGs and 4 OGs (including 1 case of triclonal gammopathy) were identified after allo‑HCT, which was a proportion closer to our findings.5 This divergence in results might be explained by various patient characteristics, for example, different age at diagnosis and indications for allo‑HCT, that is, acute lymphoblastic leukemia5 or myelodysplastic syndrome8 as the primary diagnosis. The fact that IgGκ and IgGλ were the most common M protein types is consistent with other studies on MGs1,7,8 and OGs.2,3 In fact, this observation is common considering any kind of gammopathy.
The occurrence of gammopathy following allo‑HCT is significantly more frequent than in the general population. Moreover, the observation that it is associated with increased frequency of cGvHD may suggest that it is a part of a complex phenomenon of immune reconstitution after establishing a new immune system following the graft implantation. Increased regulatory pressure for reconstitution and reduced check‑point control may favor the development of mutated clone or clones. However, no progression to symptomatic plasma cell dyscrasia was observed in any of these cases. There is also a possibility that these clones are not mutated, despite having an increased proliferation rate, as compared with normal cells. In fact, other studies showed that post–allo‑HCT gammopathies are transient and have a reactive rather than neoplastic character (unlike persistent, symptomatic gammopathies in plasma cell dyscrasias).7,11,15
Gammopathy secondary to allo‑HCT is an underexplored phenomenon associated with cGvHD. As immune reactiveness following allo‑HCT is sufficient to explain the occurrence and progression of cGvHD, it might also explain the presence of gammopathy. Namely, patients with cGvHD produce excessive amounts of B‑cell activating factor, which promotes B‑cell maturation and survival. Hence, it is associated with an increased production of plasma cells and, subsequently, antibodies.7,16 However, the known and potential risk factors are heterogeneous, which complicates the analysis. The incidence of cGvHD in the gammopathy group was very high in our study. Interestingly, the time between the diagnosis of cGvHD and the identification of gammopathy was mostly approximately 12 months. This implies that the presence of gammopathy might indeed be associated with the disease, as previously suggested by other studies.7,8 On the other hand, the incidence of aGvHD was much lower in both groups. It was obviously related to allo‑HCT rather than to gammopathy.
Post–allo‑HCT gammopathies might result from numerous causes related to allo‑HCT. However, considering only minor differences between the MG and OG groups, the crucial observation of our study refers to the time dependency between post–allo‑HCT gammopathy and the diagnosis of cGvHD. Namely, OG was diagnosed mostly before, and MG mostly after cGvHD diagnosis. This might imply that both types of gammopathy are a single phenomenon identified at different points in time, rather than distinct conditions. Furthermore, post–allo‑HCT gammopathies are associated with EBV and CMV reactivation,9,10 and other factors that typically activate polyclonal hypergammaglobulinemia.14 Therefore, post–allo‑HCT gammopathies probably begin as polyclonal, transiently decline through OG to MG, and eventually resolve on their own or as a result of targeted therapy (eg, immunosuppressive or antiviral drugs). In conclusion, unlike most MGs and OGs, post–allo‑HCT gammopathies are likely to be stages and hallmarks of a limiting reactive process rather than a disease.
Limitations
The study was based on the hospital records of historical patient groups. As it was impossible to find more participants, the group sizes remained small. Although we did our best to include matching patients without gammopathy in the control group, there is always a possibility of selection bias. Moreover, serum protein electrophoresis and subsequent immunofixation were performed only in the patients suspected of monoclonal gammopathy by a clinician. It was not performed routinely in all patients after allo‑HCT or in all patients diagnosed with cGvHD due to a lack of such recommendations. As a result, post–allo‑HCT gammopathy is probably underdiagnosed. The fact that cGvHD occurs more frequently in the patients with post–allo‑HCT gammopathy might be confounded with superior OS of these patients. As they survive longer following transplantation, they have an increased chance of cGvHD diagnosis.
Conclusions
Post–allo‑HCT gammopathy is a laboratory finding frequently identified following allogeneic transplantation, most probably as a transient result of the immune reconstitution. It is not associated with an increased risk of plasma cell dyscrasias, but is most probably a reactive phenomenon. The occurrence of post–allo‑HCT gammopathy improves long‑term survival following transplantation and correlates with frequent incidence of cGvHD. The number of monoclonal proteins identified in patients’ serum via immunofixation probably does not have a clinical significance. As the differences between MG and OG groups are minor, both situations are probably different laboratory presentations of a single phenomenon, rather than distinct conditions.
- Kyle RA, Rajkumar SV. Monoclonal gammopathy of undetermined significance. Clin Lymphoma Myeloma. 2005; 6: 102‑114. | Crossref
- Karaszewski K, Jasiński M, Waszczuk‑Gajda A, et al. Oligoclonal gammopathy: an analysis of 253 cases. Adv Clin Exp Med. 2024; 33: 127‑134. | Crossref
- Jurczyszyn A, Gozzetti A, Gdula‑Argasińska J, et al. Similar survival outcomes in patients with biclonal versus monoclonal myeloma: a multi‑institutional matched case‑control study. Ann Hematol. 2017; 96: 1693‑1698. | Crossref
- Mullikin TC, Rajkumar SV, Dispenzieri A, et al. Clinical characteristics and outcomes in biclonal gammopathies. Am J Hematol. 2016; 91: 473‑475. | Crossref
- Nagashima T, Muroi K, Kawano‑Yamamoto C, et al. Paraproteinemia after hematopoietic stem cell transplantation. Leuk Lymphoma. 2004; 45: 135‑137. | Crossref
ARTICLE INFORMATION